
Step 4: Analyze Conjoint Data
What's on this page
Conjoint projects provide you with several tools to optimize the reporting experience. Whether you are looking to share data with colleagues or to merely glance through your results, conjoint projects generate reports for you! You don’t even have to worry about customization. Qualtrics uses hierarchical Bayesian estimation to calculate respondent-level utility scores. These scores indicate what each respondent prefers, and ultimately are used to predict the optimal package you should offer.Qtip: Conjoint projects are an additional purchase. Please contact your Account Executive if you are interested in learning more about this product.
Conjoint Analysis Reports
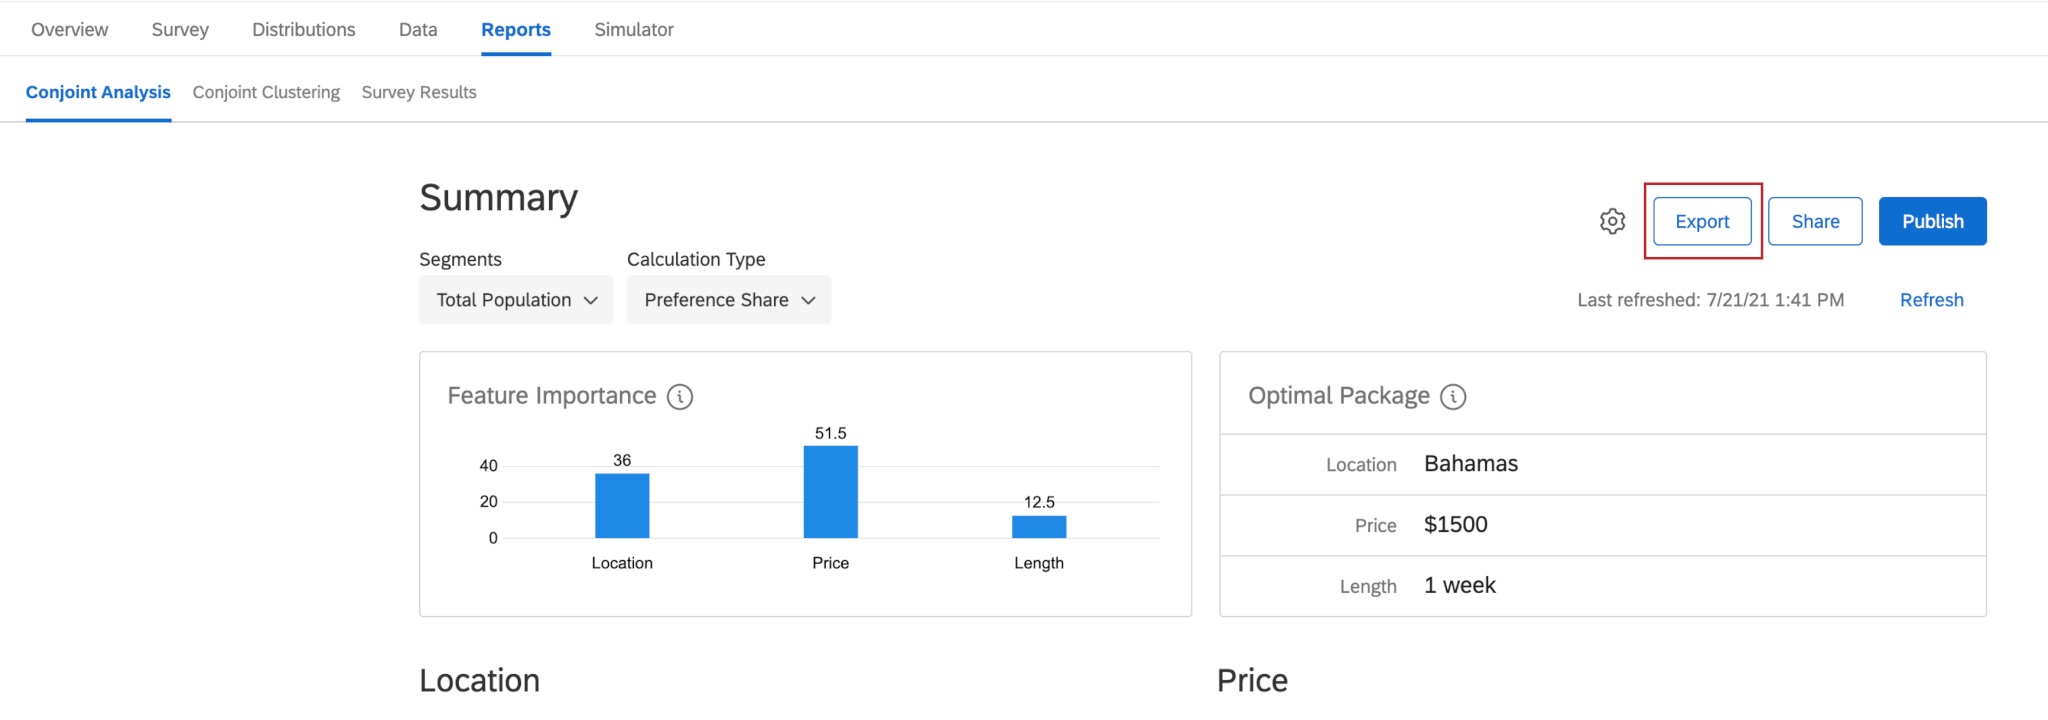
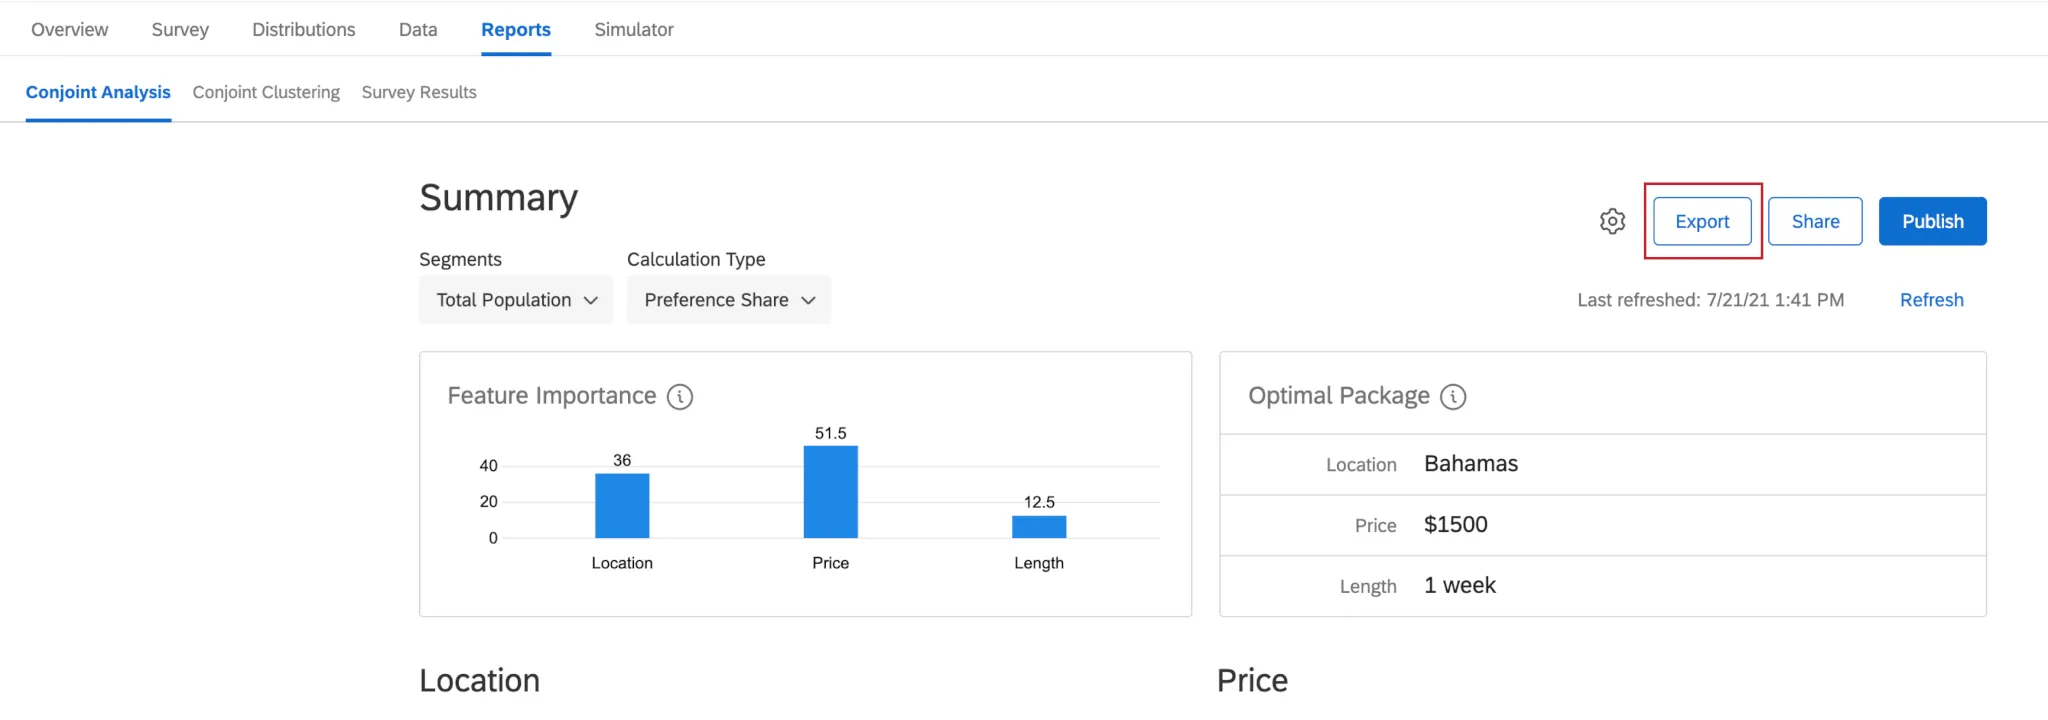
The Conjoint Analysis section of the Reports tab contains pre-made tables and graphs to help you understand your results.
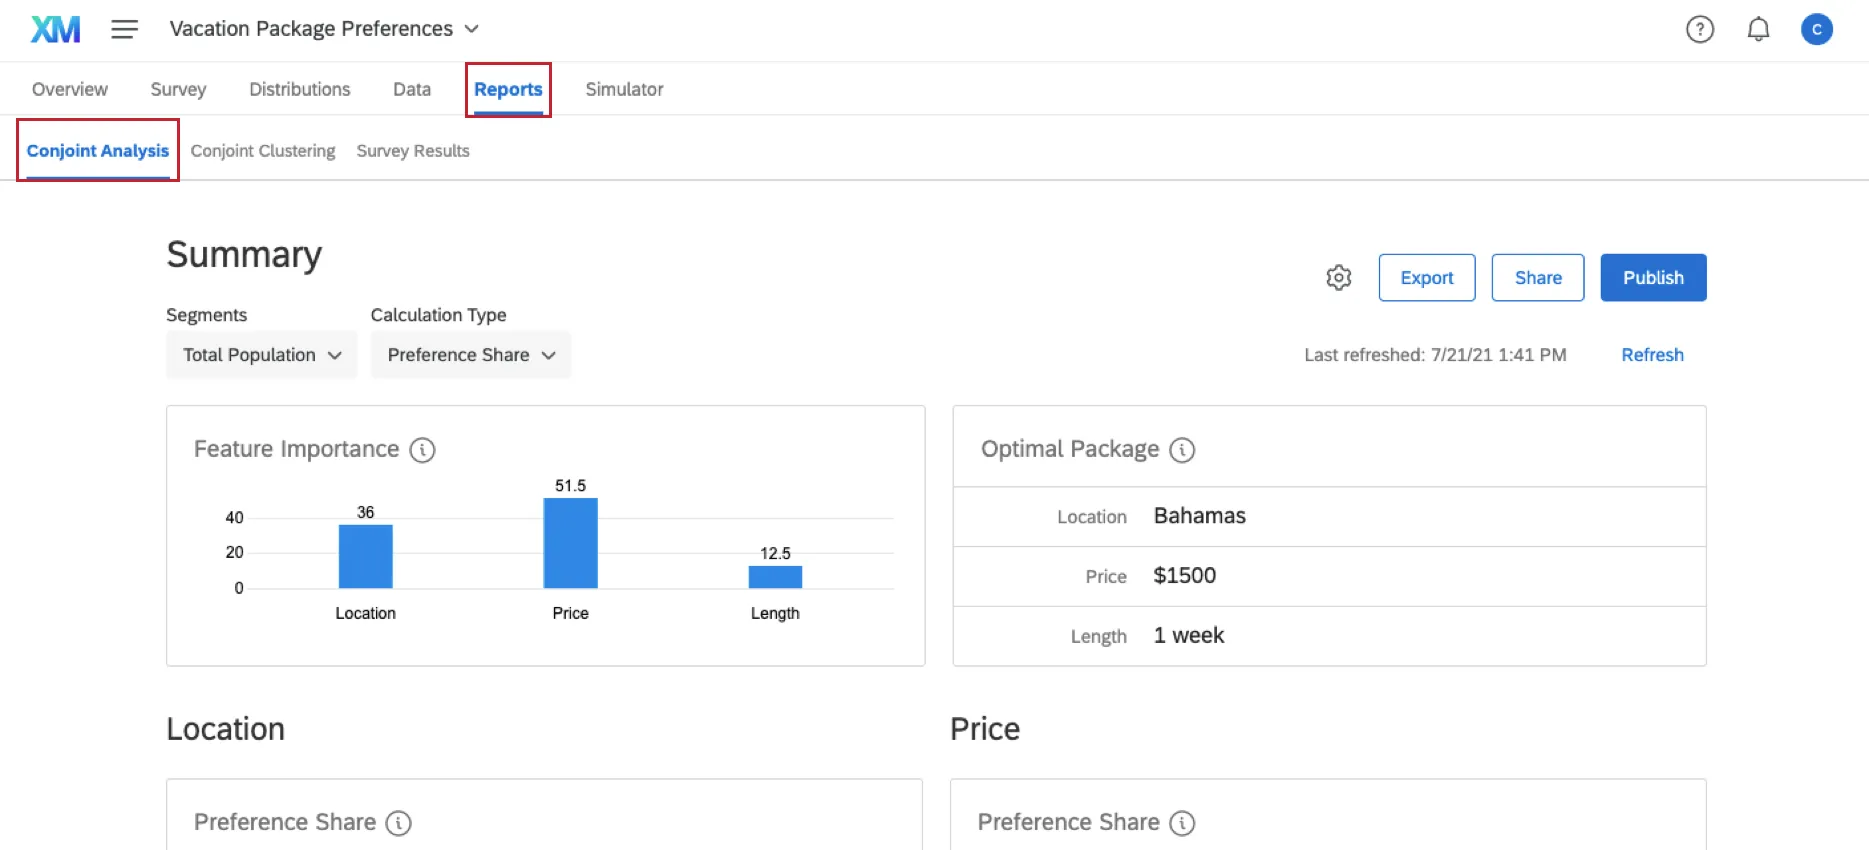
Every visualization has a helpful tooltip to explain what data it displays, and what this data means. Below are the data points your reports will contain:
- Feature Importance: The measurement of influence a feature has when the respondent is choosing their preferred bundle. The higher the score, the more weight it carries in the decision-making process. This table compares each of your features’ importance.
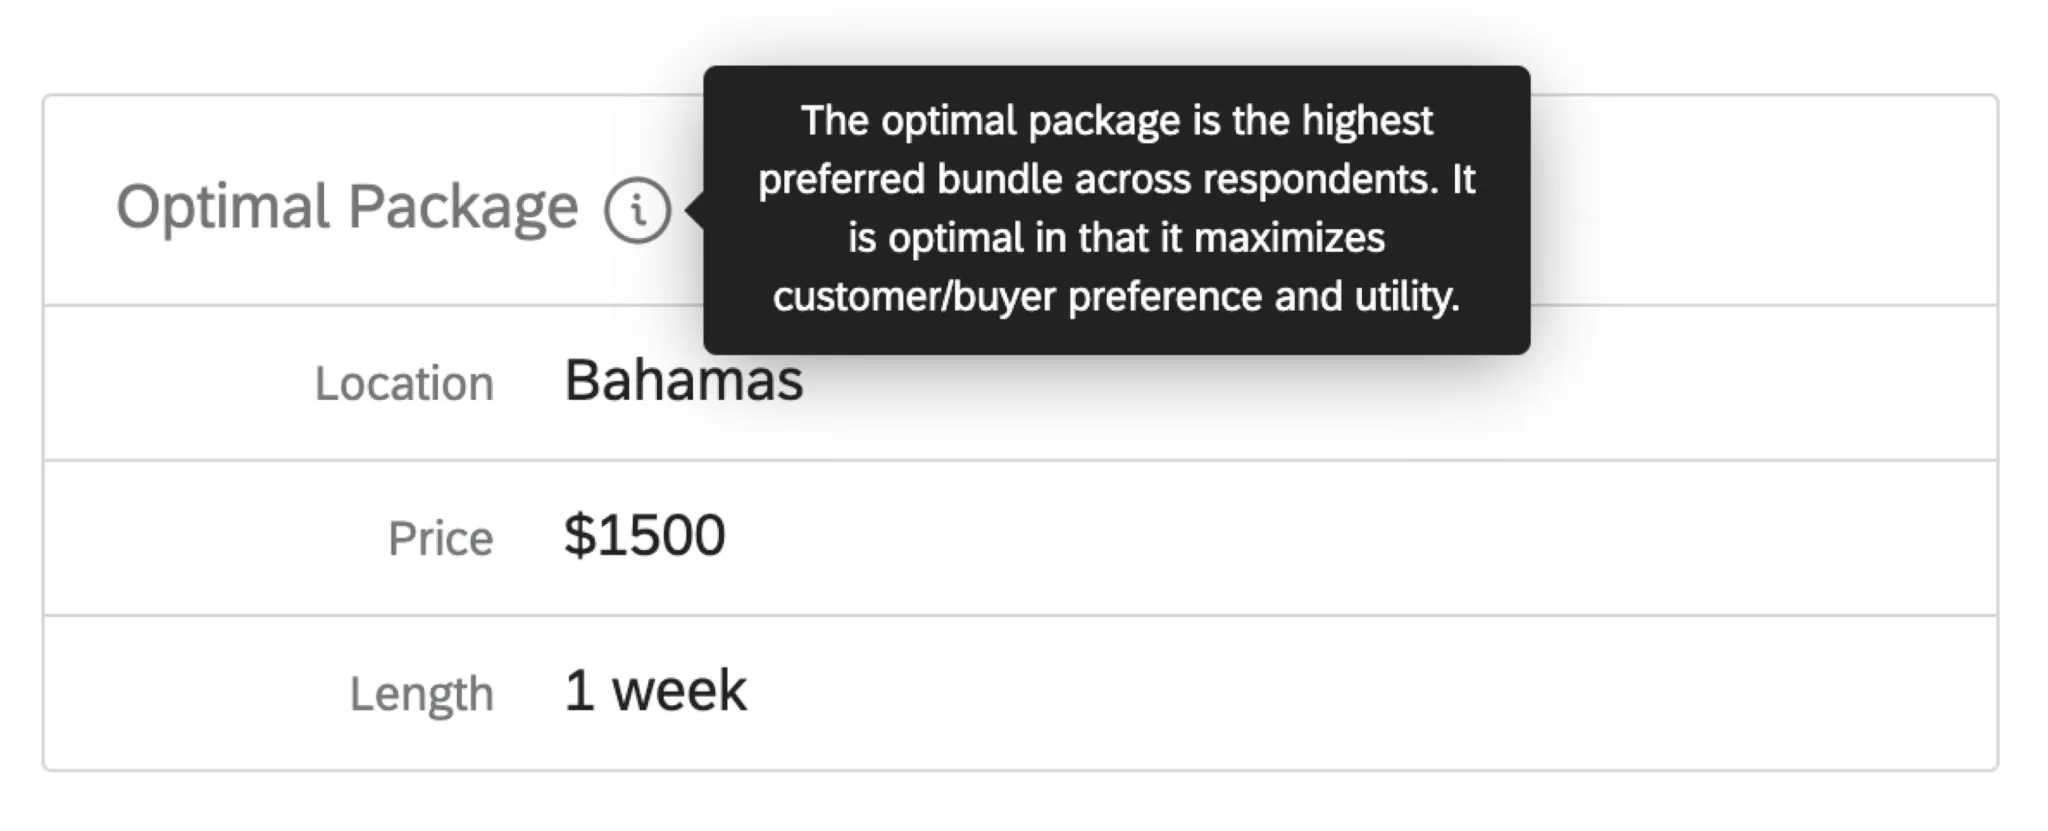
- Optimal Package: The most preferred package across respondents. It maximizes customer/buyer preference and utility.
- Relative Utility Value: The measurement of preference for each level of a feature. The greater a level’s relative utility value is, the more it enhances a package by being present. Each feature gets its own table assessing its levels’ relative utility values.
- Average Level Utility: The average calculation across respondents’ individual utility scores. This chart breaks it down to the levels of each feature, and is helpful in determining how significant a level is in contributing to a feature’s overall feature importance.
- Utility vs. Cost: The different utility scores for your project’s levels against the cost of each level. A higher utility score means a higher amount of preference for the specific conjoint level.
- ROI Measurement: The average utility score change per unit cost for each level within a feature.
Attention: Conjoint analysis can help you analyze a maximum of 10,000 responses.
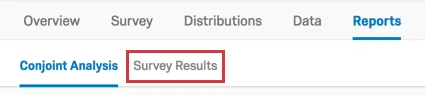
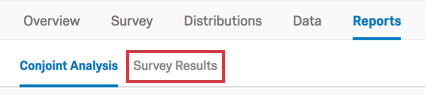
Qtip: The Survey Results tab is useful if you’ve added survey questions other than the conjoint itself, and would like to see the results for these questions. It functions the same as the Results tab in the Survey Platform.
Qtip: Use the Total Population dropdown to analyze how different groups of people have different package preferences. Use the Preference Share dropdown to switch between Preference Share, Utility Score, and Cost Analysis.
Exporting Data
You can export conjoint project data in two different places: one yields the actual conjoint analysis results in a CSV file, and the other yields additional survey data and contact information (if applicable).
Conjoint Analysis Results
In the Conjoint Analysis section, you can export raw data for each of your respondents or for aggregate data, depending on what data point you’re interested in.
Click Export to get a CSV file of one of the following:
- Individual Utilities: Get the relative utility value that each respondent scored each level of each feature.
- Preference Shares: Get the preference that respondents had for each level of a feature.
- Summary Metrics: Downloads a folder with three files. The data in each file is an average for the dataset, and is not broken out by respondent. The scores given are:
- Average Utility for each level.
- Feature Importance for each feature.
- Relative Utilities for each level.
Survey Results
Attention: You cannot export conjoint analysis data in the Data & Analysis tab. To export conjoint analysis data, see the steps in the section above.
If you included additional survey questions with your conjoint, or if you collected personal data by distributing to a contact list, you can download this information in the Data & Analysis tab. This export will contain survey question results, embedded data, and survey metadata, but it will not contain conjoint results.
FAQs
How can I stay up to date on new Qualtrics features?
How can I stay up to date on new Qualtrics features?
To access these release notes, you need an XM Community account. These accounts are free for any users with a Qualtrics account. This support page contains information for how to register an XM Community account.
Once you're logged into the XM Community, head over to the Weekly Product Updates Introduction Post. This post contains all the information you need to get started with subscribing to product updates!
That's great! Thank you for your feedback!
Thank you for your feedback!