Customer churn, also known as customer attrition, is a constant battle for most businesses. While churn is not a new problem, it has become a more unpredictable challenge in modern times with the accessibility of the internet. These days, people have endless alternatives, and switching to a new service or retailer is practically effortless.
Thanks to this more volatile environment, businesses are spending more time looking into how to keep customers engaged and loyal. Considering that most businesses rely heavily on repeat customers for success, companies across all industries want to know not only how often customers leave but also the reasons behind those decisions.
Fortunately, Qualtrics has been researching this issue, and today, we’re sharing 30 statistics to help illustrate what customer churn looks like in 2025.
What is customer churn?
Customer churn is the percentage of customers who stop doing business with a company over a given period. Organizations often track their own churn rate to gauge how well they retain customers. This churn rate is usually calculated by dividing the number of customers lost over a period of time (weekly, monthly, yearly, etc.) by the total number of customers at the start of that same period. The resulting number reflects the percentage of customers who didn’t return and is a valuable metric for businesses analyzing the health of their operations.
A high customer churn rate often points to issues such as weak retention strategies or mismatches between customer needs and the services they receive. According to data, new customers spend over 60% less than returning customers, which means losing loyal customers can be an expensive problem. Retention often strengthens revenue because repeat customers tend to buy more, share positive experiences, and cost far less to retain than it does to find new customers.
Causes of customer churn
People stop patronizing businesses for many reasons, and these vary by industry. Pricing can be one of the biggest triggers, with 71% of companies in one study citing price increases as the number one driver of customer loss. A single poor experience can also push customers away, as reports show that 72% of people switch to a competitor after just one negative interaction. Understandably, when people find a process confusing or frustrating, they are more likely to move toward a competitor. For example, product issues and poor customer service can easily drive customers away, especially in sectors where alternatives are plentiful.
Which industry has the highest customer churn?
Industries vary widely when it comes to churn rate benchmarks, but retail often sees some of the worst swings. The global retail churn rate sits near 37%, making it one of the highest among major industries. U.S. hospitality, travel, and restaurant companies also rank near the top, with churn rates averaging 45%. These industries face challenges on several fronts, including difficult working conditions for employees that can impact the guest experience, high customer expectations, fleeting interactions, and intense competition.
While media has a low churn rate of about 16% globally, digital subscription services tend to have a higher churn rate overall. Subscription models make it easier for consumers to pause or cancel with little effort, a flexibility that works well for customers but can be challenging for providers. Social media, yet another digital industry, has dramatically higher rates. Data shows that the average social media app experiences a churn rate of over 90% percent over 24 months. Among popular apps, Twitter has the highest churn rate at 77% over two years, while Facebook sees a lower 30%.
How to fix customer churn
The good news is that slowing the customer exodus is possible and highly financially beneficial. Focusing on keeping customers happy can save U.S. companies over $35 billion per year, and a slight 5% decrease in churn can boost revenue by 25–95%, depending on industry. To reduce customer churn, companies should start by identifying where people hesitate or lose interest. This can be done through surveys, user engagement tracking, or feedback review.
Once you have this data, it’s easier to identify high-churn-risk customers, which can help you either quickly address their concerns to keep them or target lower churn-risk customers going forward. Additionally, with this information, you can better identify your most valuable customers and put more effort into keeping them. You can also offer individualized solutions, such as tailored recommendations and incentives like personalized coupons.
Of course, even with this information about your customers, product quality and ease of use are still key. For this reason, it’s vital to improve the customer onboarding experience and clarify your product’s value early on. For example, music apps have the lowest 30-day drop-off rate thanks to their simple interfaces and immediate, high-quality, in-demand service upon sign-up.
Pricing stability also matters. Since many customers cite price increases as a major trigger for leaving, companies need to think carefully about how and when they adjust costs. Clear communication helps reduce frustration when pricing changes are unavoidable.
Customer churn will never disappear entirely, yet companies can influence whether their numbers are a small leak or a massive flood of customers leaving. The more companies listen to customer signals, the easier it becomes to reinforce trust, foster more helpful interactions, and keep people coming back. At Qualtrics, we help you collect and analyze the data that can identify early signals before a customer decides to leave.
Reach out today to see how we can help you reduce your customer churn rate and strengthen your customer experience.
Reach out today to see how we can help you reduce your customer churn rate and strengthen your customer experience.
30 Customer Churn Facts
| Category | Statistic | Source Code |
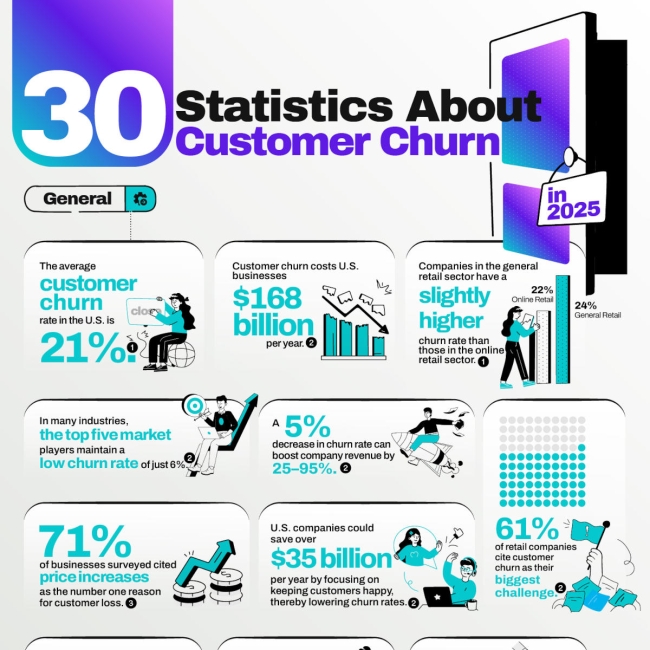
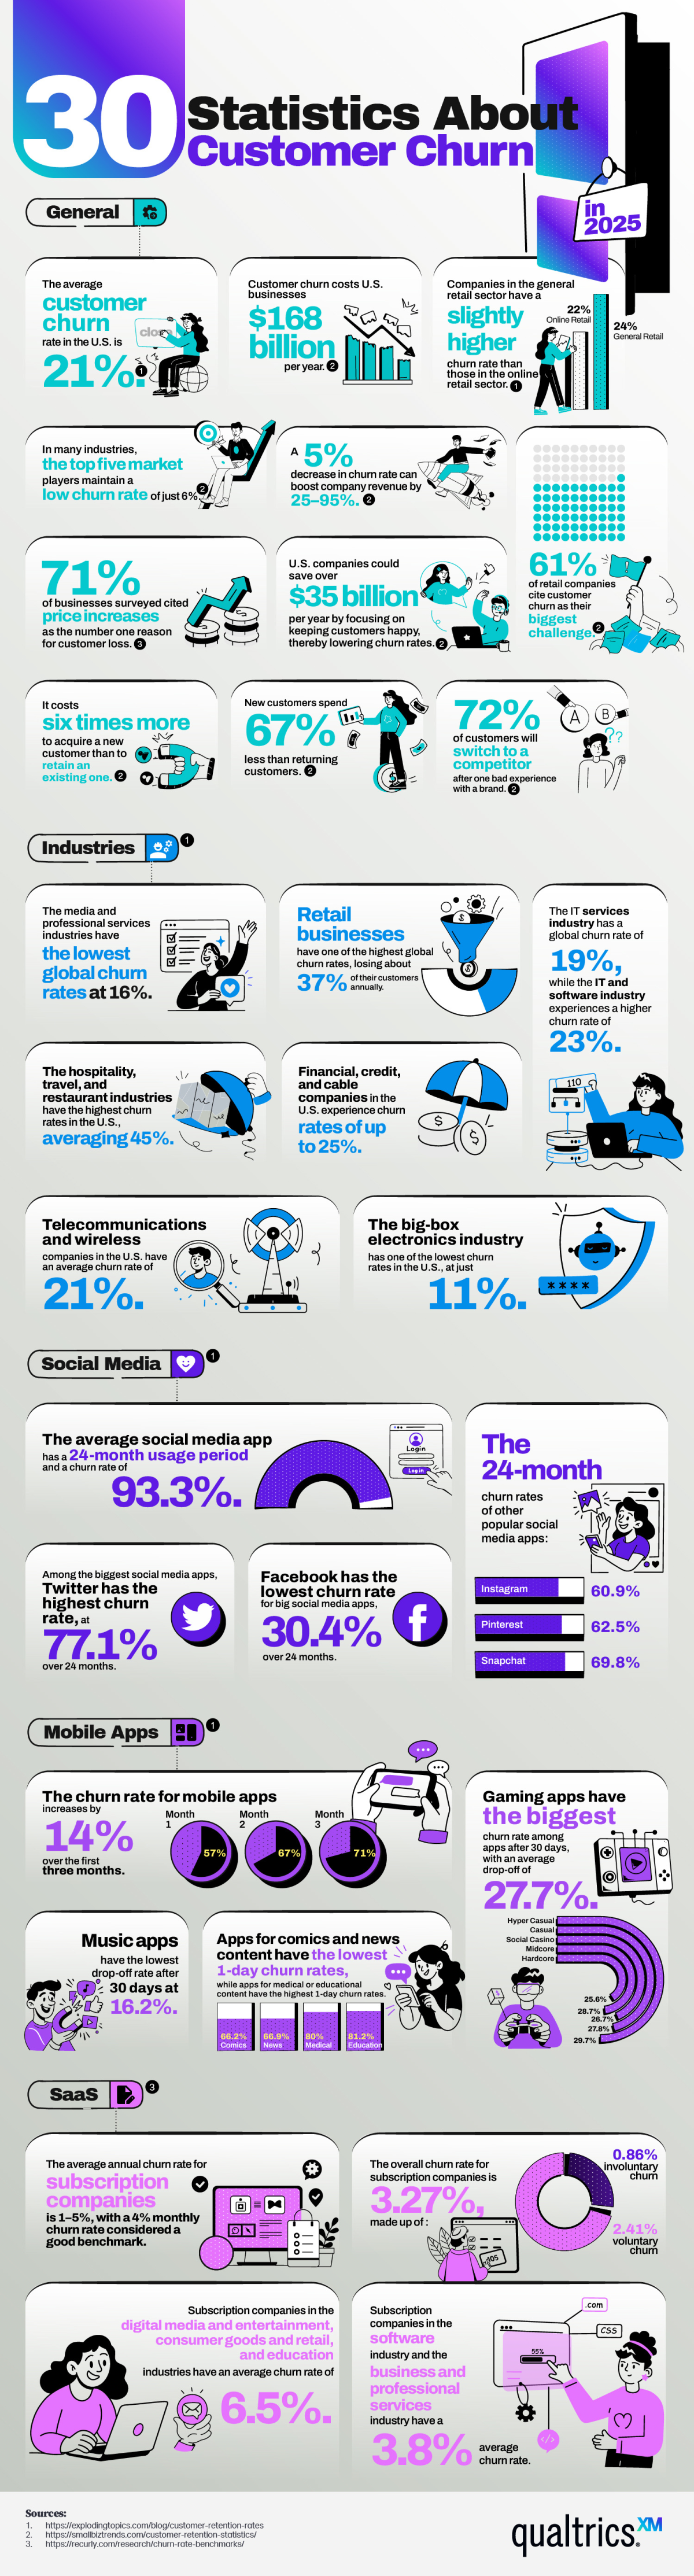
| General | The average customer churn rate in the U.S. is 21%. | 1 |
| General | Customer churn costs U.S. businesses $168 billion per year. | 2 |
| General |
Companies in the general retail sector have a slightly higher churn rate than those in the online retail sector. General Retail: 24% Online Retail: 22% |
1 |
| General | In many industries, the top five market players maintain a low churn rate of just 6%. | 2 |
| General | A 5% decrease in churn rate can boost company revenue by 25–95%. | 2 |
| General | 61% of retail companies cite customer churn as their biggest challenge. | 2 |
| General | 71% of businesses surveyed cited price increases as the number one reason for customer loss. | 3 |
| General | U.S. companies could save over $35 billion per year by focusing on keeping customers happy, thereby lowering churn rates. | 2 |
| General | It costs six times more to acquire a new customer than to retain an existing one. | 2 |
| General | New customers spend 67% less than returning customers. | 2 |
| General | 72% of customers will switch to a competitor after one bad experience with a brand. | 2 |
| Industries | The media and professional services industries have the lowest global churn rates at 16%. | 1 |
| Industries | Retail businesses have one of the highest global churn rates, losing about 37% of their customers annually. | 1 |
| Industries | The IT services industry has a global churn rate of 19%, while the IT and software industry experiences a higher churn rate of 23%. | 1 |
| Industries | The hospitality, travel, and restaurant industries have the highest churn rates in the U.S., averaging 45%. | 1 |
| Industries | Financial, credit, and cable companies in the U.S. experience churn rates of up to 25%. | 1 |
| Industries | Telecommunications and wireless companies in the U.S. have an average churn rate of 21%. | 1 |
| Industries | The big-box electronics industry has one of the lowest churn rates in the U.S., at just 11%. | 1 |
| Social Media | The average social media app has a 24-month usage period and a churn rate of 93.3%. | 1 |
| Social Media | Among the biggest social media apps, Twitter has the highest churn rate, at 77.1% over 24 months. | 1 |
| Social Media | Facebook has the lowest churn rate for big social media apps, 30.4% over 24 months. | 1 |
| Social Media |
The 24-month churn rates of other popular social media apps: Instagram: 60.9% Pinterest: 62.5% Snapchat: 69.8% |
1 |
| Mobile Apps |
The churn rate for mobile apps increases by 14% over the first three months. Month one: 57% Month two: 67% Month three: 71% |
1 |
| Mobile Apps |
Apps for comics and news content have the lowest 1-day churn rates, while apps for medical or educational content have the highest 1-day churn rates. Comics: 66.2% News: 66.9% Medical: 80% Education: 81.2% |
1 |
| Mobile Apps | Music apps have the lowest drop-off rate after 30 days at 16.2%. | 1 |
| Mobile Apps |
Gaming apps have the biggest churn rate among apps after 30 days, with an average drop-off of 27.7%. Gaming – Hyper Casual: 29.7% Gaming – Casual: 27.8% Gaming – Social Casino: 26.7% Gaming – Midcore: 28.7% Gaming – Hardcore: 25.6% |
1 |
| SaaS | The average annual churn rate for subscription companies is 1–5%, with a 4% monthly churn rate considered a good benchmark. | 3 |
| SaaS | The overall churn rate for subscription companies is 3.27%, made up of 2.41% voluntary churn and 0.86% involuntary churn. | 3 |
| SaaS | Subscription companies in the digital media and entertainment, consumer goods and retail, and education industries have an average churn rate of 6.5%. | 3 |
| SaaS | Subscription companies in the software industry and the business and professional services industry have a 3.8% average churn rate. | 3 |
Sources:
- https://explodingtopics.com/blog/customer-retention-rates
- https://smallbiztrends.com/customer-retention-statistics/
- https://recurly.com/research/churn-rate-benchmarks/