
Heat Map Widget (EX)
What's on this page
Qtip: Unsure which Employee Experience projects have this widget? See our Widget Types and Project Compatibility table.
About Heat Map Widgets
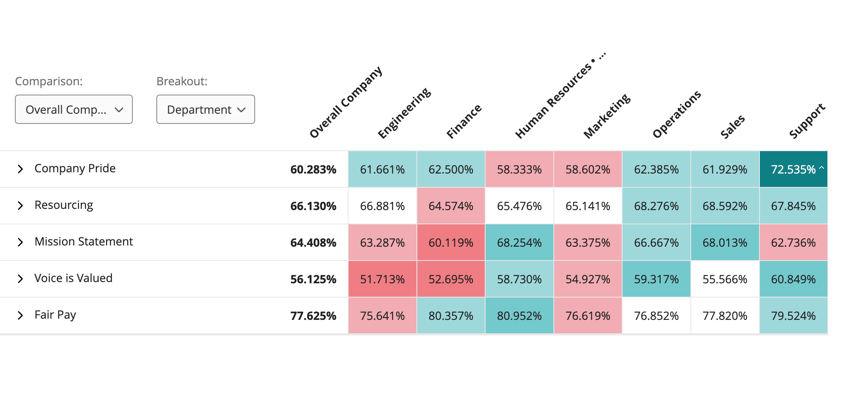
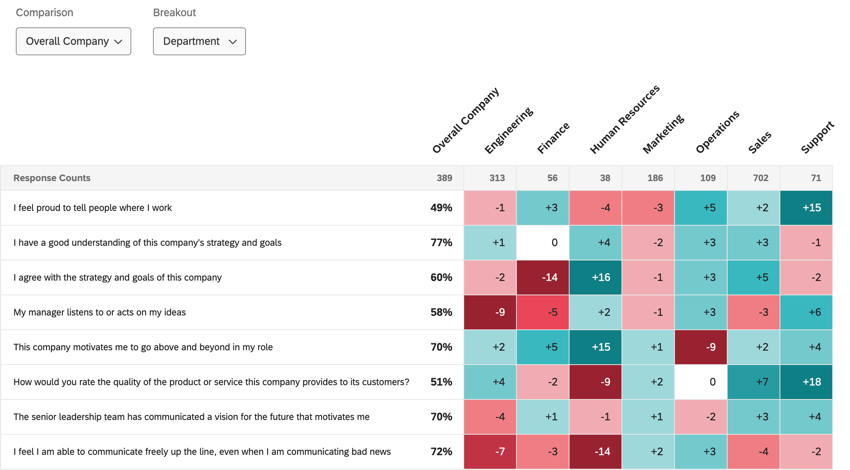
Heat map widgets provide an efficient way to quickly identify high points and low points across your organization or various demographic groups. These widgets are ideal for visualizing comparisons, showing how the many levels of a field compare on items across the organization. Heat map widgets are mobile accessible, and will resize and reformat as needed in a mobile browser.
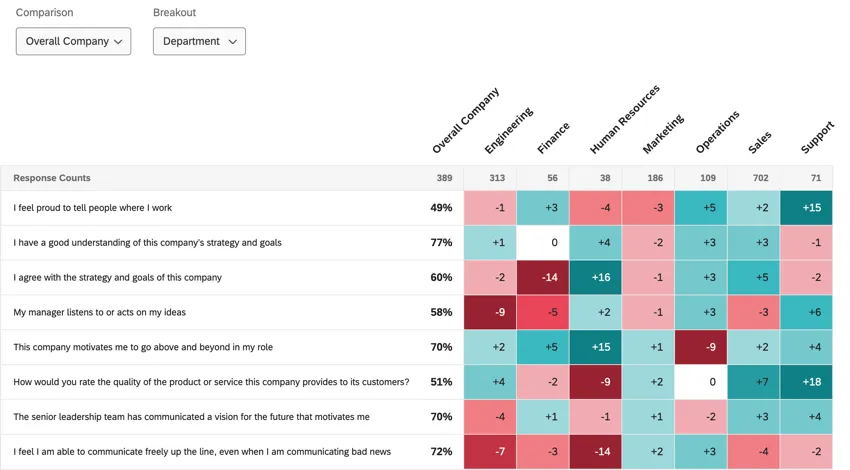
Example: You would like to see how each department in your company scored on the engagement questions, compared to the overall company scores. Heat Map widgets can display this information color coded, display the delta (difference between each department and the overall), and sort the columns from highest scoring to lowest scoring teams.
Basic Set Up
This section covers how to set up a heat map widget.
Attention: Create your comparisons in the order you’d like them to appear in the widget since the order is inherited from the Comparisons page.
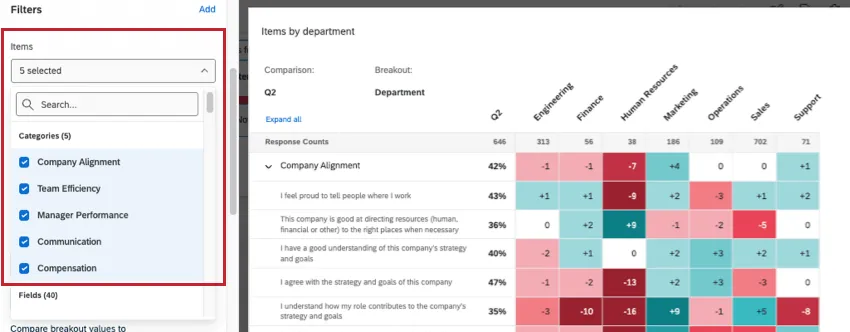
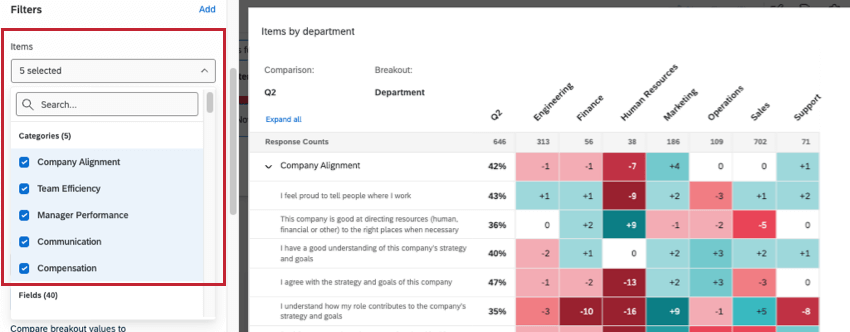
Qtip: If you select questions and categories, the questions will be nested under the categories to save space. Click a category dropdown to see the items underneath it. The order in which the categories appear in the heat map is set up in the Manage Categories section of the dashboard settings.
Qtip: It’s best to choose demographics, teams, and other tangible groups, such as Departments, Regions, and Tenure. Fields like Employee ID have too many values, and are too specific to the employee for the data to help you create company-wide action items.
Qtip: The “One Level Below” breakout will not work with any hierarchy unit that has more than 100 sub units. Additionally, your dashboard needs an org hierarchy filter to use this breakout.
Attention: If you have a breakout for a field marked as identifiable, and if a value for that breakout has a number of responses that falls below the confidentiality threshold for all items, then the breakout column will be removed from the widget and the data will not be displayed.
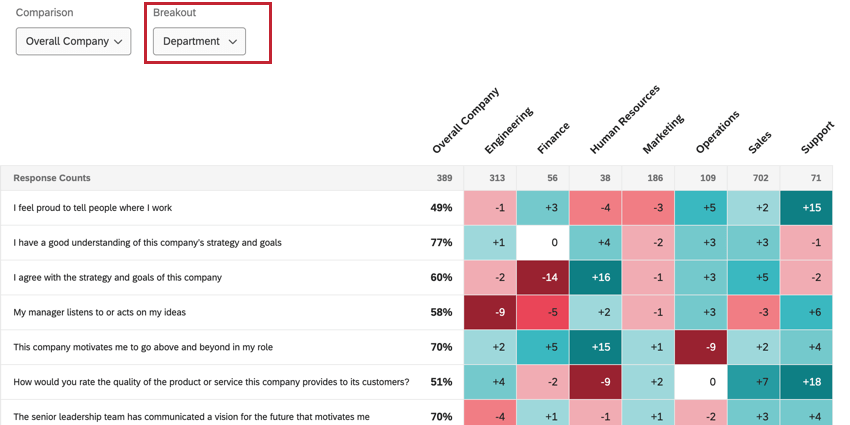
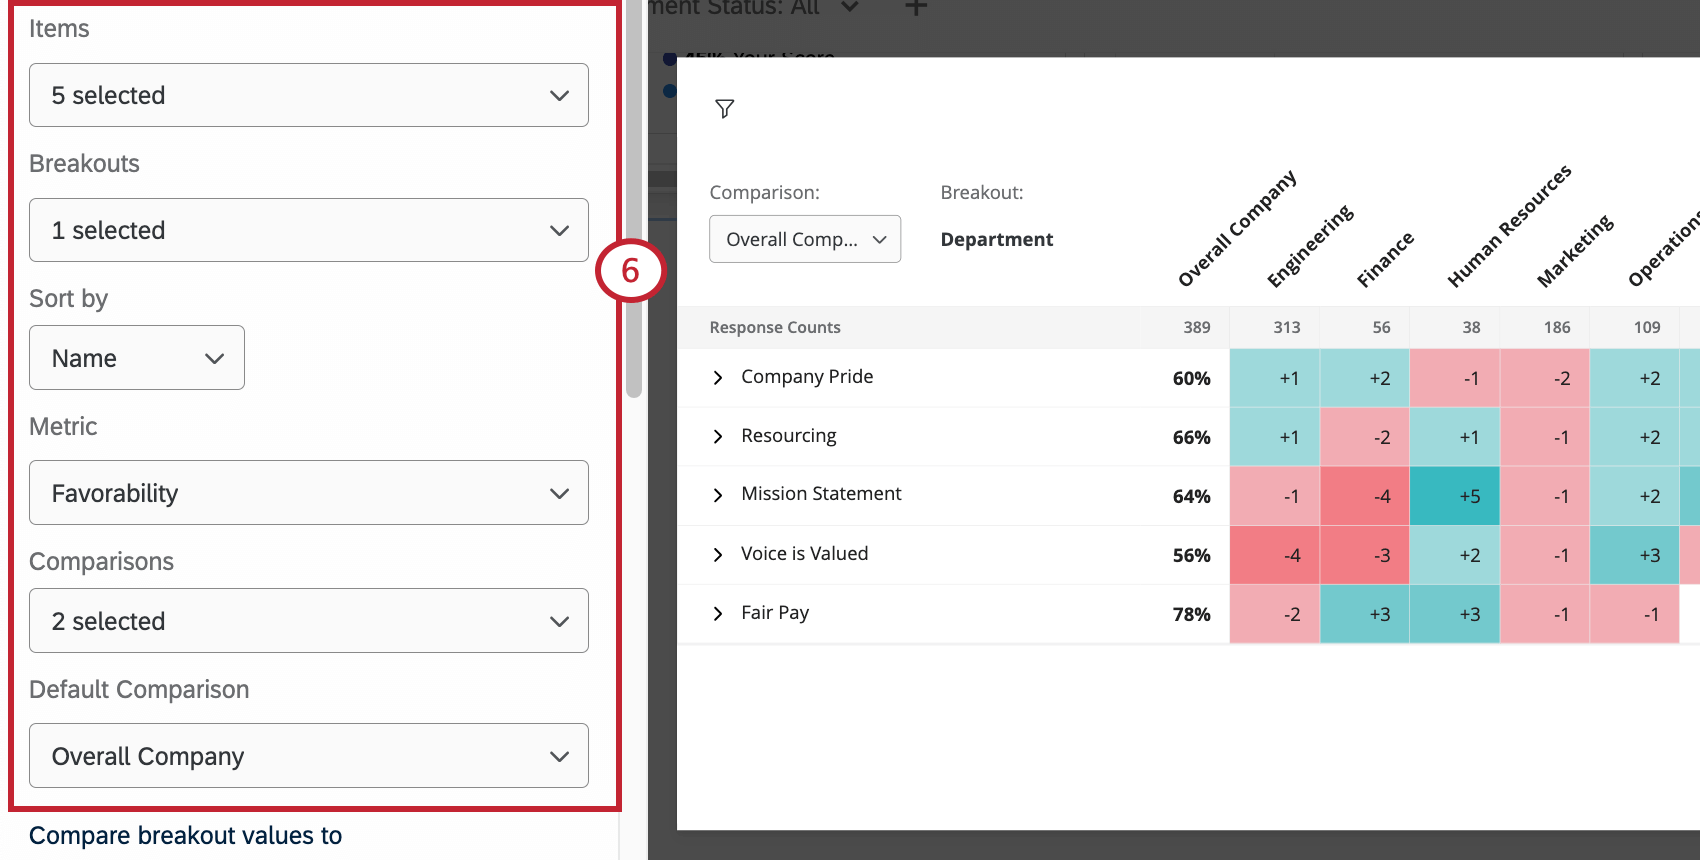
Qtip: If you select multiple breakouts, a second menu appears for you to choose the breakout that is displayed by default. A dashboard viewer can change the displayed breakout using the Breakout menu on the widget.
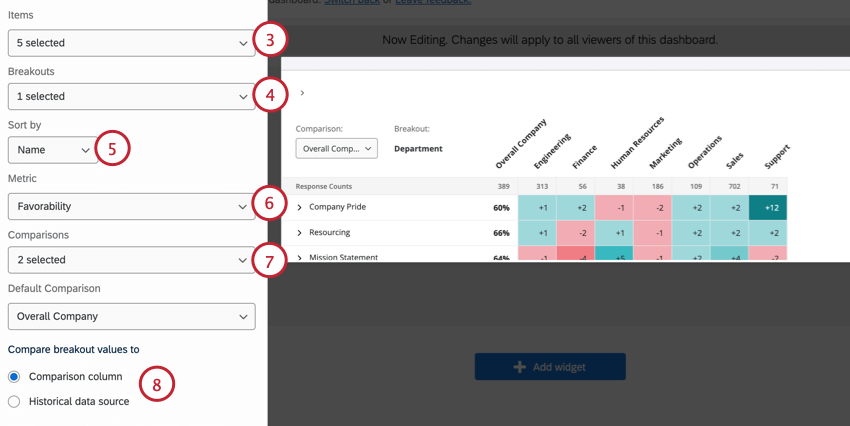
- Name: Fields are sorted alphabetically.
- Response Counts: Fields are sorted by the number of responses.
- Favorability: Base your data on favorability. This is calculated as an engagement score, the percentage of participants who rated favorably on the set scale. For more on setting favorability scales, see scales.
- Average: Base your data on the average value. In a heat map, that means you see the average of everyone’s score in a group. Qtip: Depending on the number of scale points, it may be difficult to get a large range for average. Consider adjusting your value ranges to include decimals.

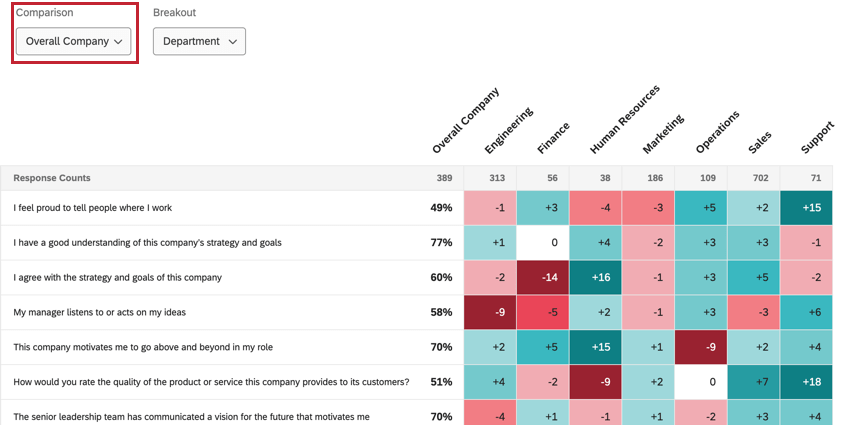
Qtip: If you select multiple comparisons, a second menu will appear for you to choose the comparison that is displayed by default. A dashboard viewer can change the displayed comparison using the Comparison menu on the widget.
- Comparison column: Values will be calculated by comparing the breakout’s score to the chosen comparison.
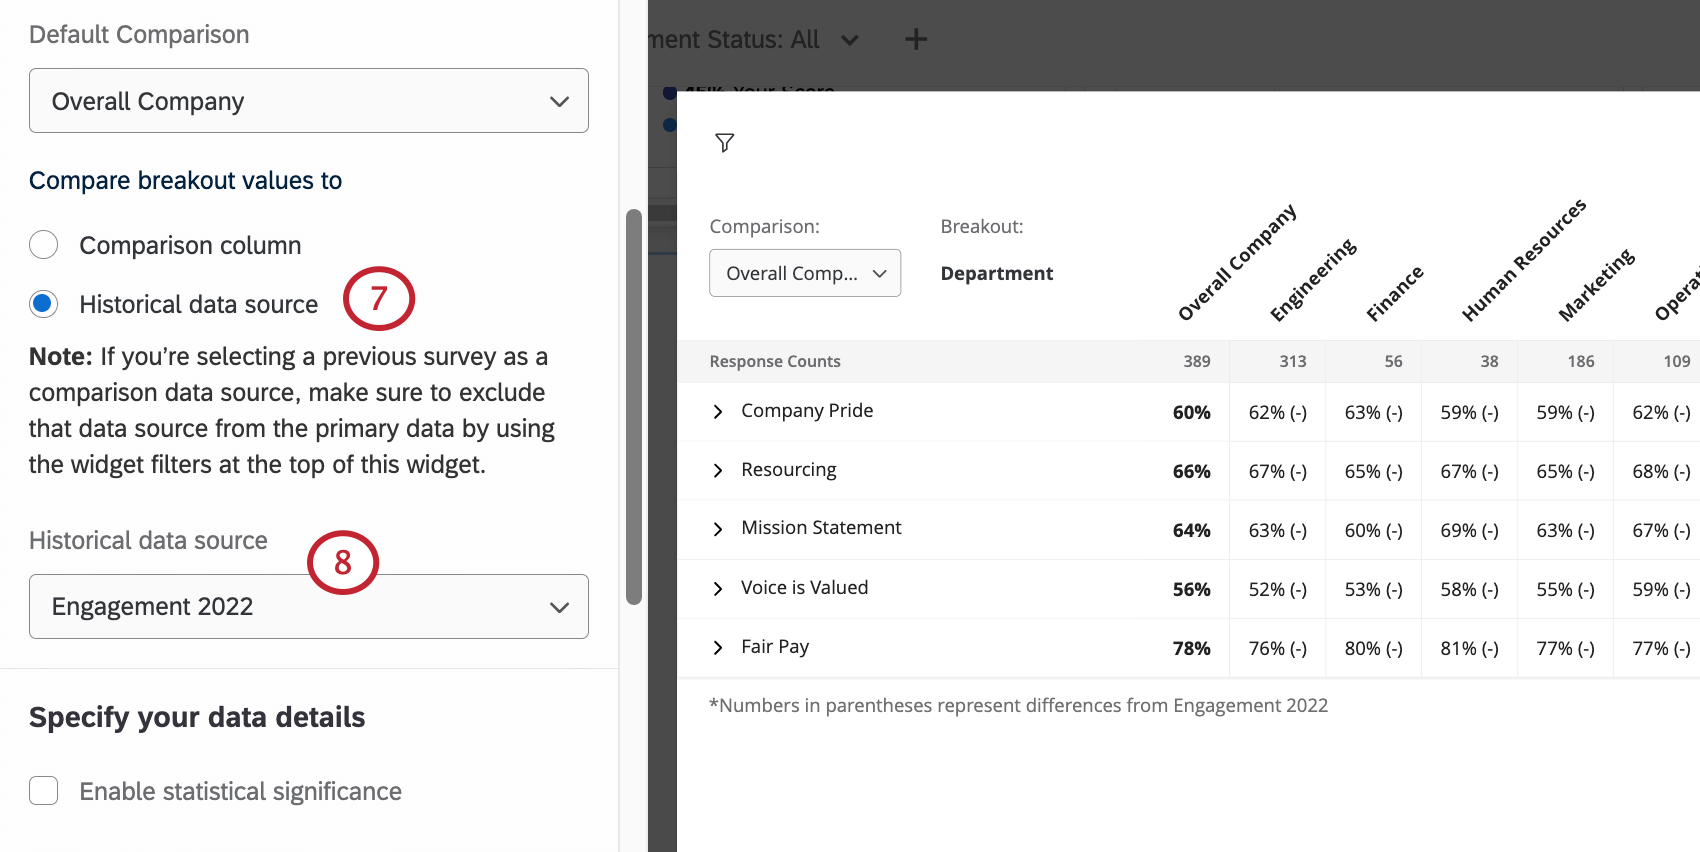
- Historical data source: Values will be calculated by comparing the breakout’s score to a historical data source that is mapped to your dashboard. If you select this option, a second menu will appear for you to choose the historical data source. For more on how to correctly set this version up, see Historical Data Comparisons.
Qtip: Don’t worry if your breakout has too many values for the columns to fit on 1 page. The widget will enable sideways scrolling as soon as there are too many columns.
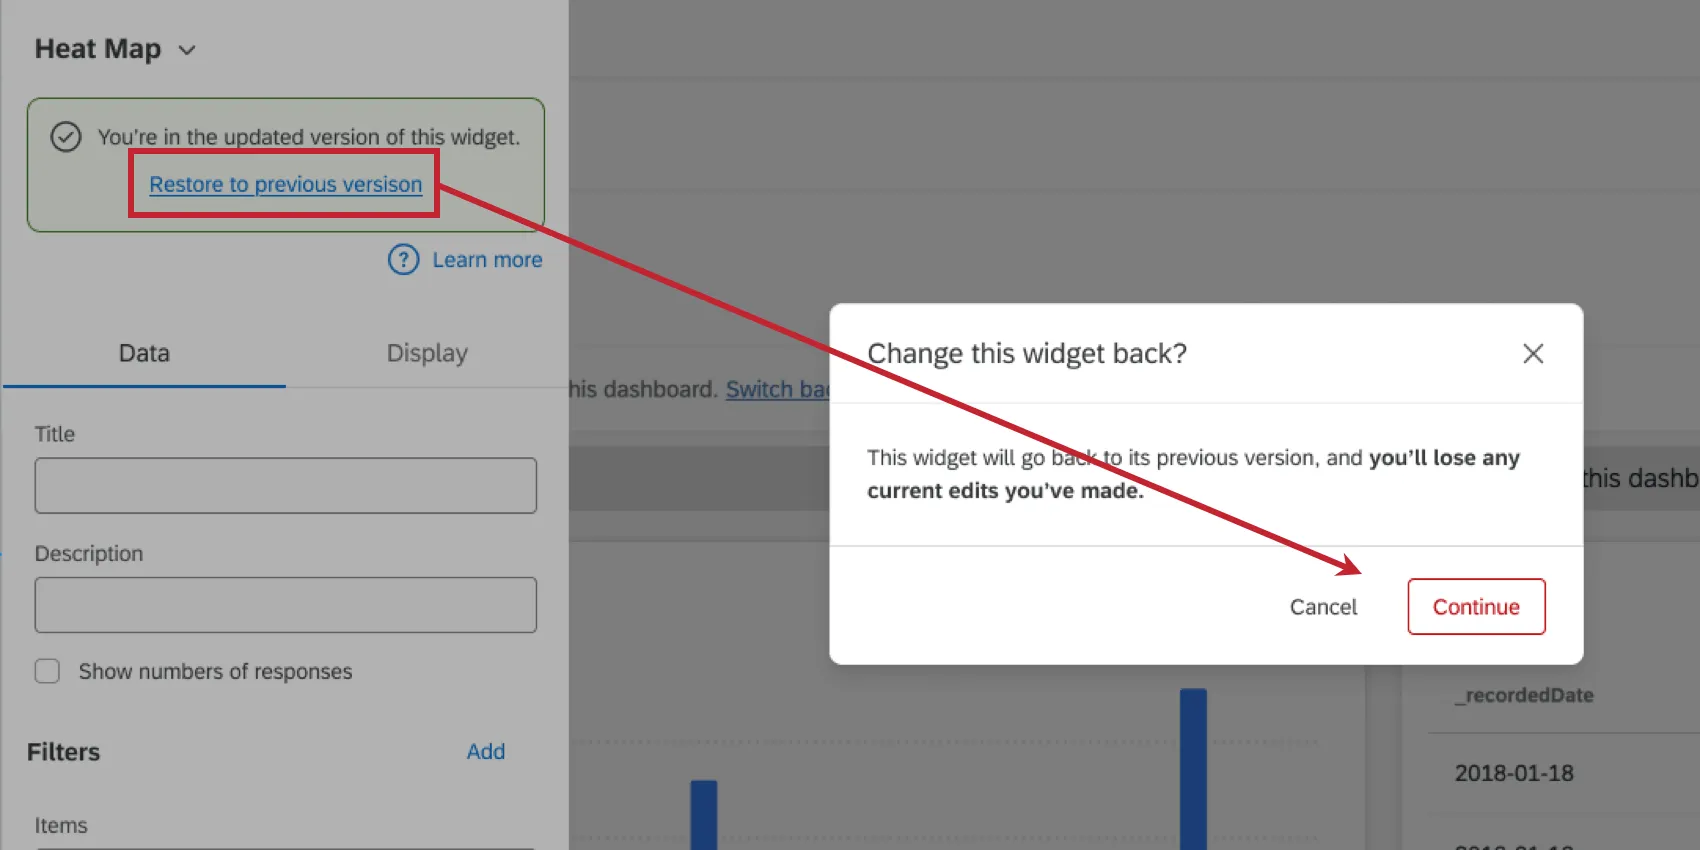
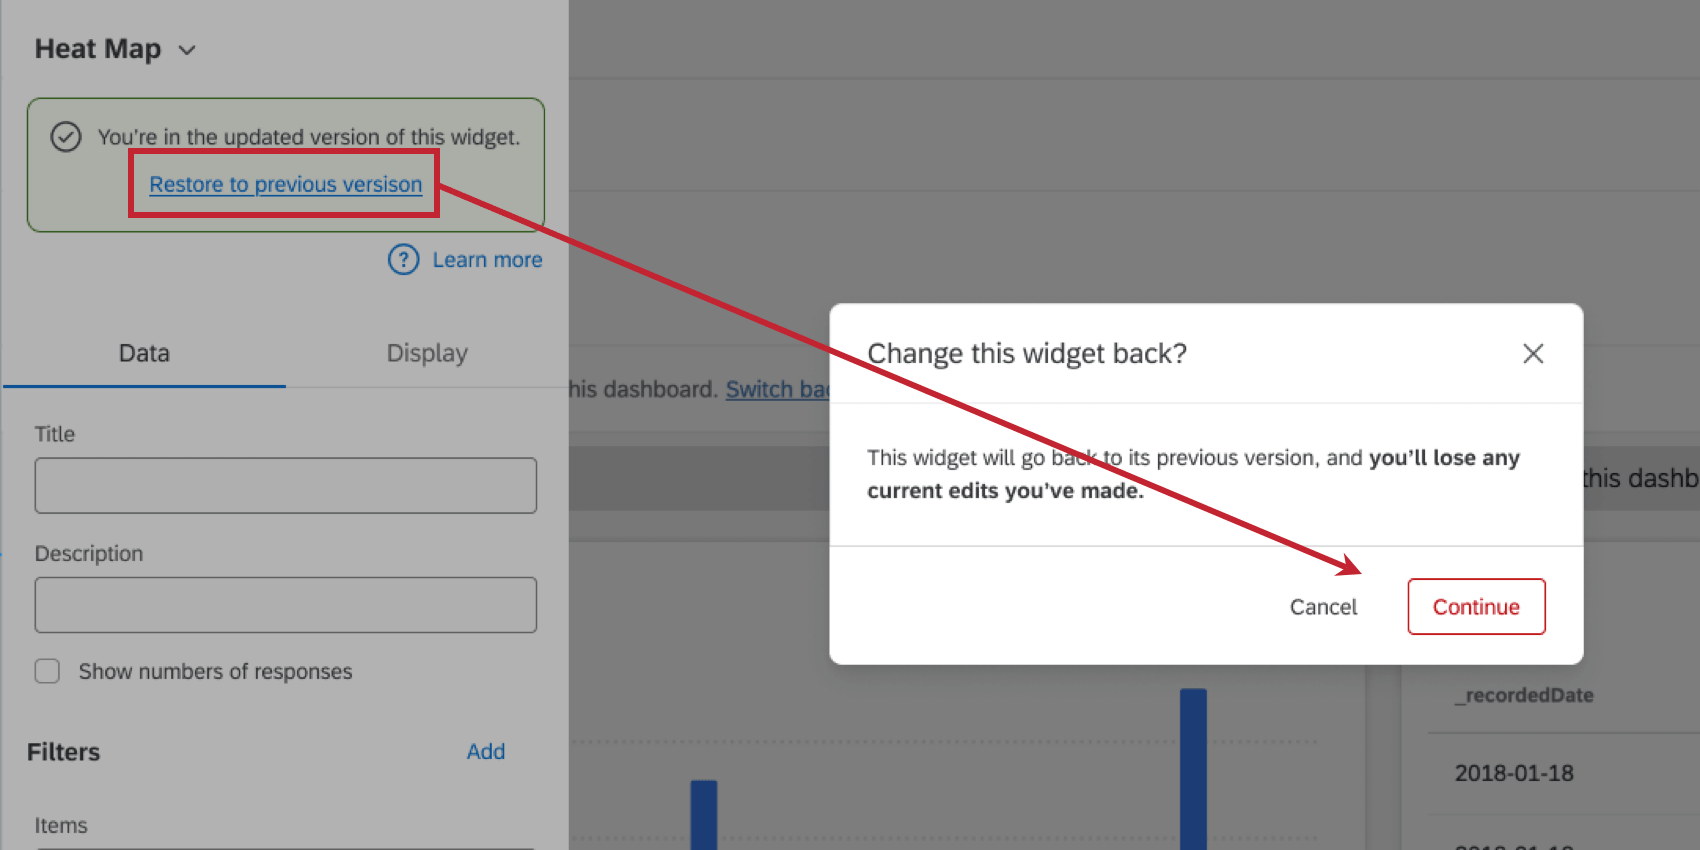
Qtip: If your widget setup looks slightly different than what’s on this page, then it’s likely you are using an old version of the widget. This older version will be automatically migrated to the new version at a later date. You can migrate your widget early by editing it and clicking Update now.If desired, you can revert to the old version by clicking Restore to the previous version. Please note that any new edits you may have made will be lost when reverting the widget.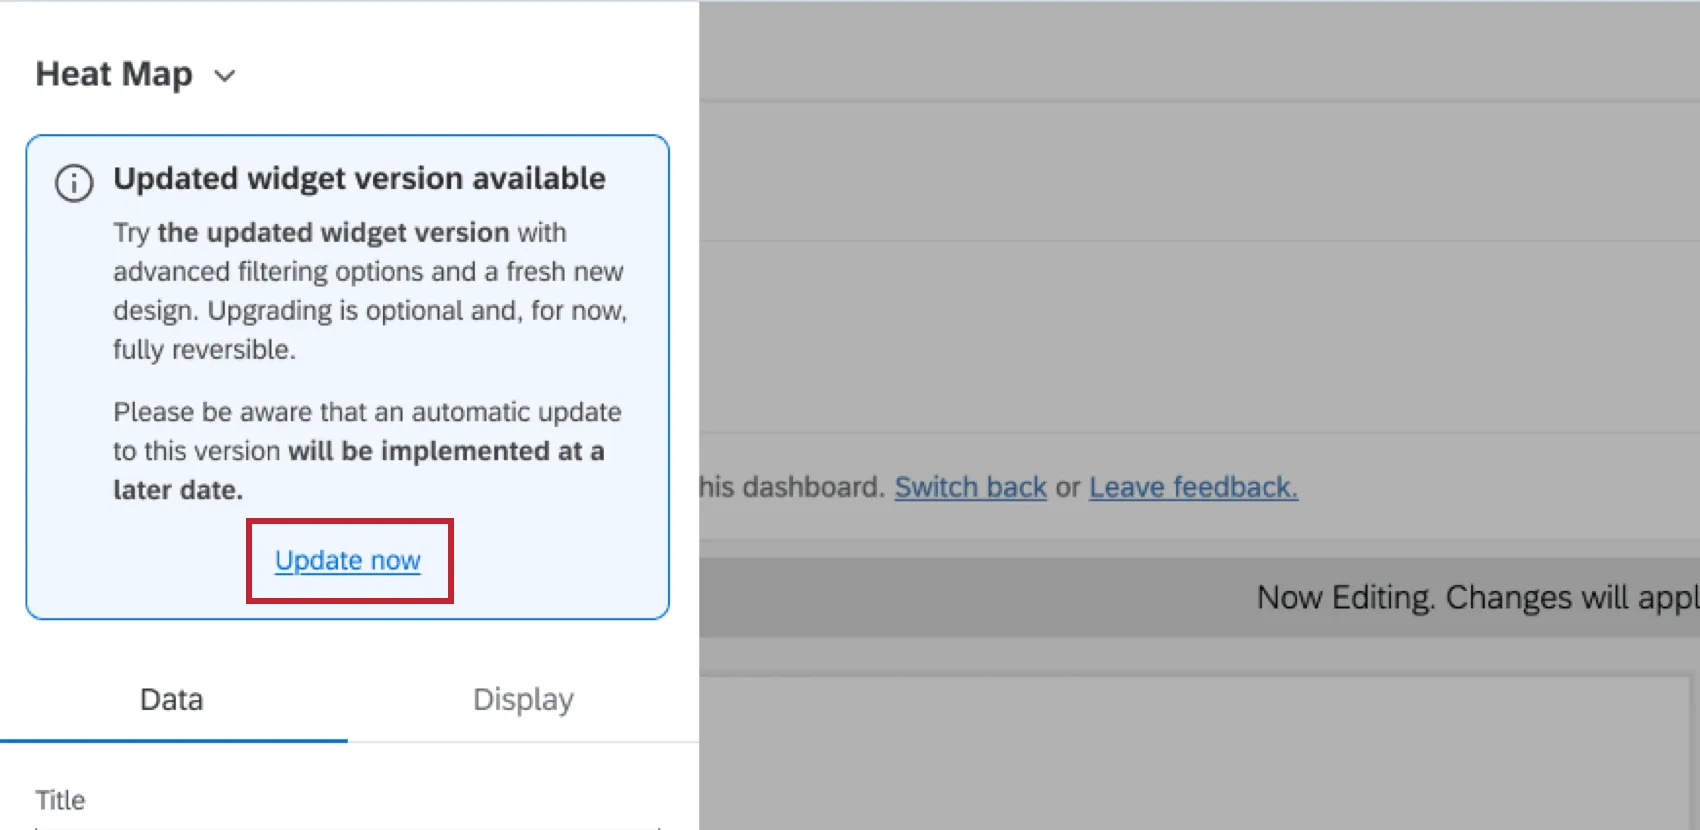

Data Display Options
This section covers the options available to you for displaying your data in the heat map widget.
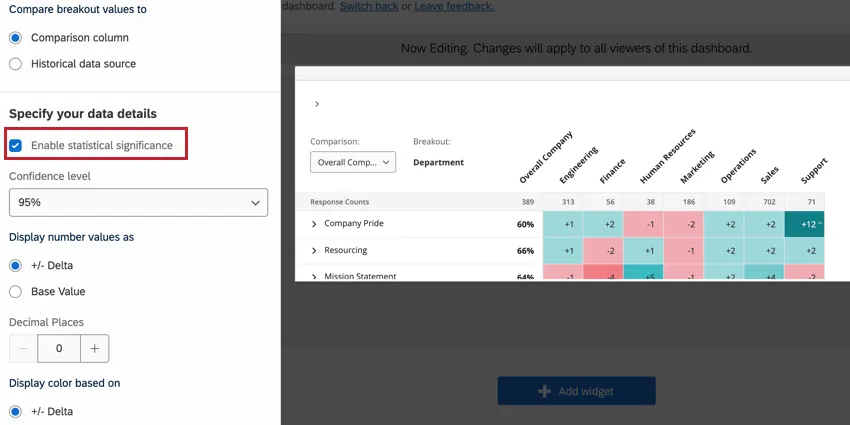
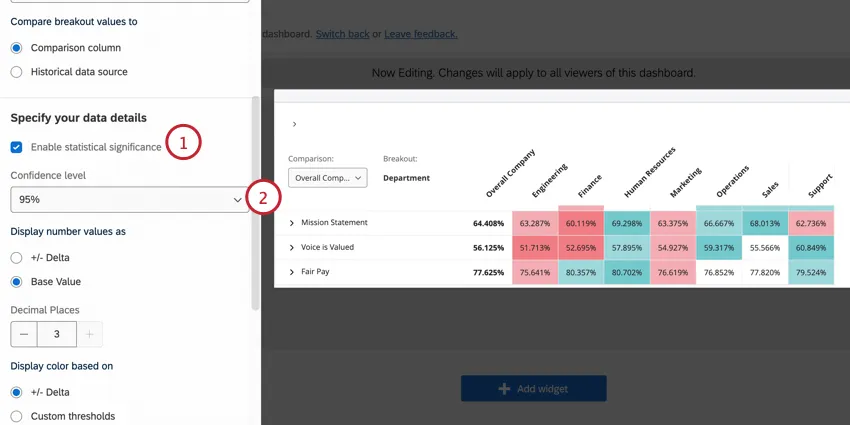
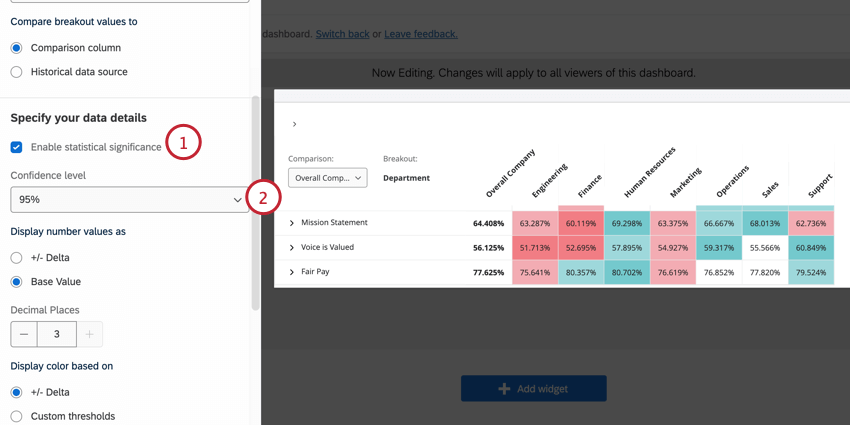
Enable Statistical Significance
The Enable statistical significance option allows you to flag if the differences displayed in your heat map widget are statistically significant. See Significance Testing for more information on this option.
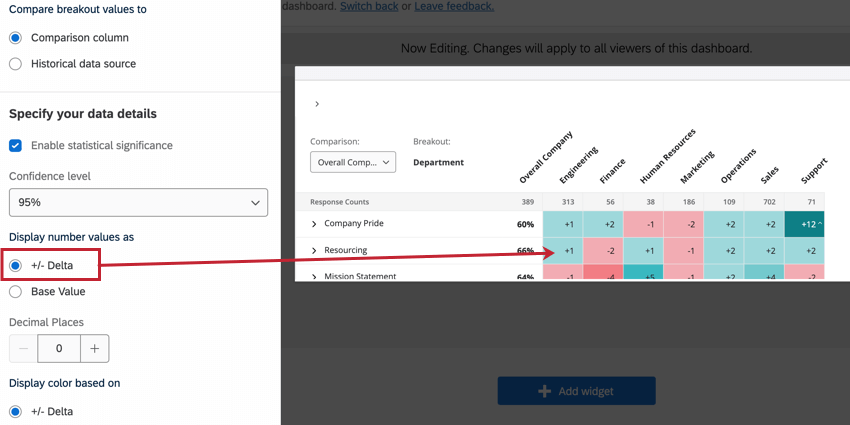
Display number values as
You have 2 options for displaying the number values in your heat map widget:
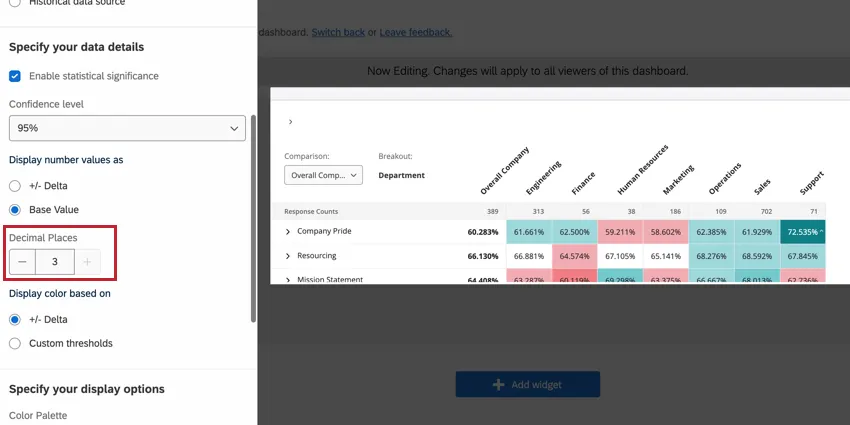
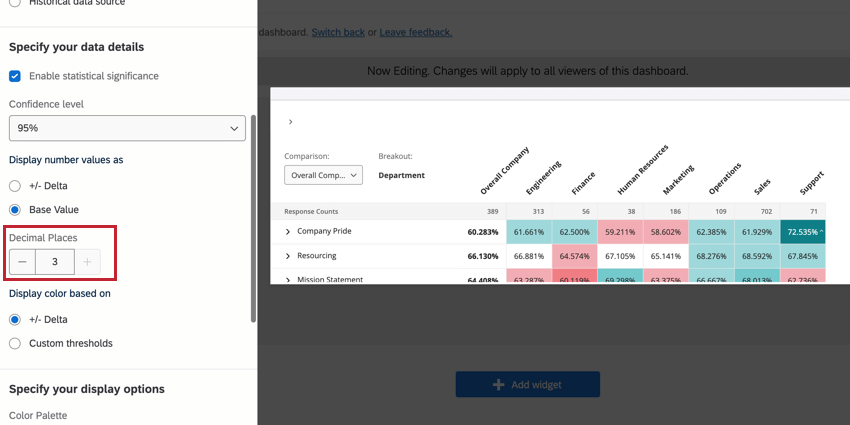
Decimal Places
If desired, you can add decimal places to your heat map values. Use the Decimal Places field to adjust the number of decimal places. You can add up to 3 decimal places in your widget.
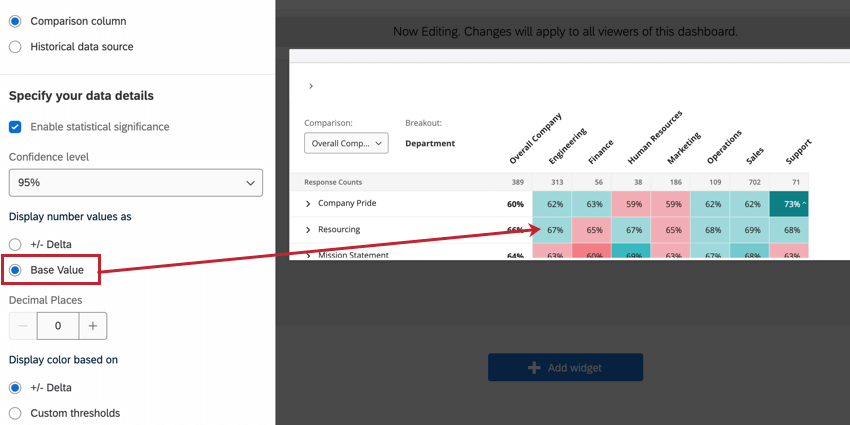
Display color based on
You have 2 options for how the colors in your widget are set:
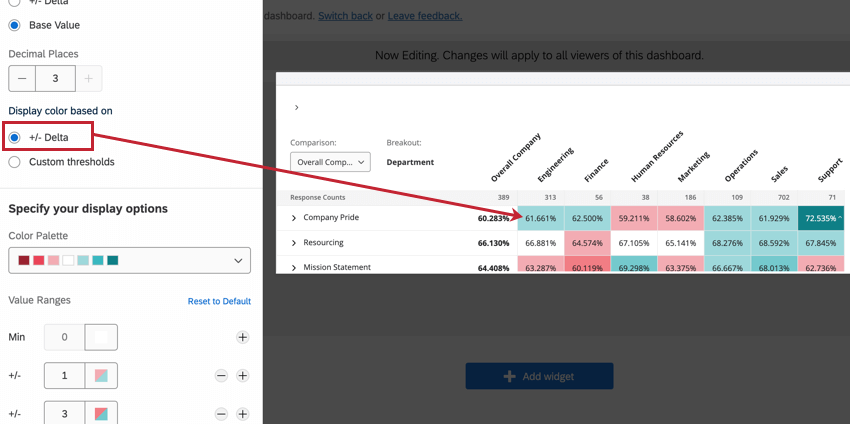
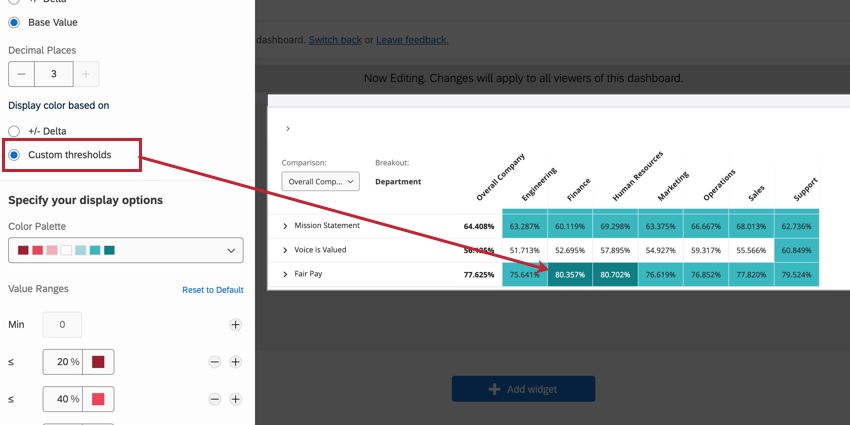
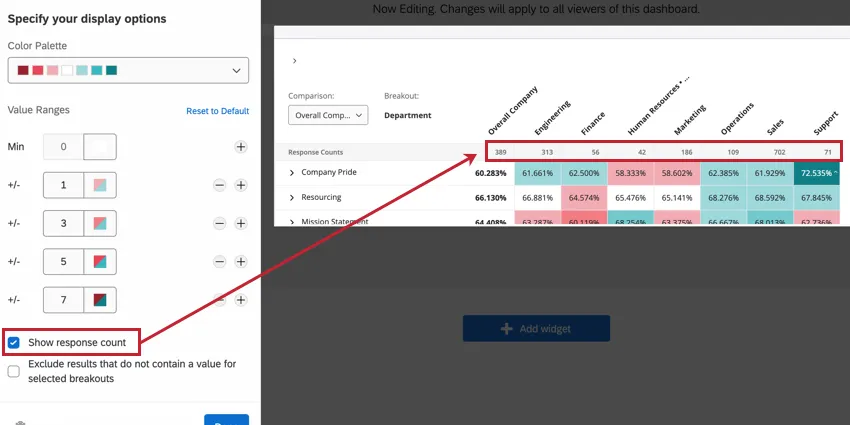
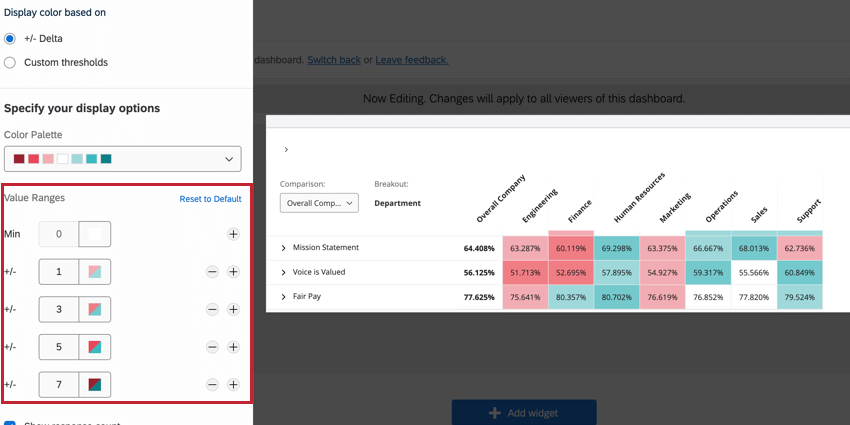
Example: The widget in the above screenshots is the same widget displaying the same data, but with the different display options enabled. Note the difference in how these value ranges are colored.
Qtip: How you display numbers doesn’t have to match how you display color. For example, you can set delta as your numbers display option and custom thresholds as your color display options.
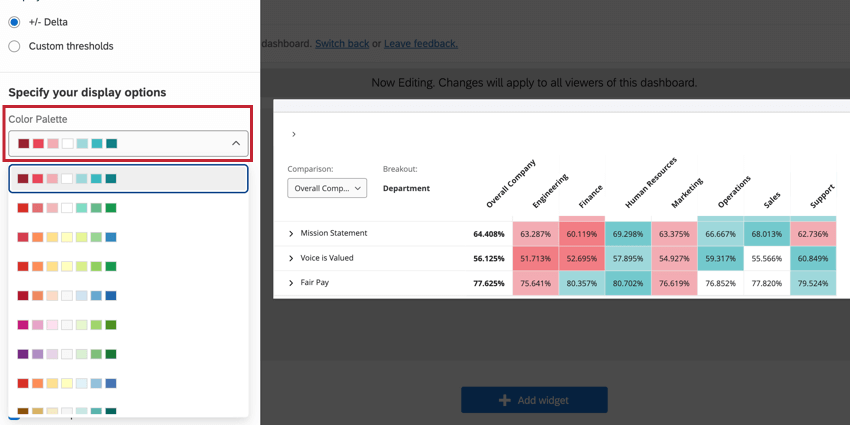
Color Palette
The color palette setting determines the colors that display in the boxes in your heat map widget. The color palettes available are designed by subject matter experts to highlight contrast between high and low values.

The colors in the value range will be assigned automatically based on the range of values you add. You cannot adjust custom colors for the palette; for example, if you’re using a red and blue palette, you cannot add yellow or purple value ranges.
To adjust the colors for a value range (either delta or custom thresholds), adjust the range values. To add additional range values to your widget, click the plus sign (+). Similarly, remove range values using the minus sign ( – ). Click Reset to Default to revert any changes you’ve made here.

Significance Testing
When displaying comparisons or benchmarks on your widgets, you’ll see a lot of changes from one group to another. But are these changes to be expected, or are they representative of something deeper? How can you decide what changes demand your attention? Thankfully, you can flag whether a difference is statistically significant.
To enable significance testing:
Types of Significance Tests
The type of significance testing that is being performed varies based on whether you have added a benchmark or a comparison. Significance testing can only be performed if the metric is favorability.
| Favorability | |
|---|---|
| Comparisons | A 2-proportion z-test in 2 tails. Here, we are comparing the proportions of favorability for 2 populations.
|
| Benchmark | One sample test of binomial proportions. Here, we are comparing expected proportion (a benchmark) to the experimental proportion of the binomial question: is this favorable or unfavorable. |
The sample size for categories is the average number of responses across the items in the category.
Qtip: Only benchmarks that are comparisons with Top Box / Bottom Box can be added to this widget.
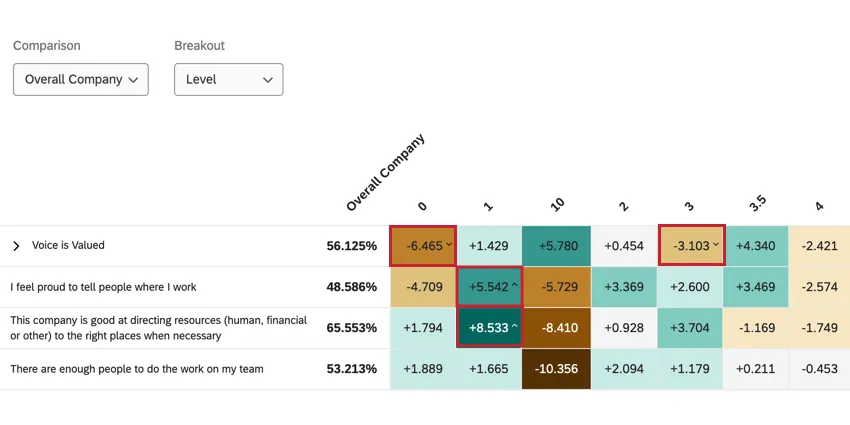
Understanding Significance in a Widget
The confidence level indicates how confident you would like to be that the results generated through the analysis match the general population. Higher confidence levels raise the threshold for a difference to be considered statistically significant, meaning only the clearest differences will be marked as such.
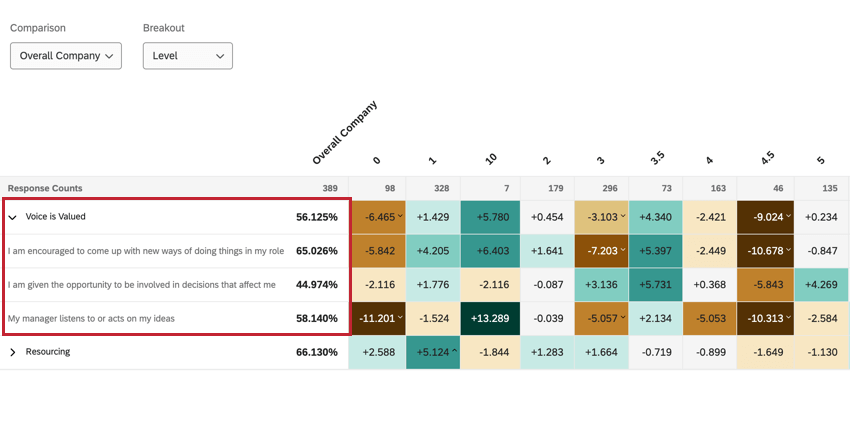
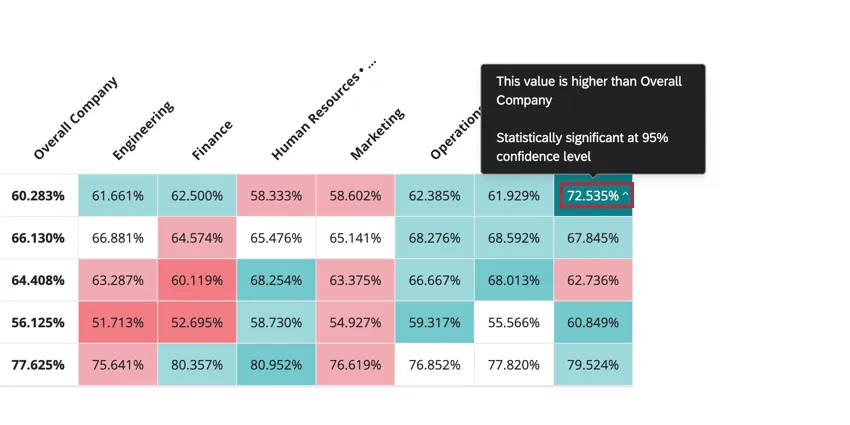
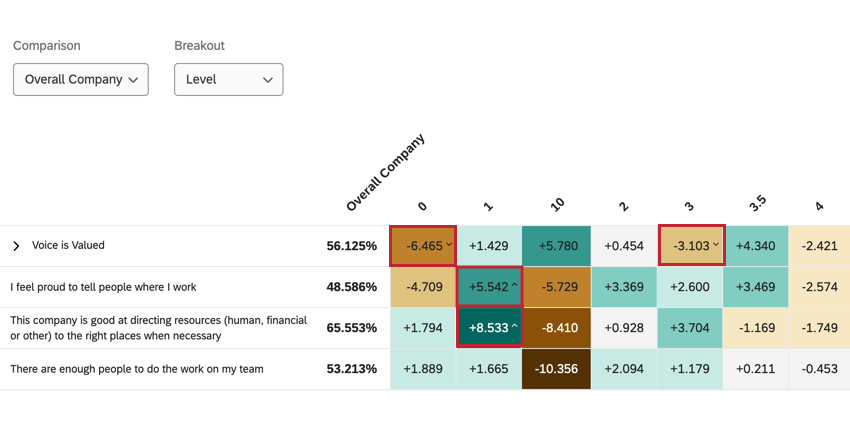
Once you have enabled significance testing, changes that are significant will have arrows to indicate the direction of the change. Insignificant changes will not have arrows.
Historical Data Comparisons
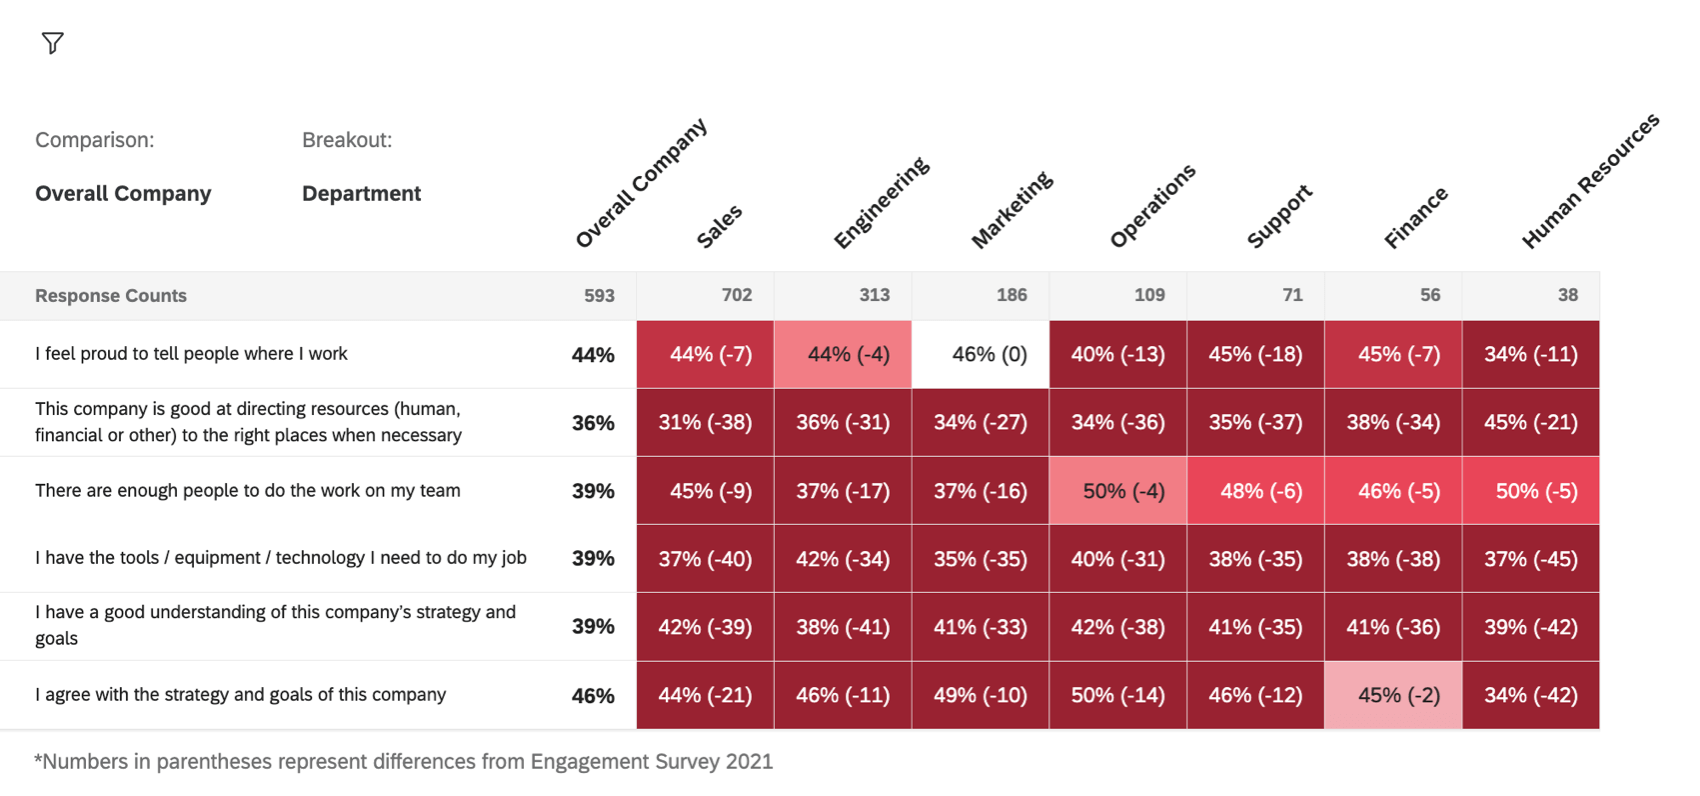
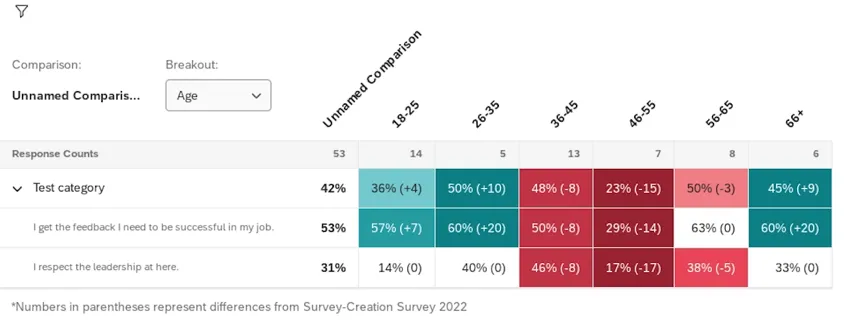
If you have multiple data sources mapped to your dashboard, you can compare them to each other in your heat map widget. Values will be calculated by comparing the breakout’s score to a historical data source that is mapped to your dashboard.
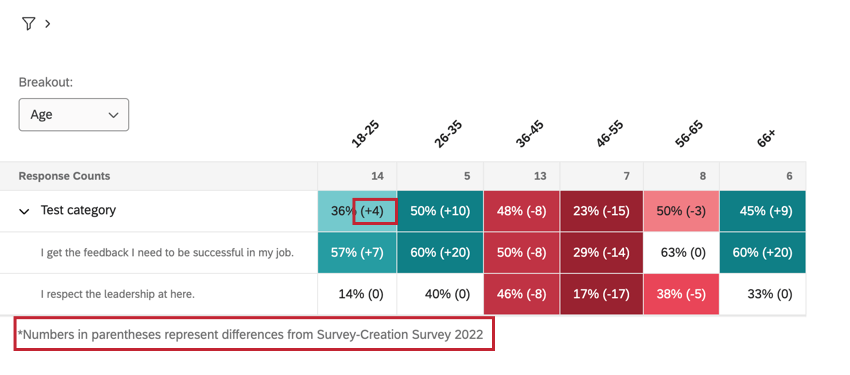
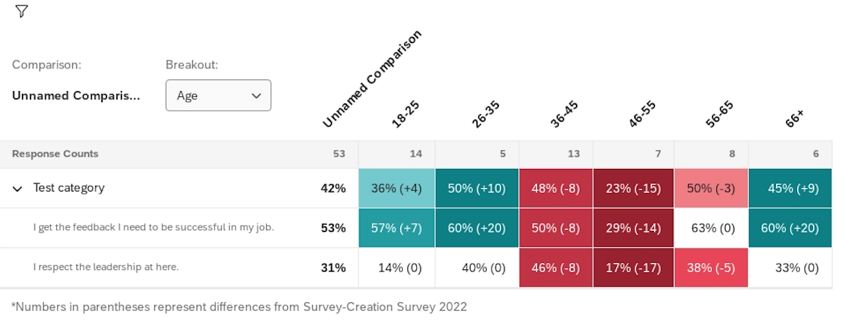
Your primary data source’s results will be presented first, with the difference in score from historical results in parentheses.
Example: In 2022, the Sales team scored 44% favorability on “I agree with the strategy and goals of this company.” That’s 21 less than they scored in 2021. Hence, the score appears as 44% (-21).

Qtip: The historical data setting may not appear in heat map widgets created before 2023. If you don’t see the setting shown in step 8, create a new heat map widget.
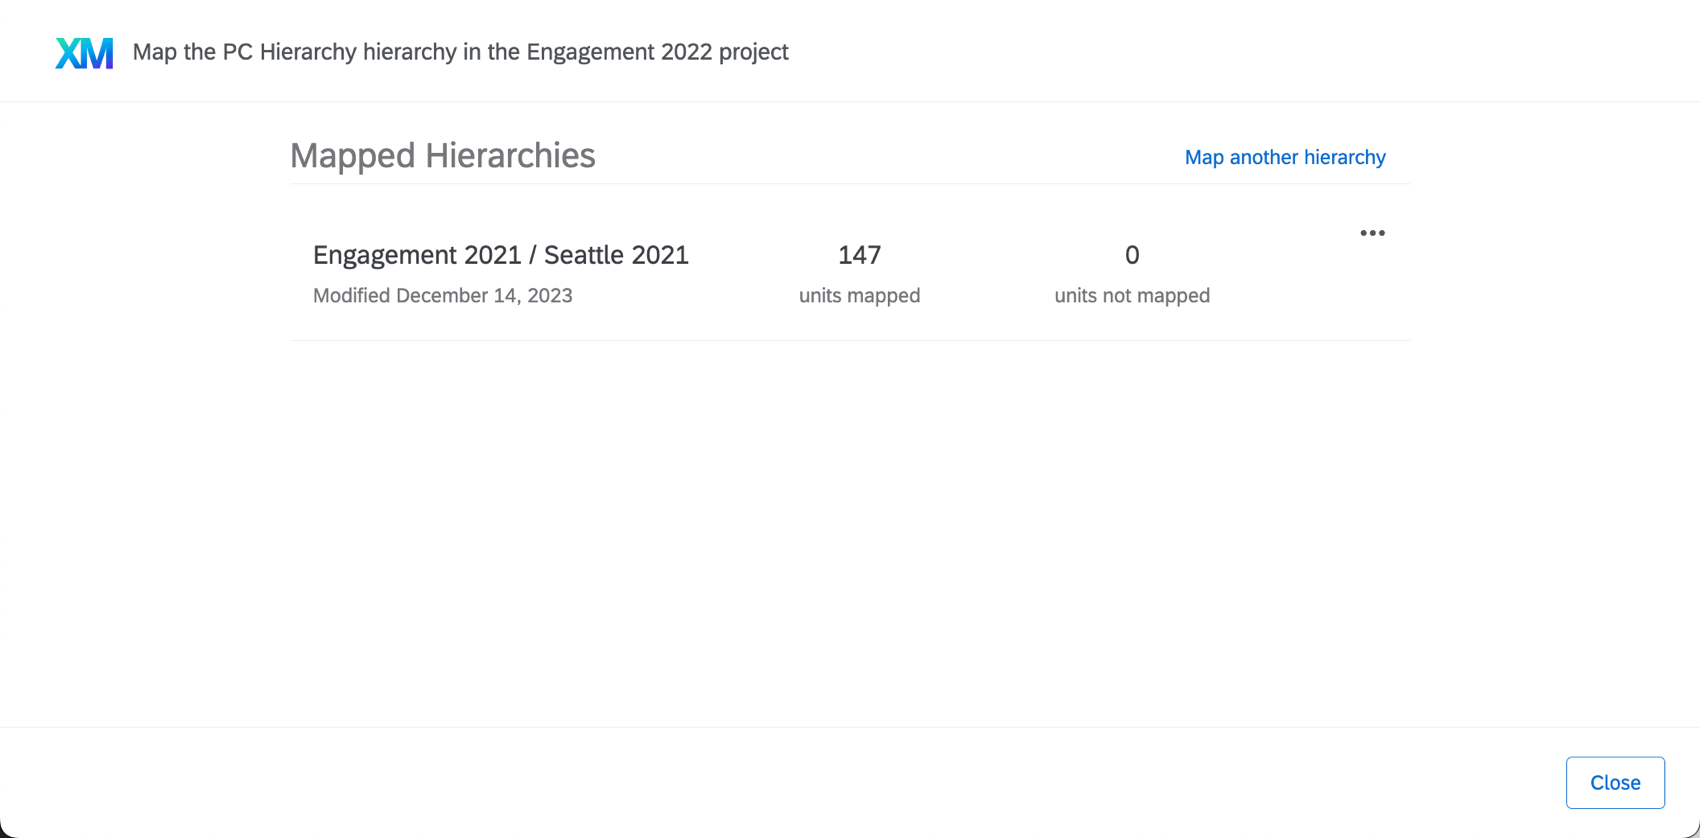
Qtip: Your historical source will need data and to have its hierarchy mapped to your current hierarchy. If you need help with these steps, see Uploading Historical Data.
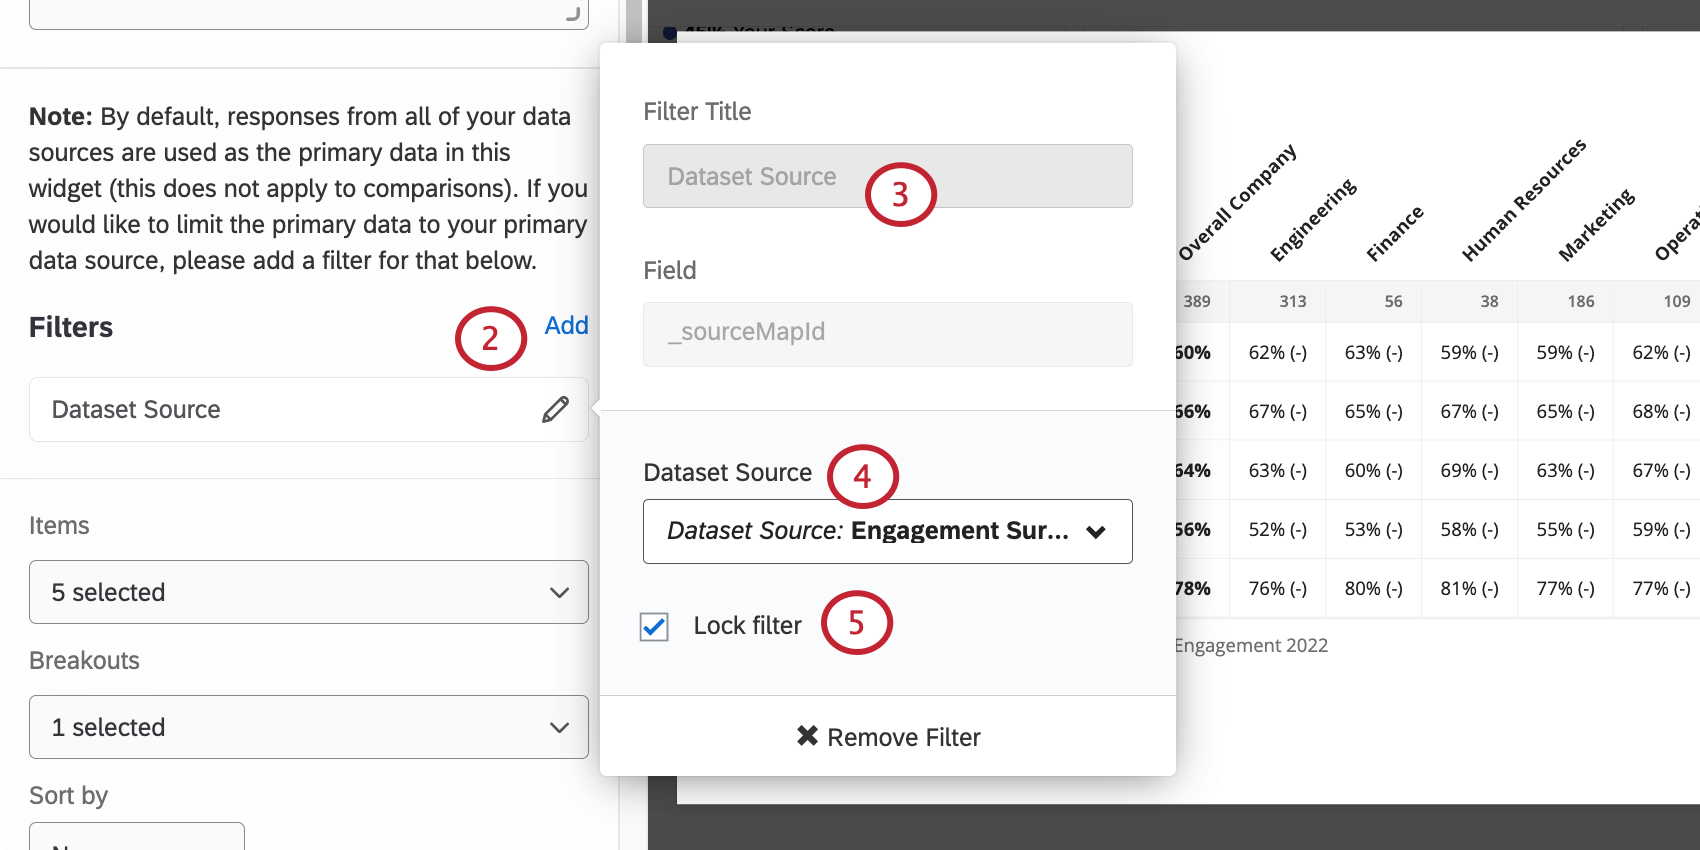
Qtip: If you do not filter for your primary data source, your comparisons will be inaccurate.
Attention: Any dataset source filters on a heat map widget will override your dashboard filters. For example, if you filter your widget to compare data from 2022 to 2023 and then filter your dashboard to only show data from 2022, your heat map widget will still compare data from 2022 against 2023.
Example: We want to compare 2022 and 2023 data. We filter our widget to show 2023 data. Then for the historical source, we select the 2022 data.
Additional Customization Options
This section covers additional options you have available for customizing a heat map widget.
Title and Description
Like all widgets, you can add a title and description to a heat map widget. These are useful for telling your dashboard viewers the importance of the data they’re looking at.
Show response count
Enable Show response count to add a row at the top of your heat map widget that shows the number of responses that are in each column breakout.
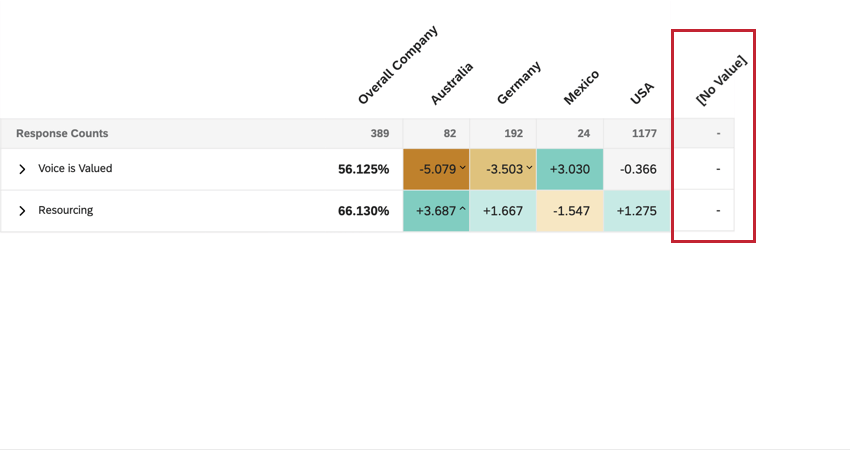
Exclude results that do not contain a value for selected breakouts
By default the Exclude results that do not contain a value for selected breakouts option is disabled. When disabled, responses that do not include a value for the selected breakout will be aggregated together into a [No Value] column. If enabled, responses that do not include a value for the selected breakout will be excluded from the widget.
![the [no value] column in a heat map widget](https://www.qualtrics.com/sites/default/files/styles/standard_xl_retina/public/migrations/dsx/content/heat-map-no-value.png.webp?itok=v_qEP16n)
Understanding Heat Map Widgets
Heat map widgets can display data in a few different ways. This section will cover how to view a heat map widget as a dashboard viewer so that you can understand the data displayed to you.
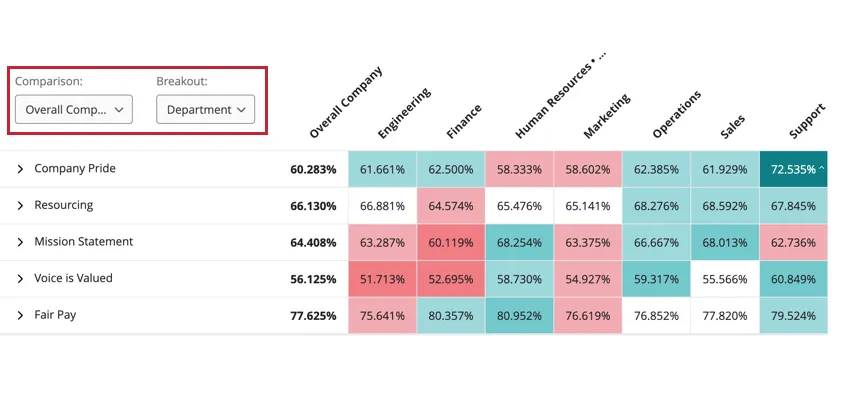
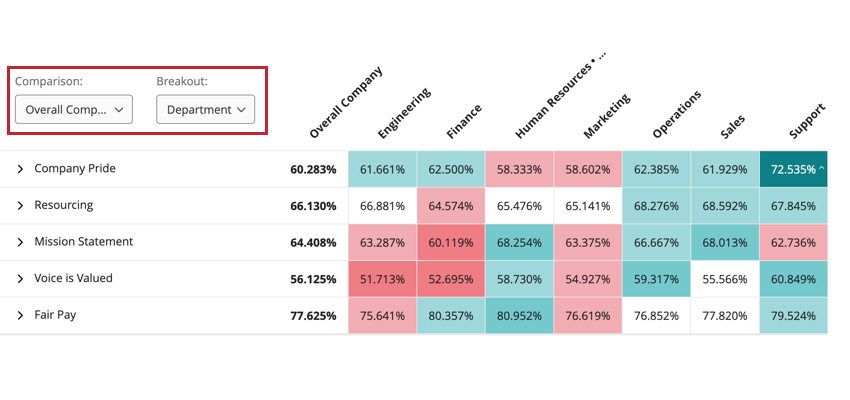
Switching Comparisons and Breakouts
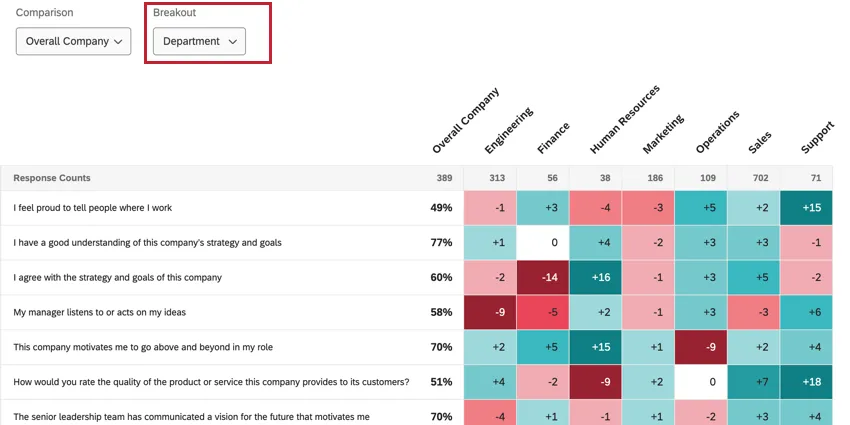
If the dashboard builder added multiple breakouts and comparisons to the widget, you can switch the currently displayed breakout and comparison by using the dropdown menus in the top left corner of the widget.
Breakout Comparisons
The heat map widget displays data by comparing the values for a question or category by your chosen metadata breakout. When viewing data in a heat map widget, the data in the widget will be different depending on how the dashboard builder decided to compare data:
- Data can be compared against the currently selected comparison. If this is selected, you will see a dropdown for switching comparisons if the dashboard builder added multiple comparisons.

- Data can be compared against historical data. If this is selected, you will see data in parentheses and a message below the widget telling you what data source is being used. You will not see a dropdown menu for switching comparisons.

Delta vs. Base Value
Depending on the widget’s settings, you may see numbers displayed as a base percentage (e.g., 80%) or as a delta change (e.g., +1). See Display Options for more information about both of these data formats.
Viewing More Information
You can hover your mouse over a statistically significant data point to view more information about that data point.
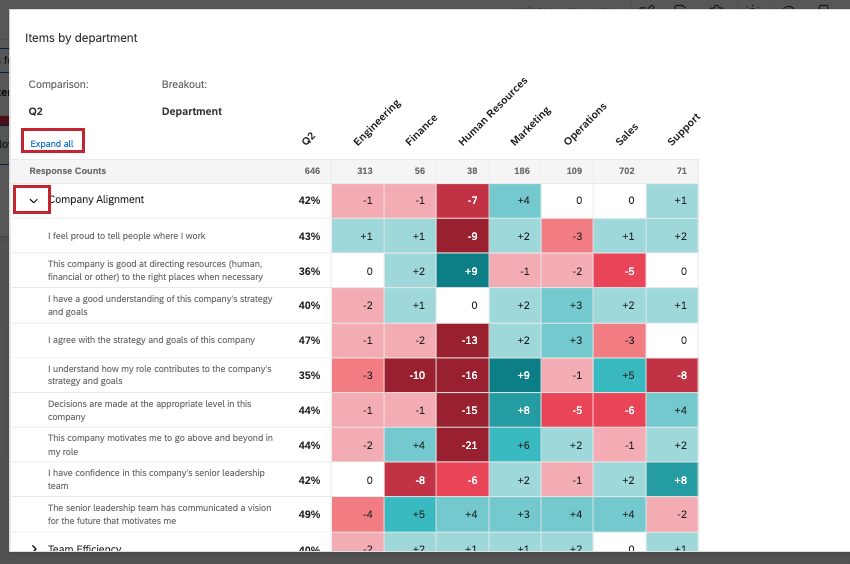
Expanding and Collapsing Rows
When the heatmap displays categories, the overall category performance is shown, with individual category questions nested underneath. Click the arrow or name of a category to expand and collapse the items underneath it. There will also be an Expand all / Collapse all button at the top of the widget.
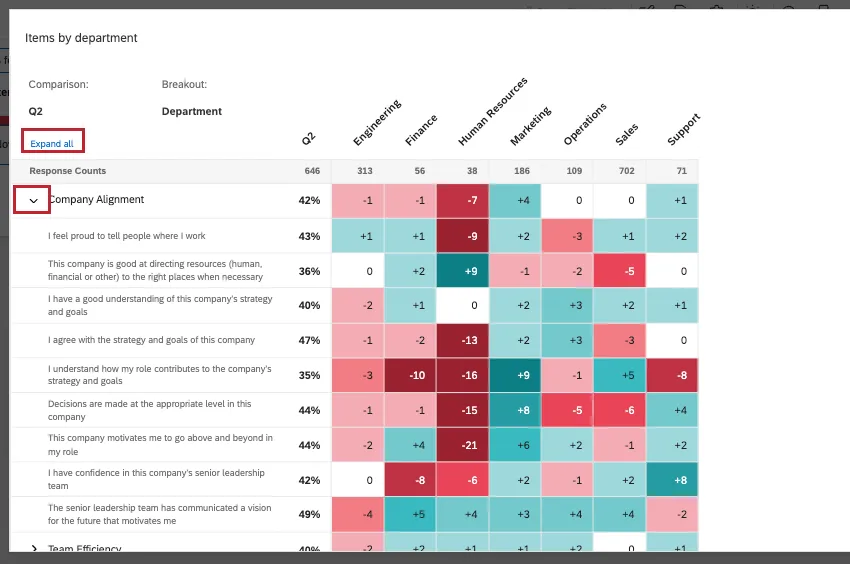
Qtip: Overall scores for a heat map widget will only be calculated and displayed if all of the statements have data.
Qtip: By default, all category rows are collapsed. You cannot customize which rows are expanded and collapsed by default.
Exporting Data for Heat Map Widgets
If you export a heat map widget with significance testing enabled, information about the statistical significance of your data points will be included in the export.
When exporting the widget to PDF or JPEG, data is exported exactly as it displays within the widget, including colors and arrows to indicate statistical significance.
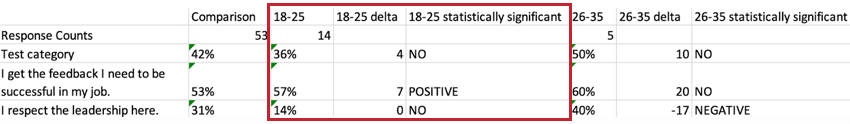
When exporting to CSV, TSV, or XLXS, data is exported in a spreadsheet format that contains all the same information as your widget, including statistical significance. In these exports, multiple (2-3) columns contain the data for each column of your heatmap. These columns include the following data:
- The value for the heat map column.
- The delta change of the value compared to the comparison or historical data source.
- The statistical significance of the data point, if statistical significance is enabled. Statistical significance can be one of the following options: POSITIVE, NEGATIVE, or NO.
Example: In the below example, the columns for 18-25 age group correspond to the 18-25 column group in the heat map widget.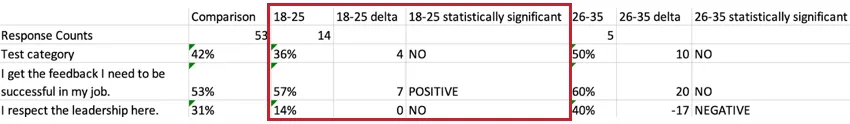
That's great! Thank you for your feedback!
Thank you for your feedback!