

Business Outcome Simulator
What's on this page
About the Business Outcome Simulator
The Business Outcome Simulator evaluates how experience drivers can impact core metrics like NPS or CSAT, isolating the most valuable areas of investment. This tool can then help you simulate possible outcomes of targeted effort on these drivers, providing you with thorough, data-backed predictions you can share in leadership dashboards.
Here’s an overview of what this process looks like:
- Create a dataset with relevant drivers, outcome metric, and filterable information.
- Create a “business case” with the dataset.
- In the business case, create simulations of driver changes.
- Build a widget to share results.
From there, you can add your results to a CX Dashboard in the form of a widget.
Qtip: The Business Outcome Simulator is currently only compatible with Customer Experience, and is used with features such as CX programs, dashboards, and datasets.

Accessing the Business Outcome Simulator
Permissions Required
The following permissions are required to create business cases in the Business Outcome simulator:
- User type of Brand Administrator or CX Administrator.
- User permissions give access to CX Dashboards, such as:
- Customer Experience (Project Permissions)
- Use CX Dashboards (Account Permissions)
- Create CX Projects (Account Permissions)
If a user meets the conditions above and is added to a dashboard with view access, they will see all business cases connected to that dashboard’s dataset in the Business Outcome Simulator.
You can only edit business cases you’ve created.
Navigating to the Simulator
The Business Outcome Simulator can be accessed from a couple different locations.
Open a Customer Experience Program, then select the Business Outcome Simulator tab.
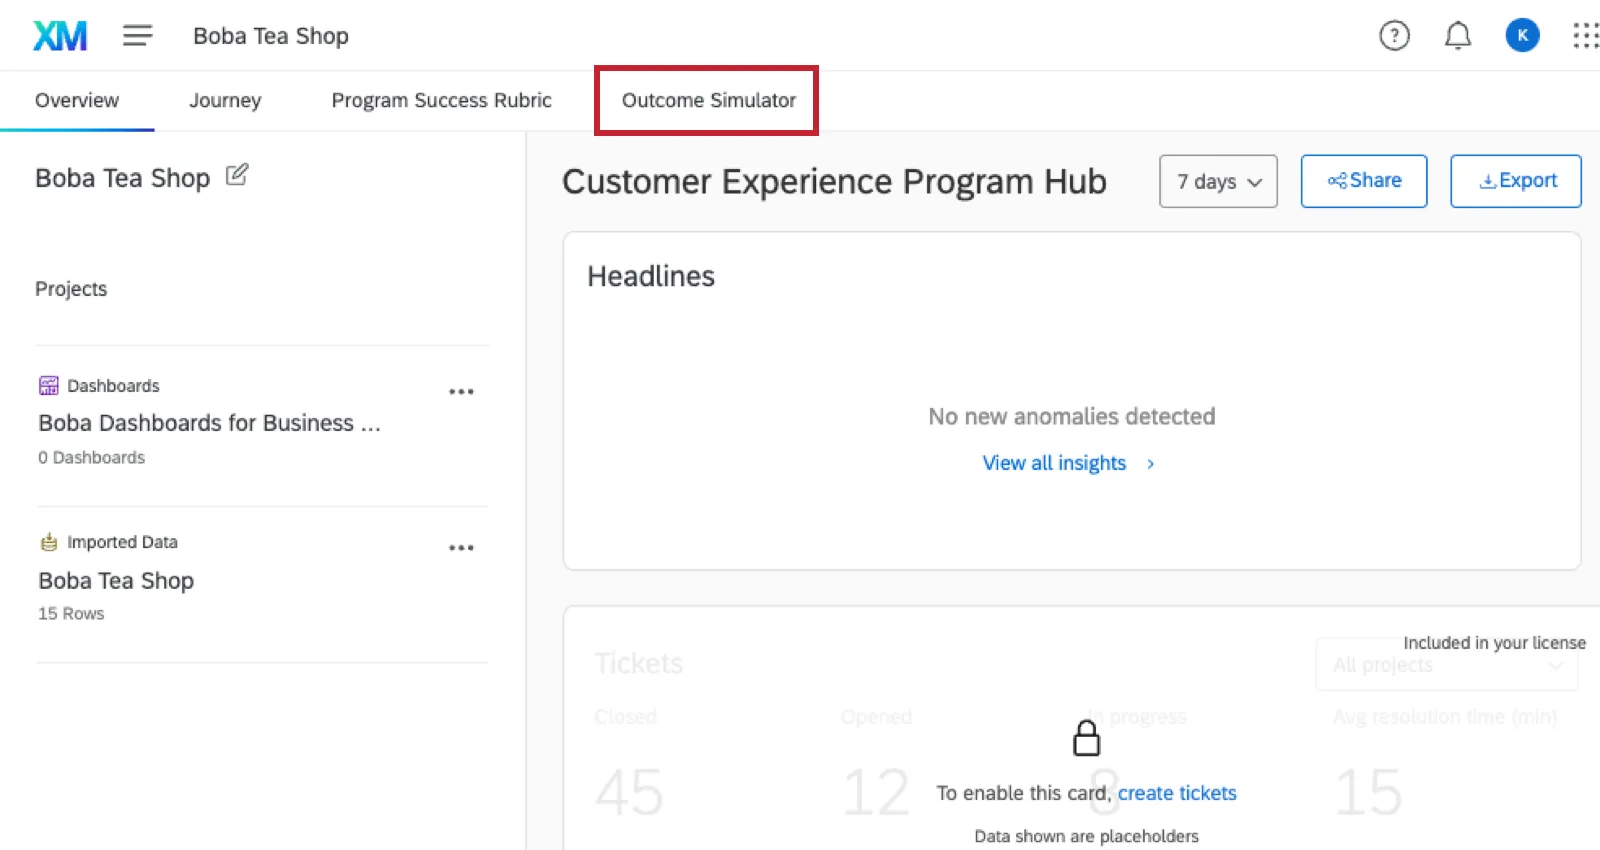
Qtip: Whenever you open this page, you’ll see all business cases you created in your account, even if you created them in different CX programs.
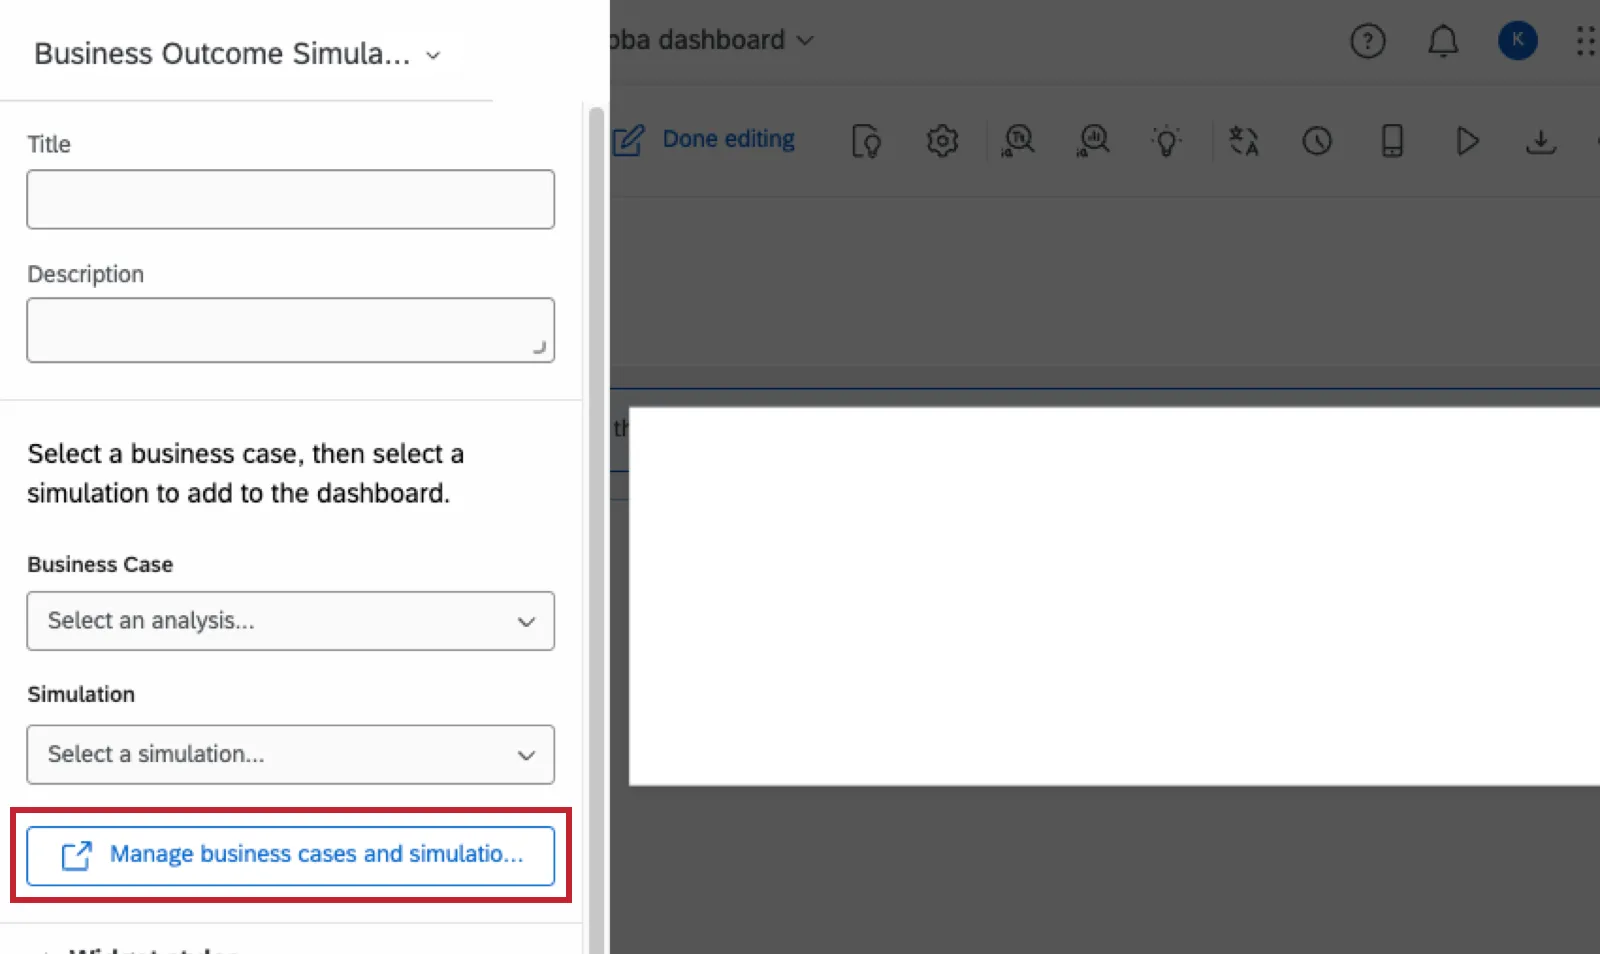
Open a CX Dashboard and create a Business Outcome Simulator widget. Then click Manage business cases and simulations.
Preparing a Dataset for the Simulator
Qtip: You can only use datasets you created yourself in the Business Outcome Simulator.
To use the business outcome simulator, you need to create a dataset.
Attention: Make sure you have at least 2 fields that are either the Number Set or Numeric Value field type.

Other than requiring numeric data, there are not many limitations to the dataset you use. It’s ok if the dataset’s already being used in an existing dashboard. Data models and mappers both work with the simulator. The simulator is also compatible with all CX source types, such as surveys, imported data projects, tickets, and so on.
Qtip: You can have open text fields in the dataset, but they cannot be used with the Business Outcome Simulator. Categorical data (i.e., text set, multi-answer text set) can be useful for setting filters.
Creating a Business Case
Once you’ve created a dataset, open the Business Outcome Simulator to get started. To create a business case, you'll identify your drivers vs. the outcome metric. When finished setup, the simulator will show the statistical proof of each driver’s impact.
Qtip: You should not create a business case until you’ve collected data.
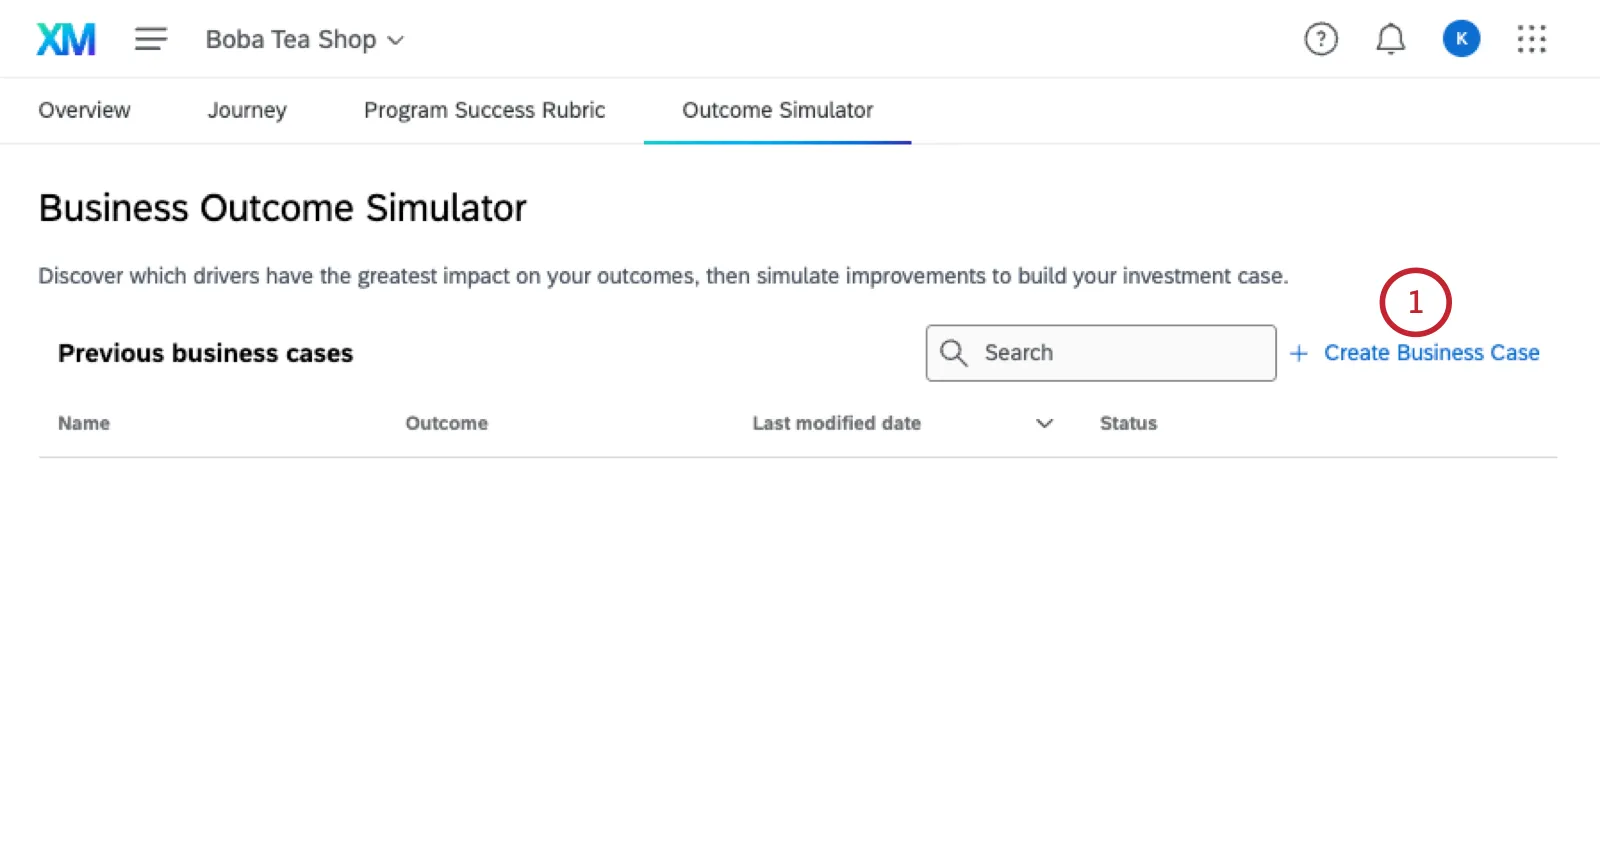
Click Create Business Case.
Select the dataset you created.
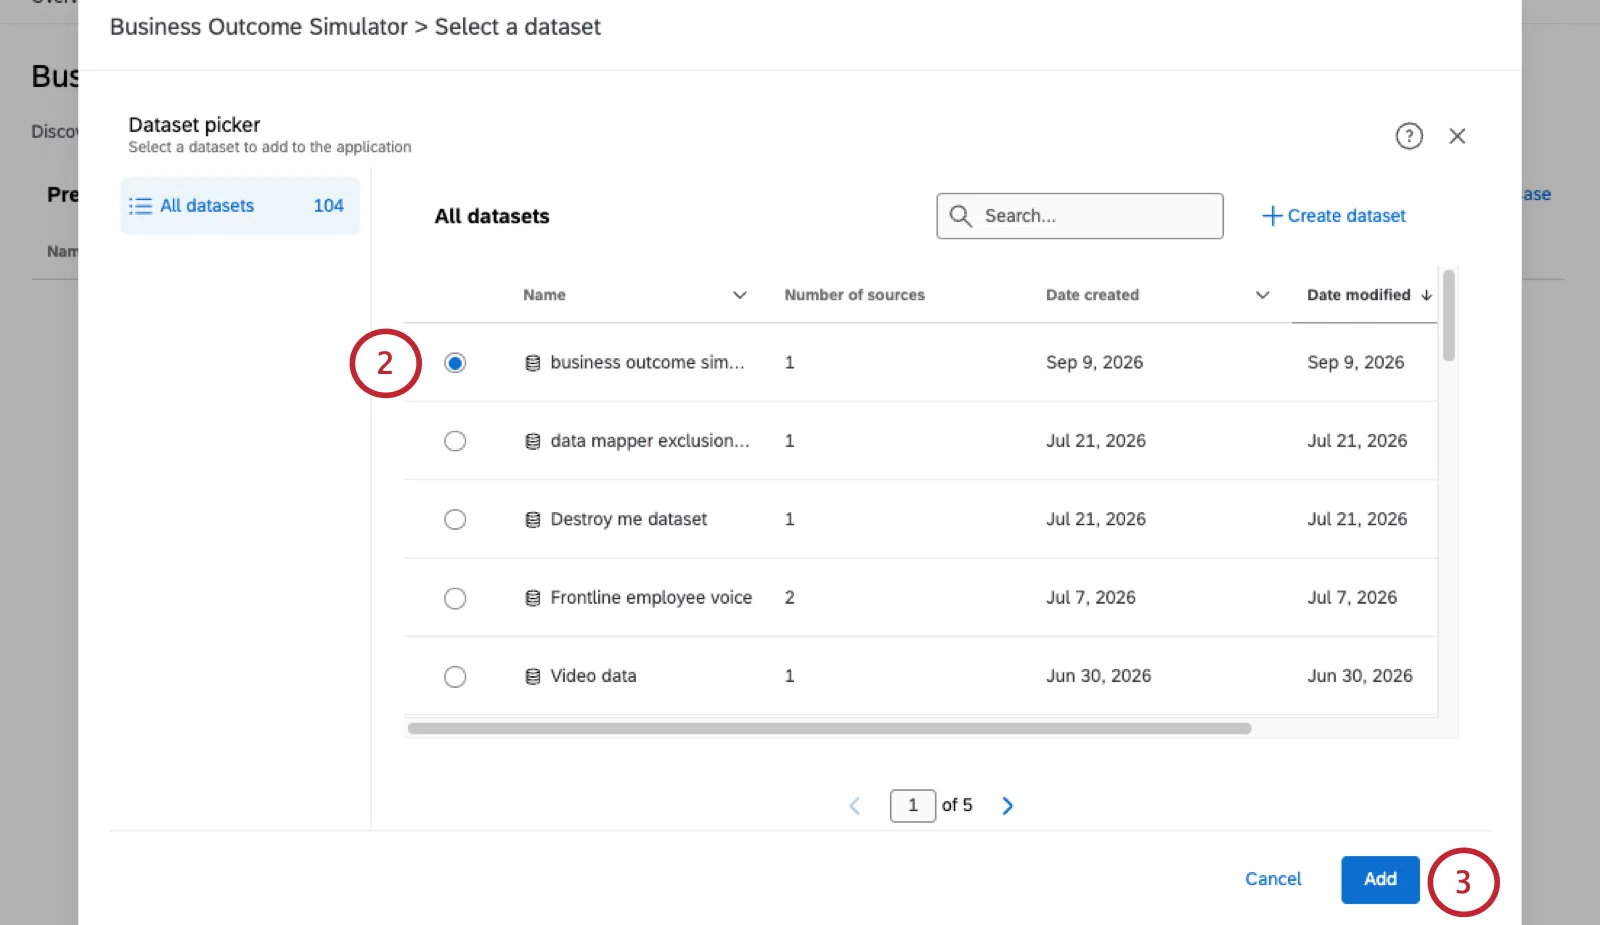
Click Add.
Name your business case.
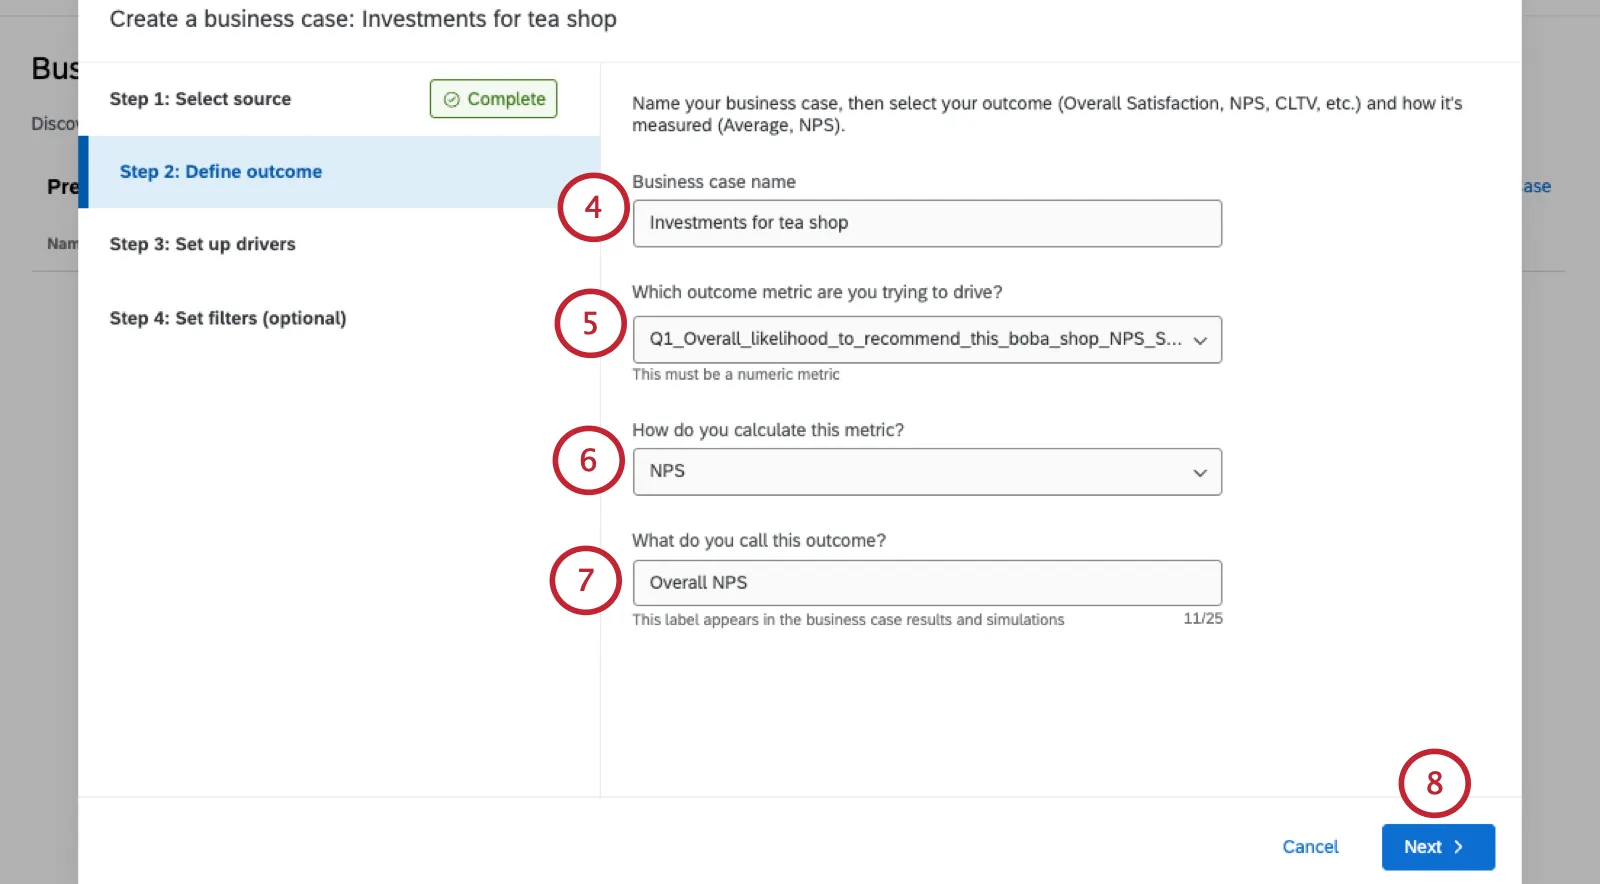
Select the outcome metric you’re trying to drive.
Qtip: Because this must be a numeric measure, only Numeric Values and Number Set fields will appear.
Select how you calculate the metric:
- Average
- NPS (Net Promoter Score®)
Name your outcome metric.
Click Next.
Add up to 10 drivers. For each one:
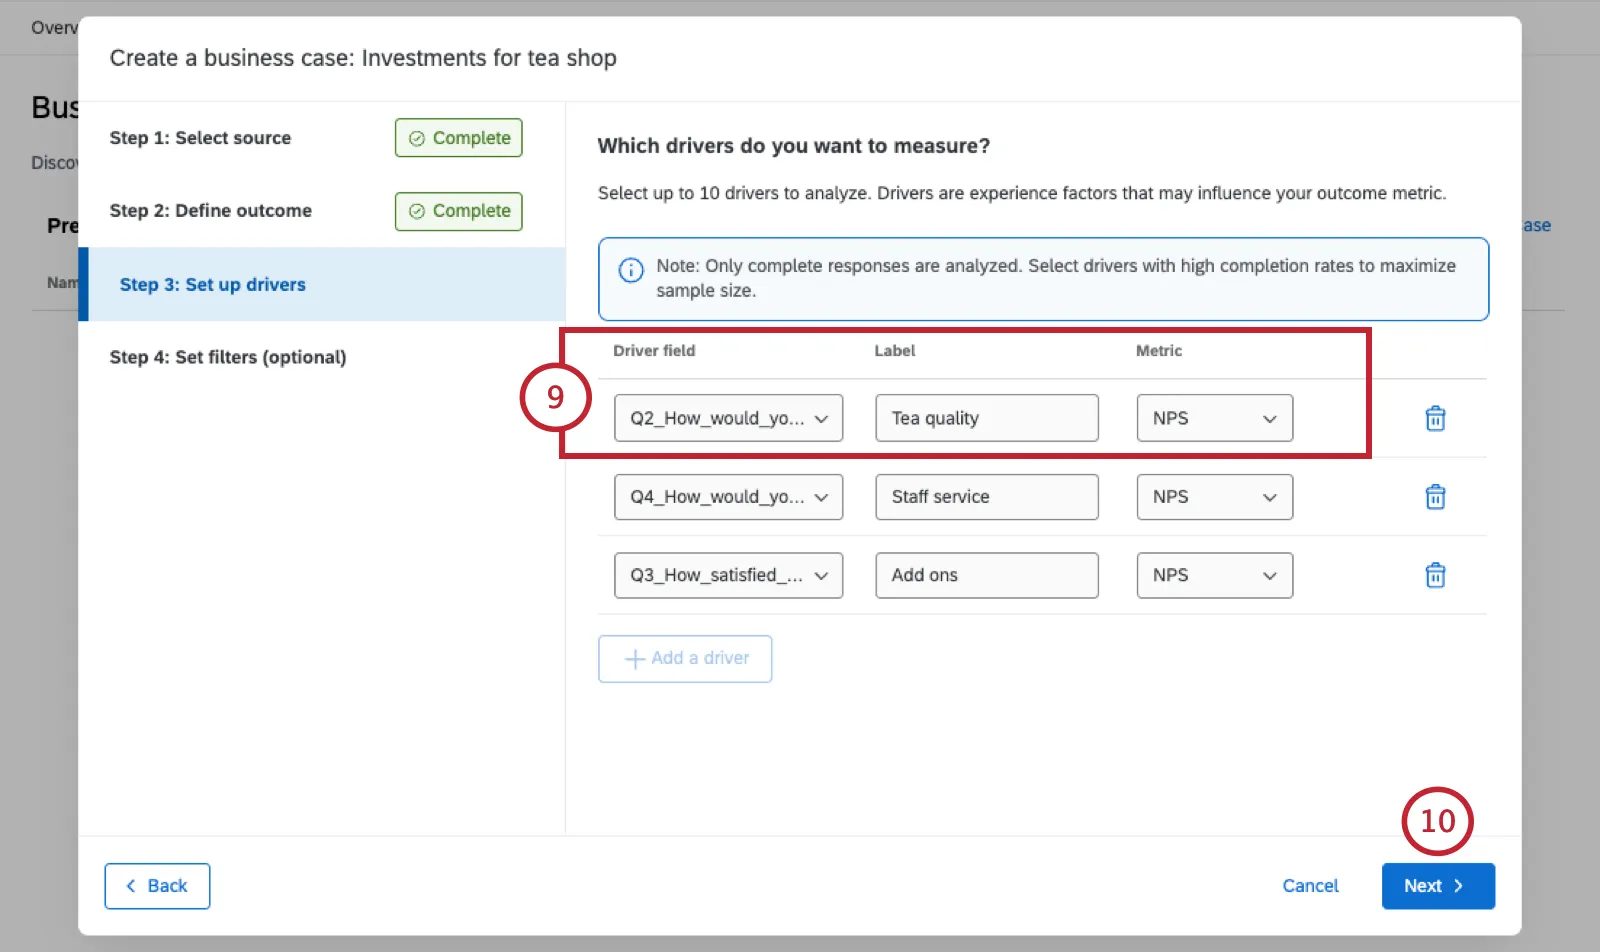
- Select the dataset field.
- Give it a label.
- Define the metric as Average or NPS.
Qtip: The Business Outcome Simulator only analyzes complete responses. Select drivers with high completion rates to maximize your sample size.
Click Next.
If desired, filter your business case.
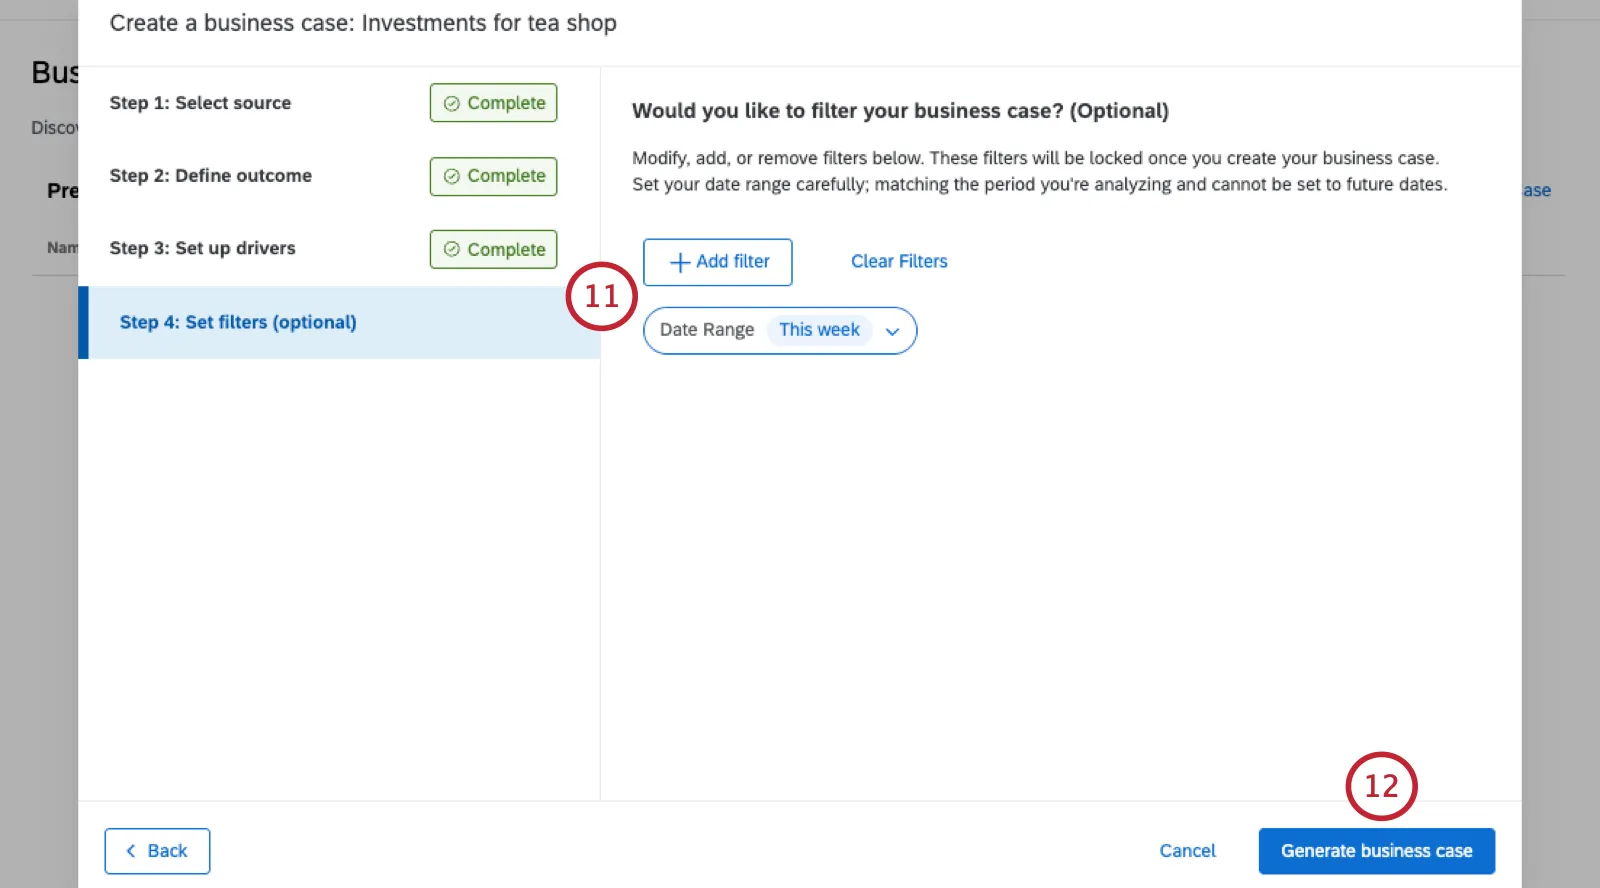
Attention: Business case filters cannot be changed later.
Qtip: Date filters cannot be set to a future date range.
When finished, click Generate business case.
Depending on the dataset size, it can take some time for the business case to generate. When finished, the status changes from Analyzing to Ready.
Viewing a Business Case
You can find your business cases in the Outcome Simulator tab. When your business case changes to Ready, click its name to see drivers and simulations.
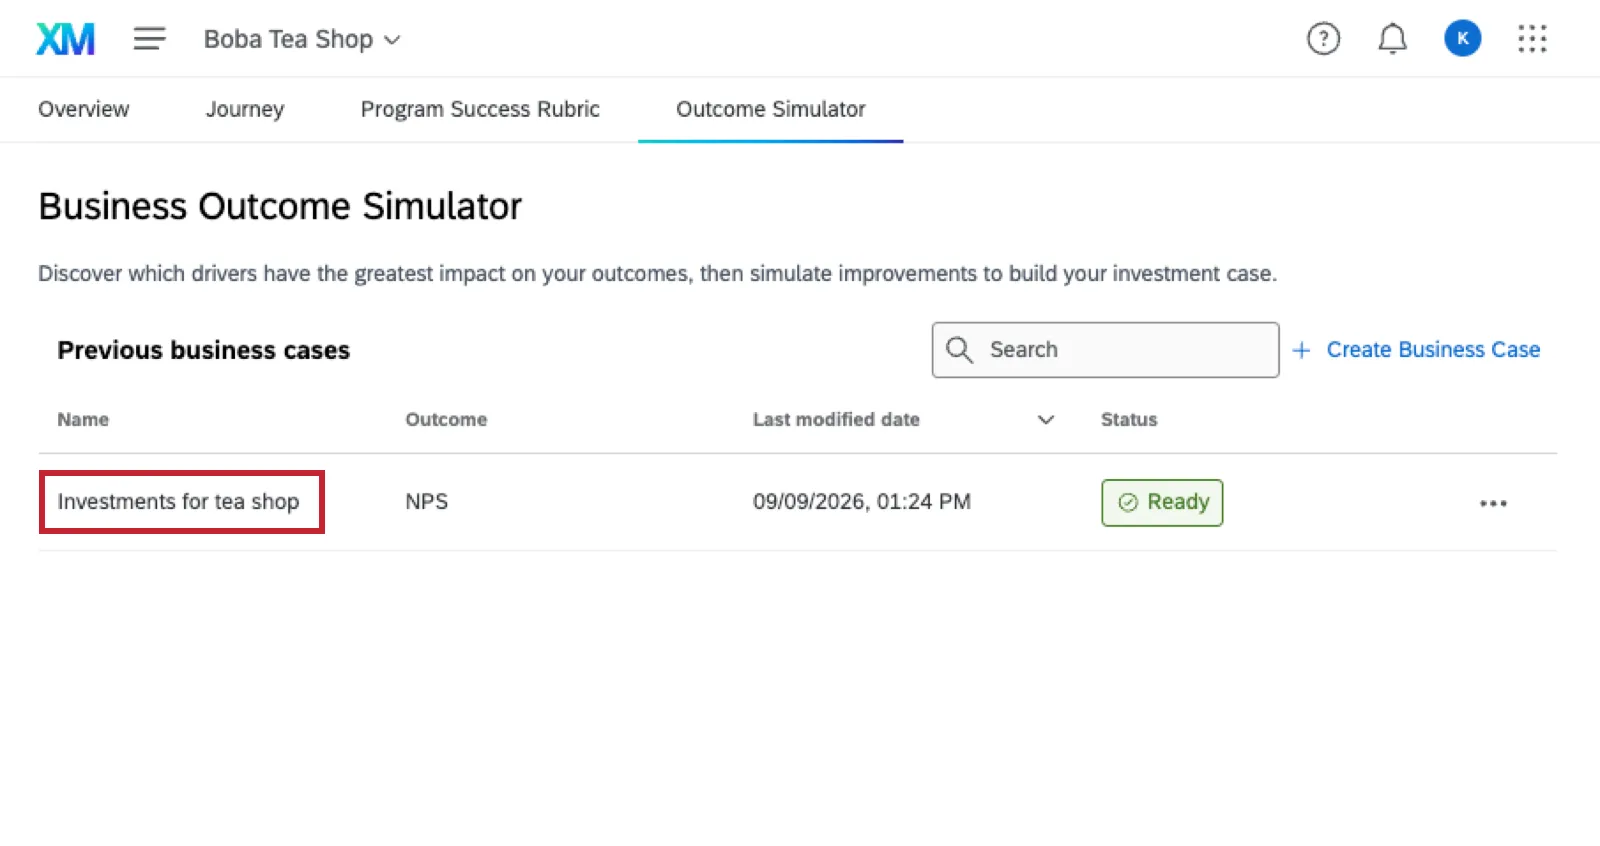
Qtip: Each business case shows its name, type of outcome metric, and the date and time it was last modified.
Once inside a business case, you’ll see information at the top:
- Name of business case
- Number of responses in its dataset
- Model strength
- The time and date it was last run
- Outcome metric type (NPS or average)
- Outcome metric score (which can be helpful for comparison as you run simulations)
- Filters applied (if any)
Drivers
Click Drivers to see the business case’s drivers.
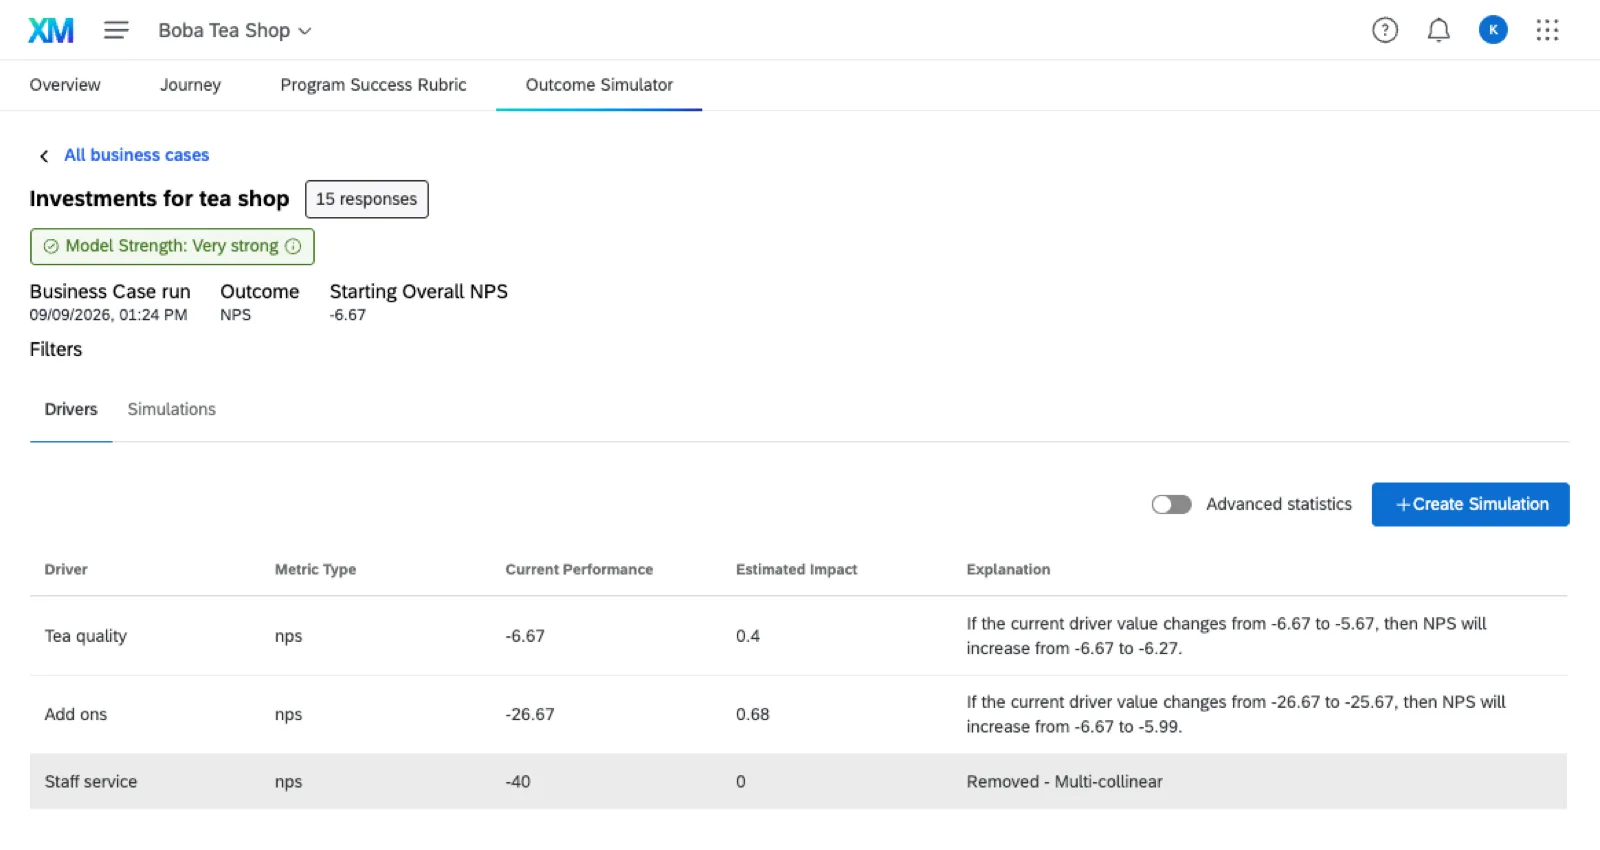
- Metric type: Whether the metric is NPS or average.
- Current Performance: The driver’s current performance on the set metric.
Qtip: This number reflects the outcome metric at the time the business case was created. Remember business case data is static and does not reflect incoming data changes.
Example: Here, the NPS for Tea Quality is -6.67, which we see in the Current Performance column.

- Estimated Impact: The estimated impact of this specific driver on the outcome metric. Impact is calculated using Ordinary Least Square (OLS), and this measure shown is the coefficient of the driver.
Qtip: For reference, your outcome metric appears at the top of the page, under the model strength.
- Explanation: An explanation of the driver’s impact on the outcome metric, showing what would happen if the driver increased or decreased.
Qtip: If for some reason a driver you selected was removed from the final list, you’ll see that driver with an explanation. In the example from this screenshot, the “Staff service” driver is multi-collinear with another variable in the regression, to the point where its independent effects on the outcome metric are impossible to determine.
Advanced Statistics
When you select Advanced statistics, you’ll see additional columns for each driver:
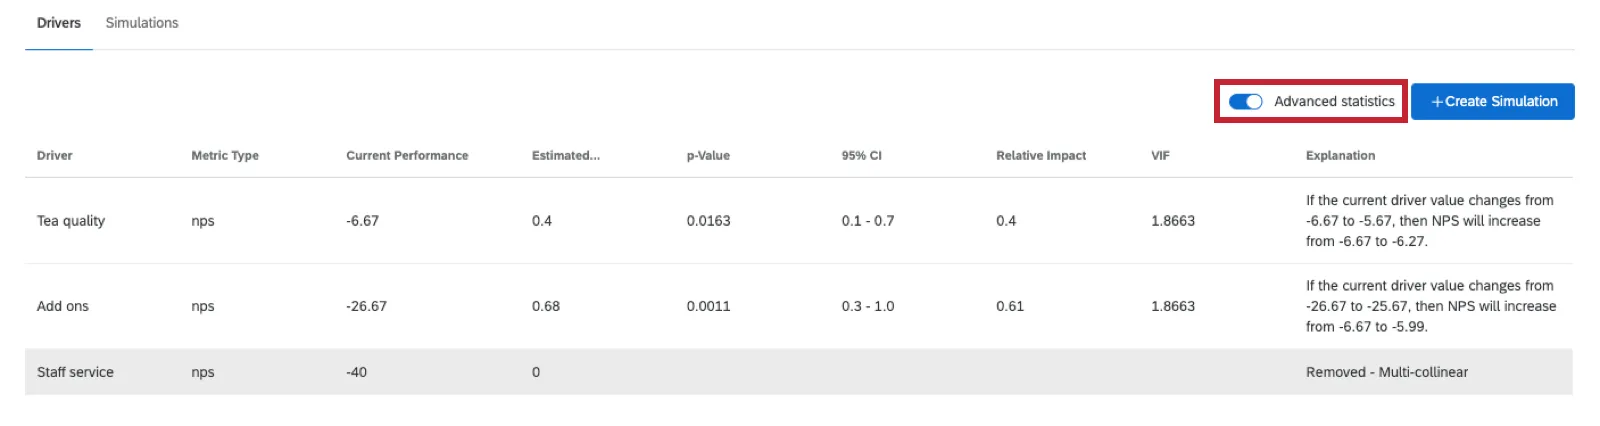
- p-Value
- 95% Confidence Level (Cl)
- Relative Impact
- VIF (variance inflation factor)
Editing a Business Case
Qtip: Only the creator of a business case can edit it.
When viewing the list of business cases in the Outcome Simulator tab, you can access a menu of editing options.
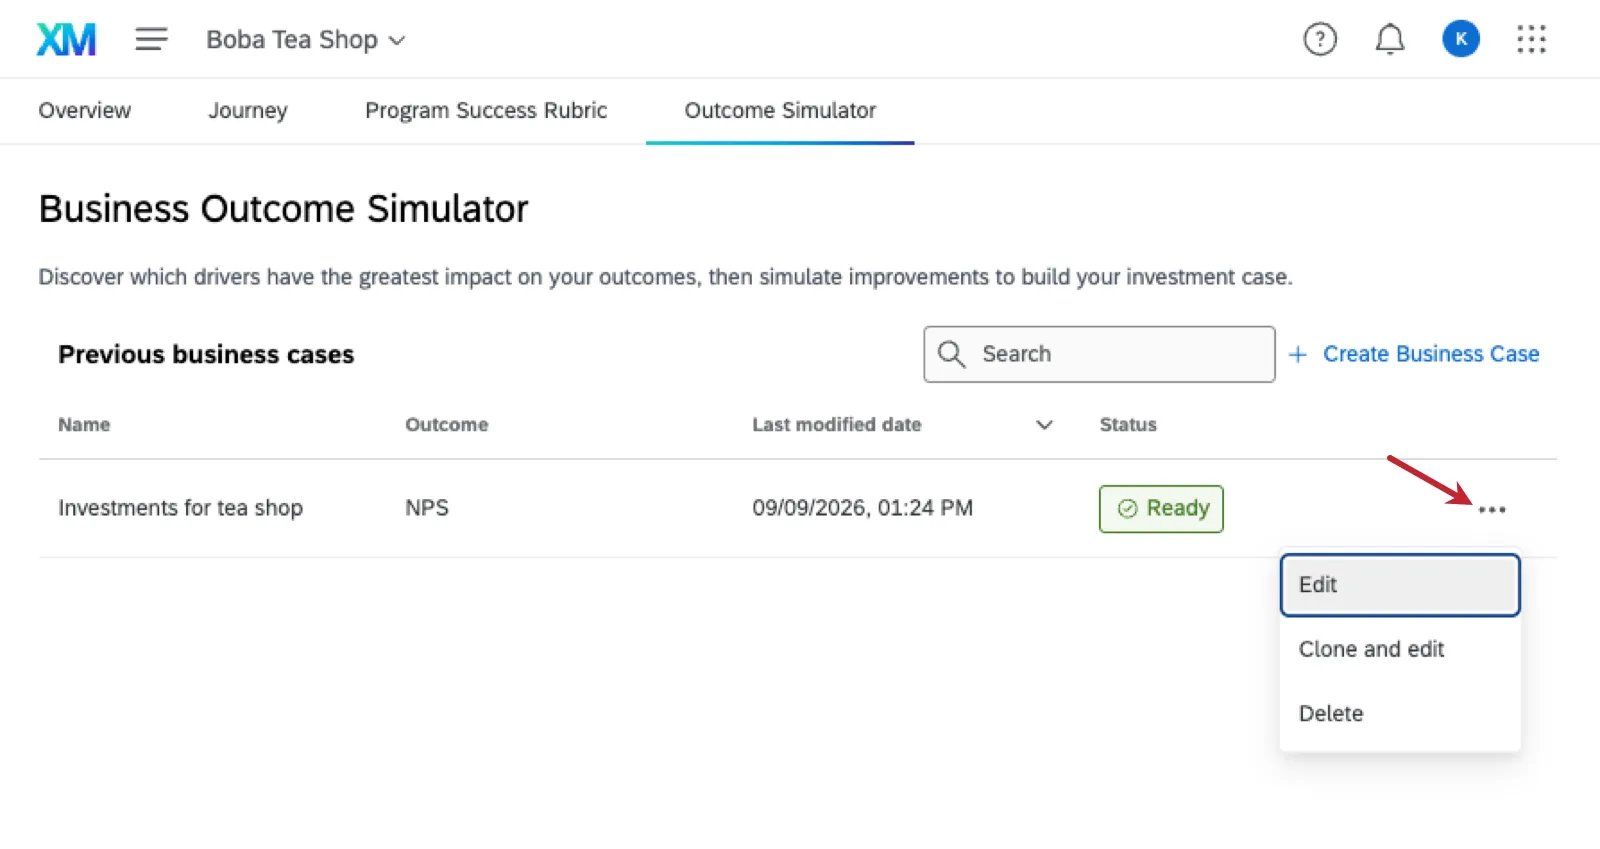
Click the 3 dots, then choose between:
- Edit: This option is only available before you create simulations in the business case. Edit the basic setup of the business case, like outcome metric and drivers.
- Clone and edit: Create a copy of the business case and edit its setup.
- Delete: Delete the business case permanently.
Creating Simulations
Once you’ve created a business case, you can create a simulation. Select the drivers you’d like to include in your simulation and adjust their values to see the potential impact on your outcome metric.
Make sure you’ve created a business case. Open it.
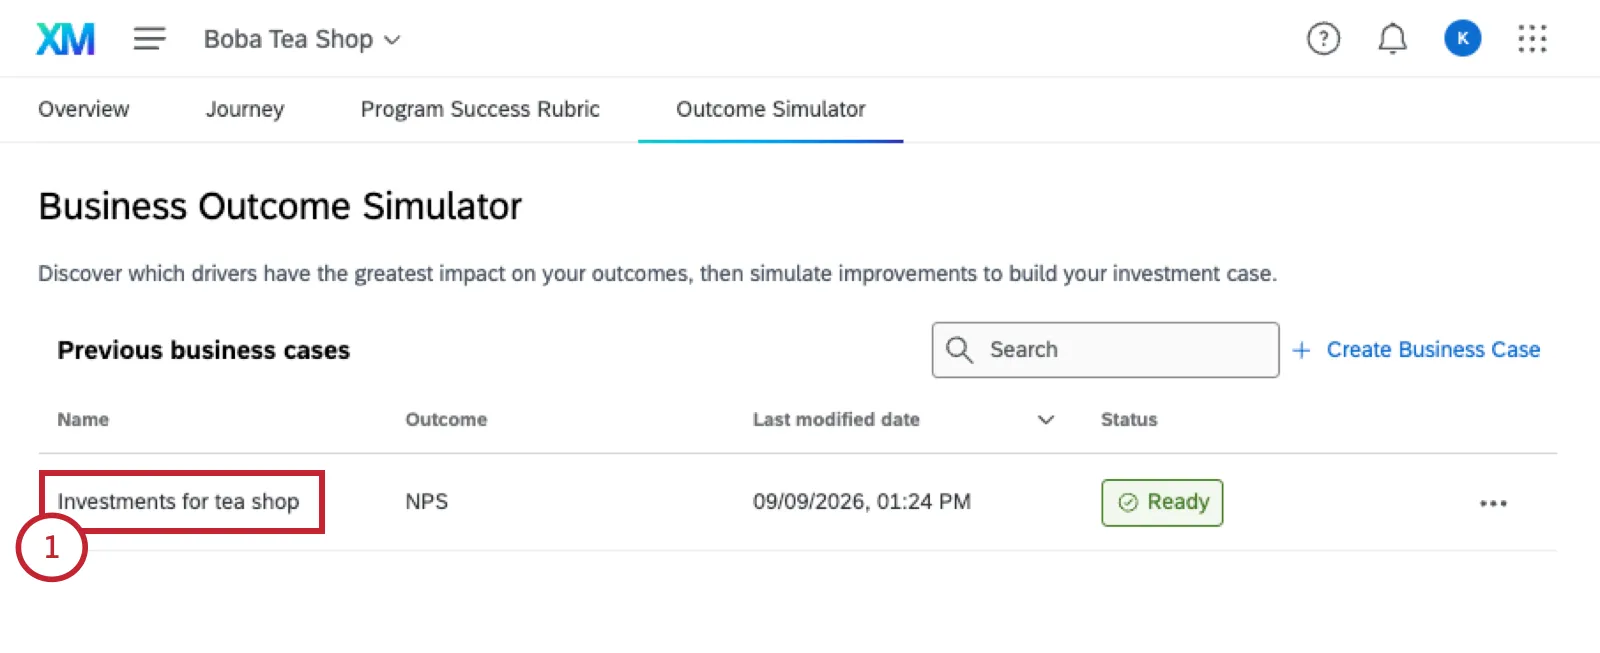
Go to Simulations.
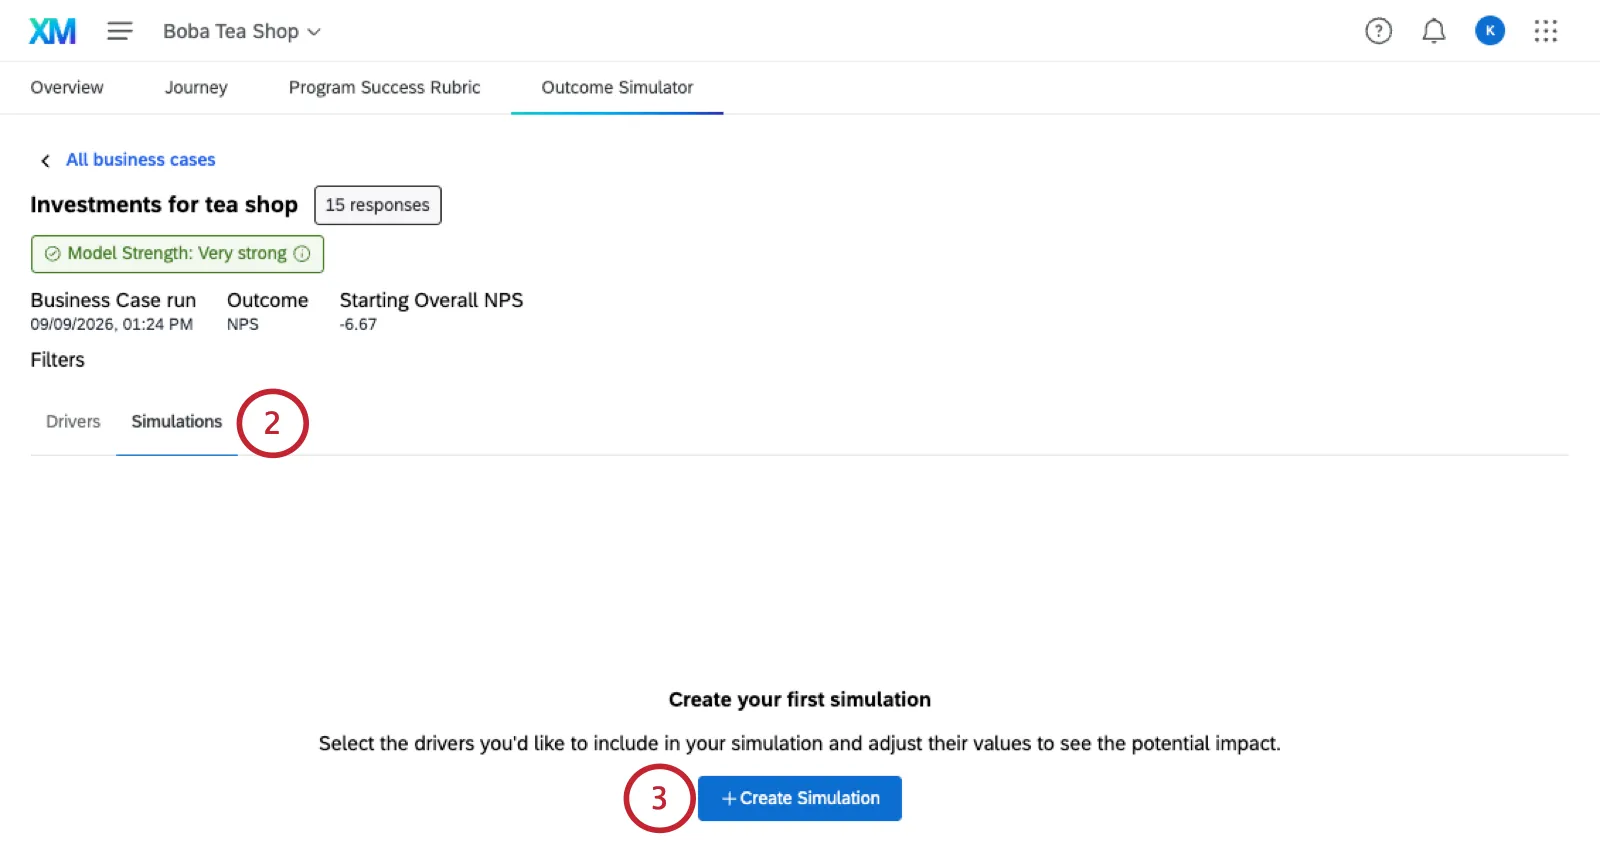
Click Create Simulation.
Name the simulation.
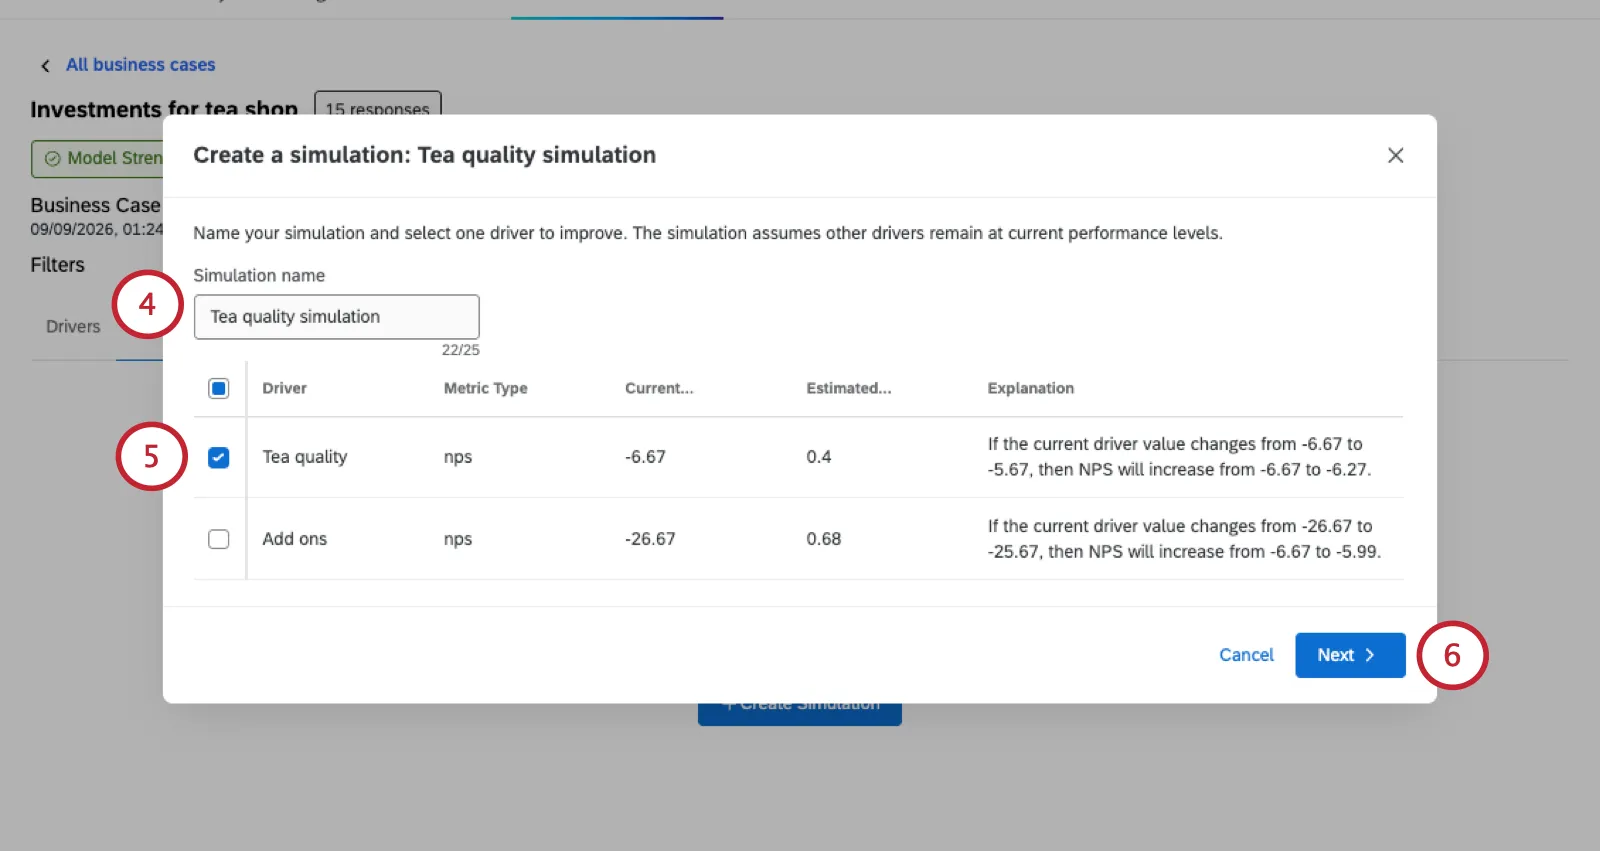
Choose 1 driver to simulate.
Click Next.
Adjust the target score you’d like your driver to reach.

Qtip: As you change the driver’s target, you’ll see a predicated impact on your outcome metric.
When you’re done, click Save.
Building the Business Outcome Simulator Widget
In order to share the results you found as part of your business outcome simulation, you can create a widget in a CX Dashboard.
Qtip: Make sure the dashboard dataset is the same dataset as the business case! Any user with at least view access to the dashboard will be able to see data in the business outcome simulator widget.
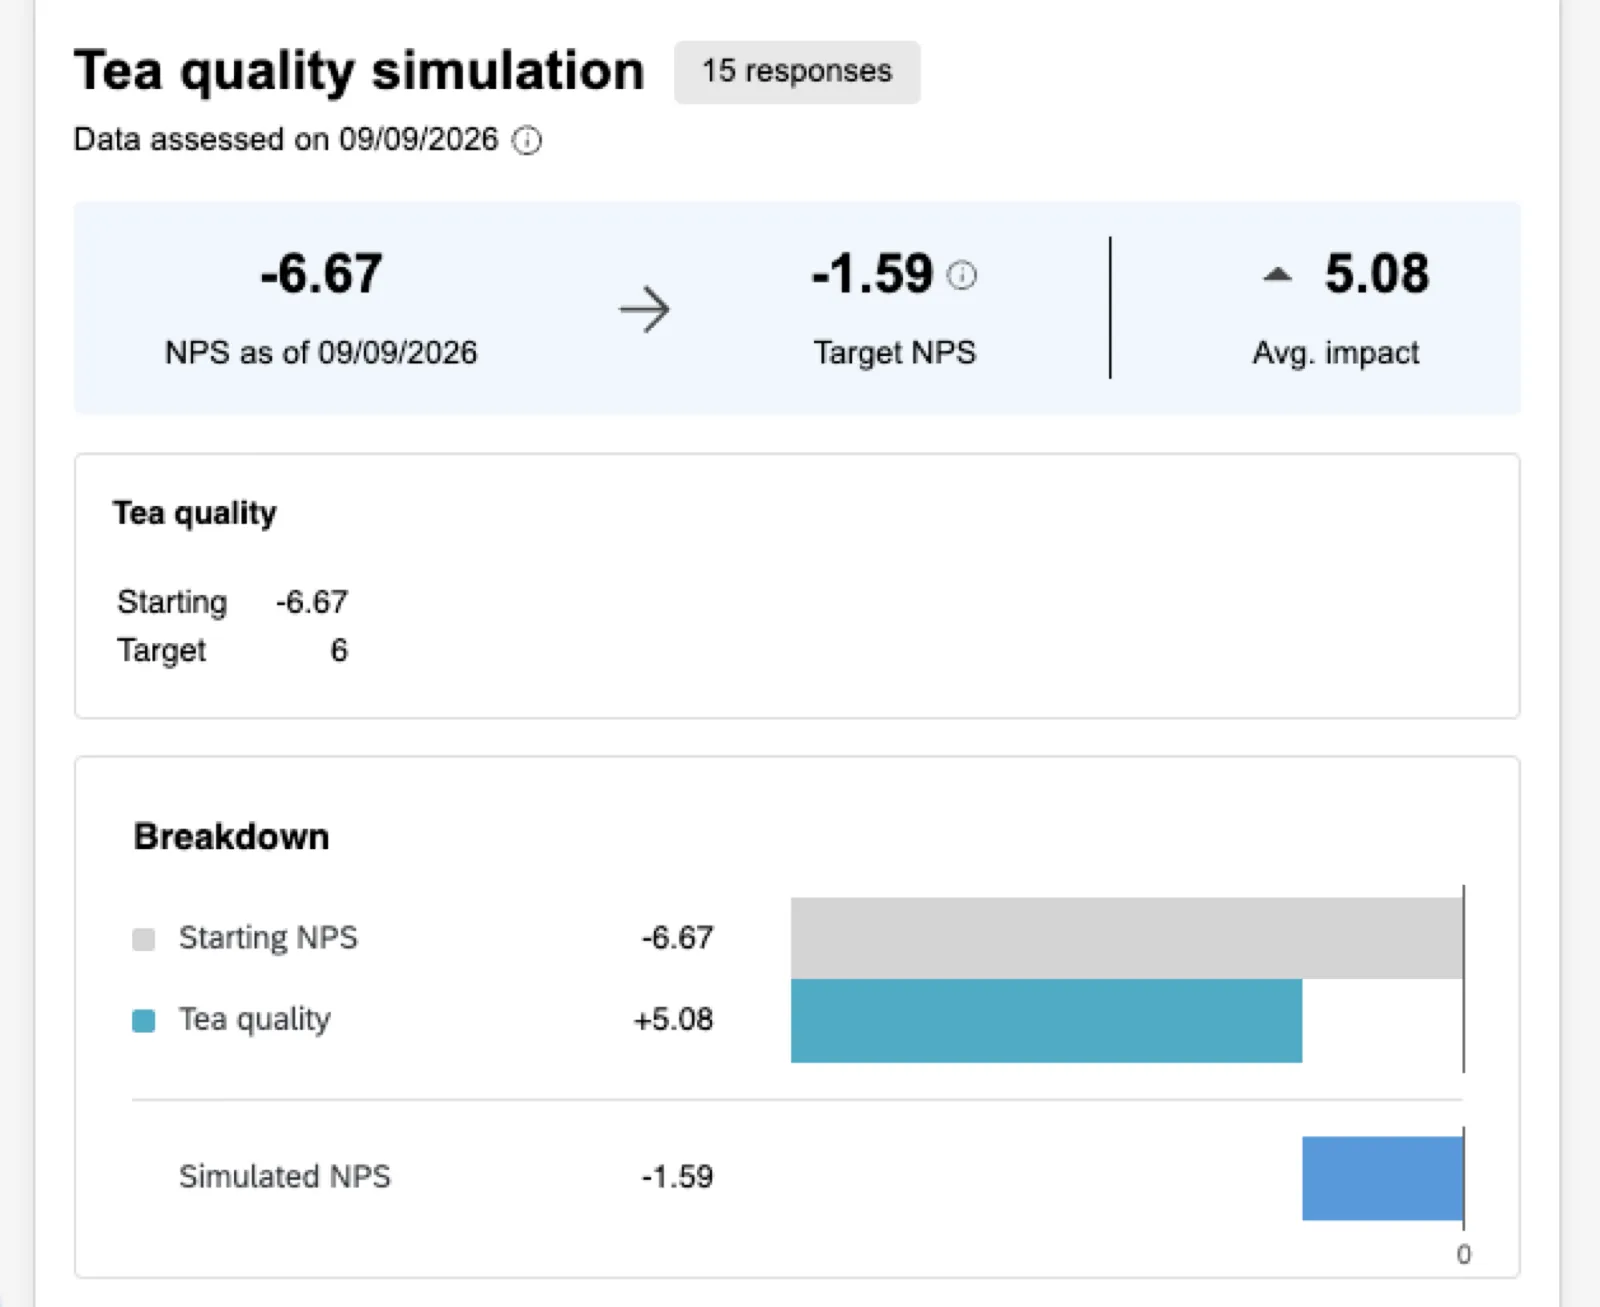
Attention: The data in the business outcome simulator widget is static. It won’t respond to dashboard filters or update as more data is collected.
To set up a Business Outcome Simulator widget, all you need to do is select a Business Case and Simulation to display.
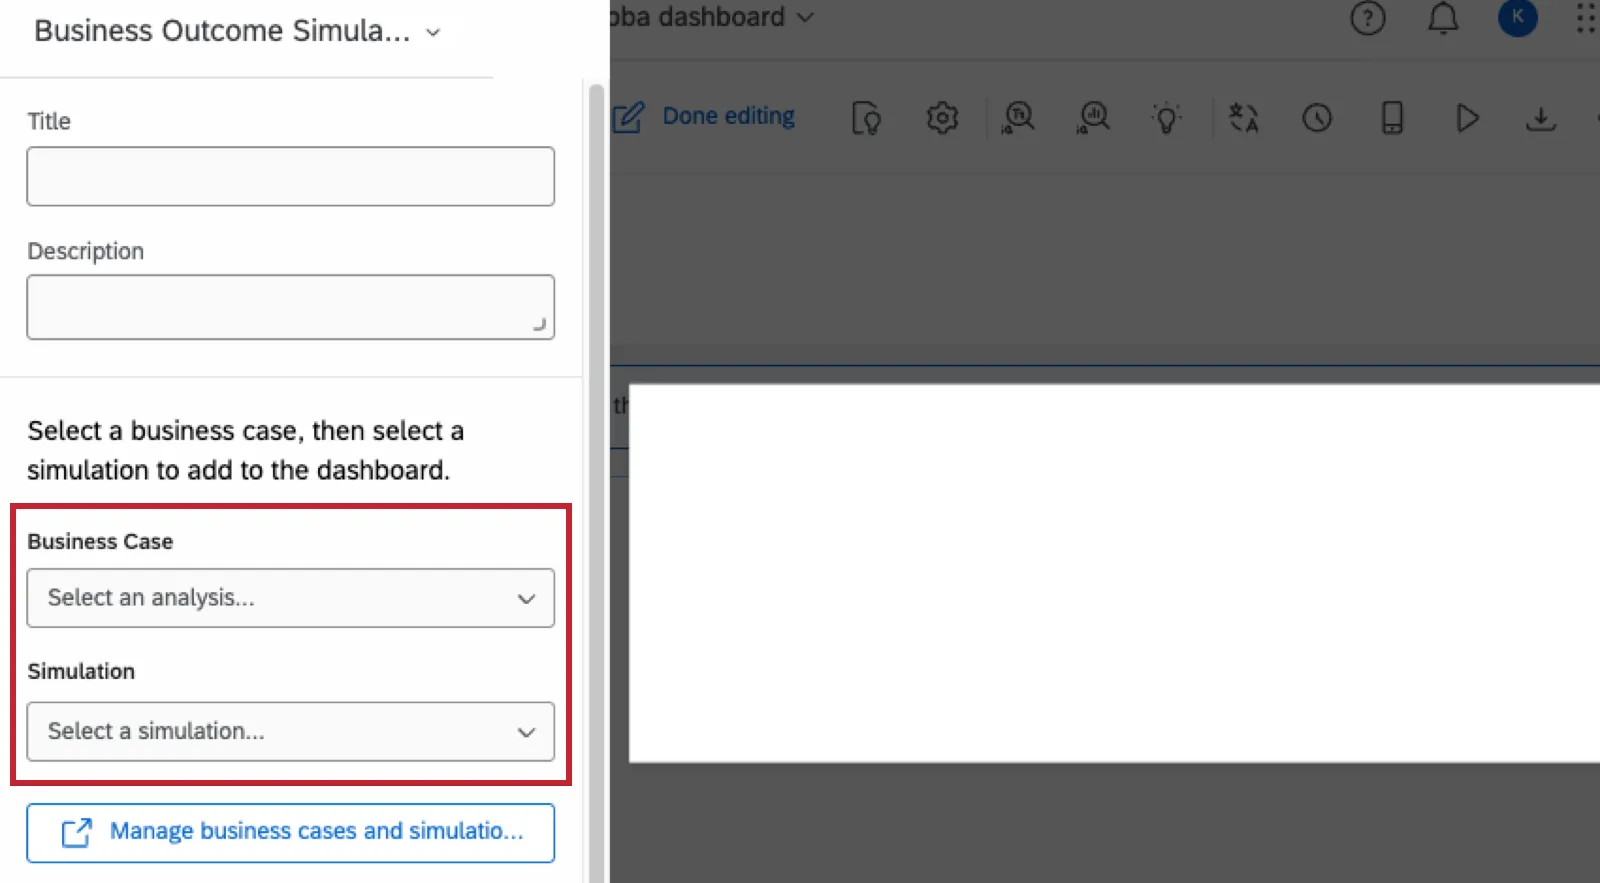
This widget can be exported, but only in JPG and PDF.
FAQs
What can cause a business case to fail to be created?
What can cause a business case to fail to be created?
Business case failures can happen for a few reasons, including issues with the dataset, outcome metric, drivers, or filter selections that were chosen. If there’s an issue with the dataset, the Failure status will come with a tooltip that displays the reason. Examples include:
- One or more drivers have the same value in every row. Adjust your drivers or filters, then try again.
- All drivers were removed due to insufficient variation. Adjust your drivers or filters, then try again.
- More drivers are selected than data points available. Reduce drivers or add more data, then try again.
- The regression could not be performed because there was no data, either due to restrictive filters or variables having many missing cases. To fix this, relax your filters and remove variables with a lot of missing cases from the model.
Are business cases static, or do they update as more data is collected?
Are business cases static, or do they update as more data is collected?
They are static and will not dynamically update. However, if you manually edit the business case, it will rerun on the current dataset, thus including more up-to-date information.
Can open text data be used as a filter when building the business case?
Can open text data be used as a filter when building the business case?
Currently, no. Only text set and multi-answer text set fields can be used as a filter.
Can measure groups be used as dataset drivers or outcome metrics?
Can measure groups be used as dataset drivers or outcome metrics?
No, the measure group itself cannot be used as drivers or outcome metrics. The individual fields making up a measure group can, though, because they are Number Set and Numeric, which are compatible.
That's great! Thank you for your feedback!
Thank you for your feedback!