

Full Record View in CX Dashboards
What's on this page
Qtip: This page describes functionality that we intend to release starting September 16, 2026. Qualtrics may, in its sole discretion and without liability, change the timing of any product feature rollout, change the functionality for any in preview or in development product feature, or choose not to release a product feature or functionality for any reason or for no reason.

About Full Record View in CX Dashboards
There’s a setting that lets users in your dashboard click on a row in the response ticker or record table, and then see the full response. You can choose to show every detail of the attached record, or you can customize what is displayed, leaving out information that is irrelevant or of a sensitive nature.
Dashboard viewers can also use this view to see related tickets, meaning users don’t have to navigate away from the dashboard to find their tickets.
Compatibility
You can only display full records in the following dashboard types:
This feature can only be used with the following widgets:
This feature is not available on CX ticket reporting pages.
Setting Up Full Response View
Create or edit one of the compatible widgets:
Go to Display.

Enable Show full record on click / Enable full record view.
Qtip: This switch varies in name between the response ticker and the record table, but it works the same way.
To customize further, click Edit full record view.
Click Add and choose between:

- Data field: Add a single data field.
- 1 column section: Add an entire section full of fields, with a header.
- 2 column section: Add 2 new sections, side-by-side.
Qtip: The fields you can display are pulled from the Dashboard Data. When selecting fields for full record view, you will see every field mapped in your dashboard. If you want to report on a particular field, make sure it is mapped to the dashboard.
If you chose a single data field, you can write a label, then select the specific dashboard field you want to add.
If you chose to add a section (or sections), start off by naming the section. This will appear as a header.

Add the labels and field mappings for metadata in this section.
Use the dots next to a field or section to drag and drop them into a different order.

Qtip: The screenshot above shows what a 2 column section looks like. Note how each column has its own name and fields. If you delete one of these sections, the remaining column stretches to fit the screen like a 1 column section.
Click Add data field to add another field to the section.
When you’re finished, click Save.
Using the Interaction Viewer
Once enabled, dashboard viewers can click a row of the widget to learn more about that interaction and the tickets connected to it. This works when the dashboard is in view-only mode.

Qtip: For response tickers, click the 3 dots, then View interactions.
Record Tab
When a dashboard viewer clicks a response they’re interested in (usually a row on the widget), they’ll see more details about that response. Some information may be deliberately excluded if it is sensitive or irrelevant.
Record view can vary based on how the dashboard editor set it up. Here is an example:

Tickets Tab
In the Tickets tab, dashboard users can perform all the same functions they do on the tickets page, such as changing ticket status, reassignment, sending emails on tickets, and more. The only difference is that this tab is filtered to only show tickets assigned to the user that were generated by this survey response.

Click the ticket key to open the ticket in another tab of your browser, where you can take action on it:
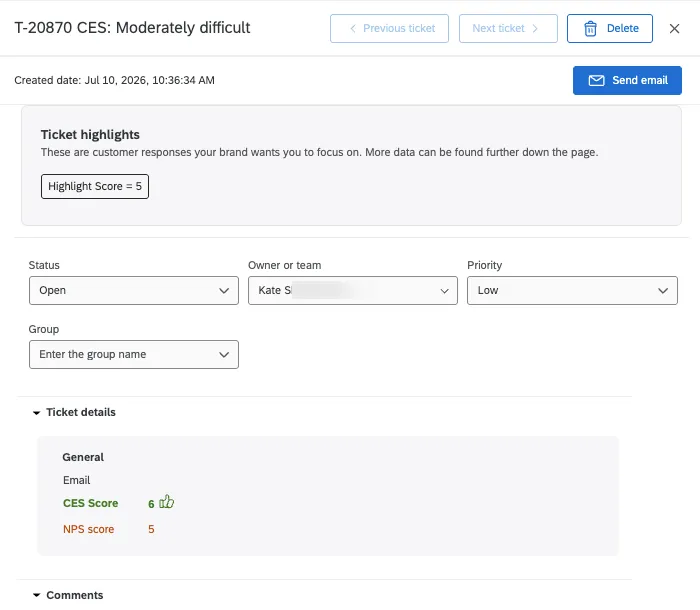
Functions Include:
Qtip: Instead of using a separate “Emails” tab in the full record view, you merely open the ticket and send follow up emails as you would normally on the Tickets page.
That's great! Thank you for your feedback!
Thank you for your feedback!