
Pivot Table
What's on this page
About Pivot Tables
Creating a pivot table allows you to compare variables to each other in a heavily customizable, cross tab-like table. The cell values for the table can be changed to display the data in many different ways.
Qtip: You may have up to 750 cards in your workspace. If you reach this limit, an error will appear when you try to create a new card, warning you that your oldest cards will be deleted.
Selecting Variables for Pivot Table Cards
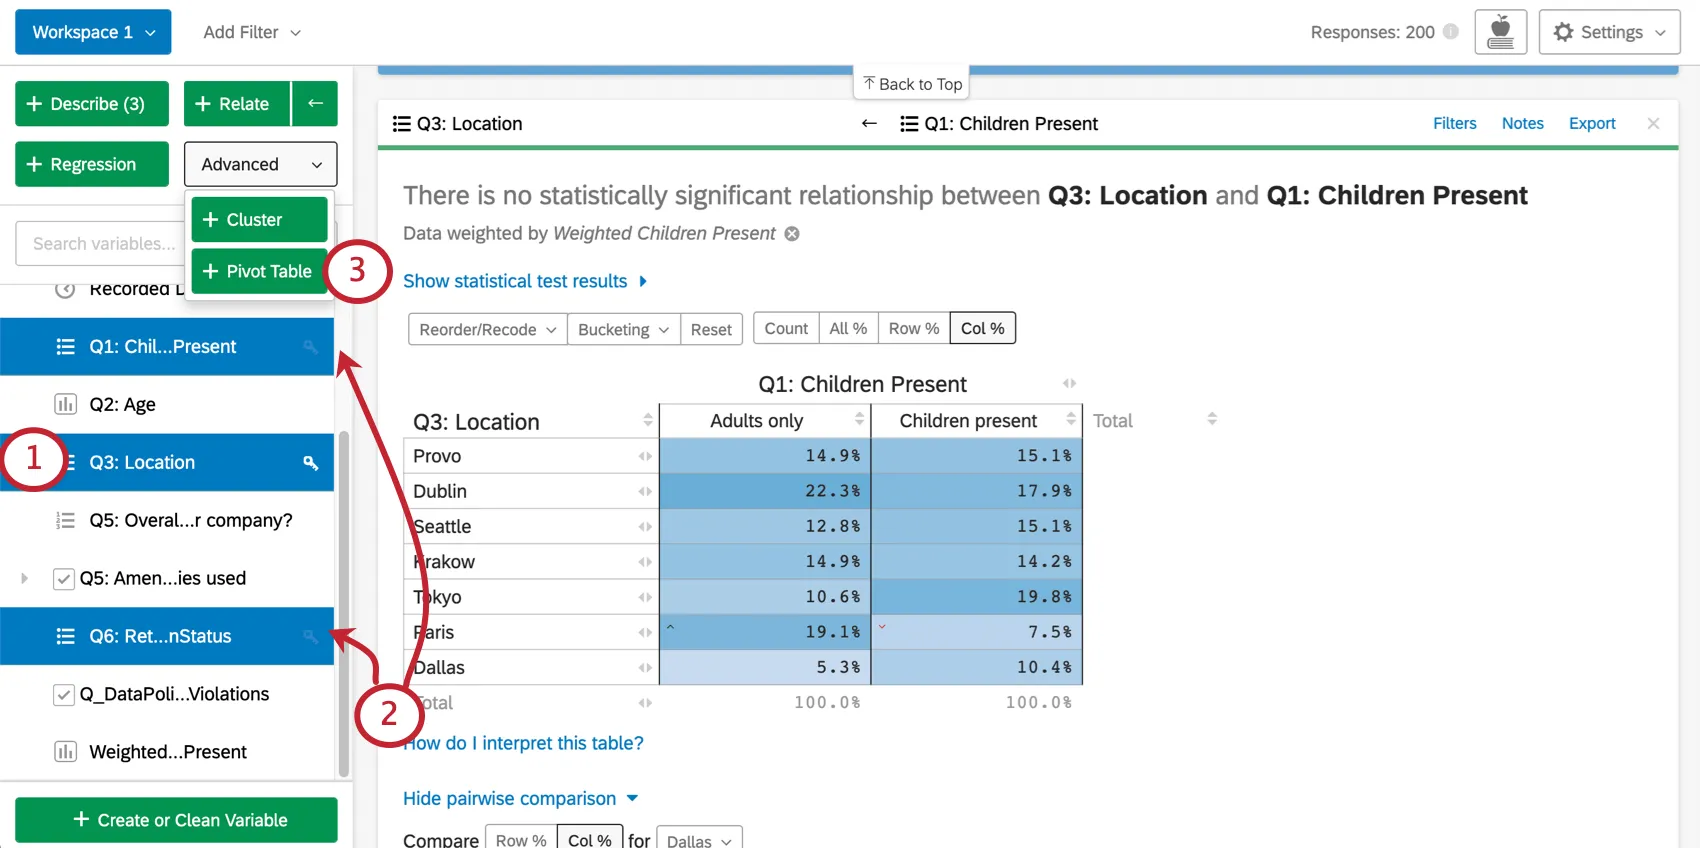
Qtip: It’s easy to change your table after it has been created, so don’t worry about getting everything right when selecting variables. Just pick the variables you want to include, create the pivot table, then edit it to your satisfaction.
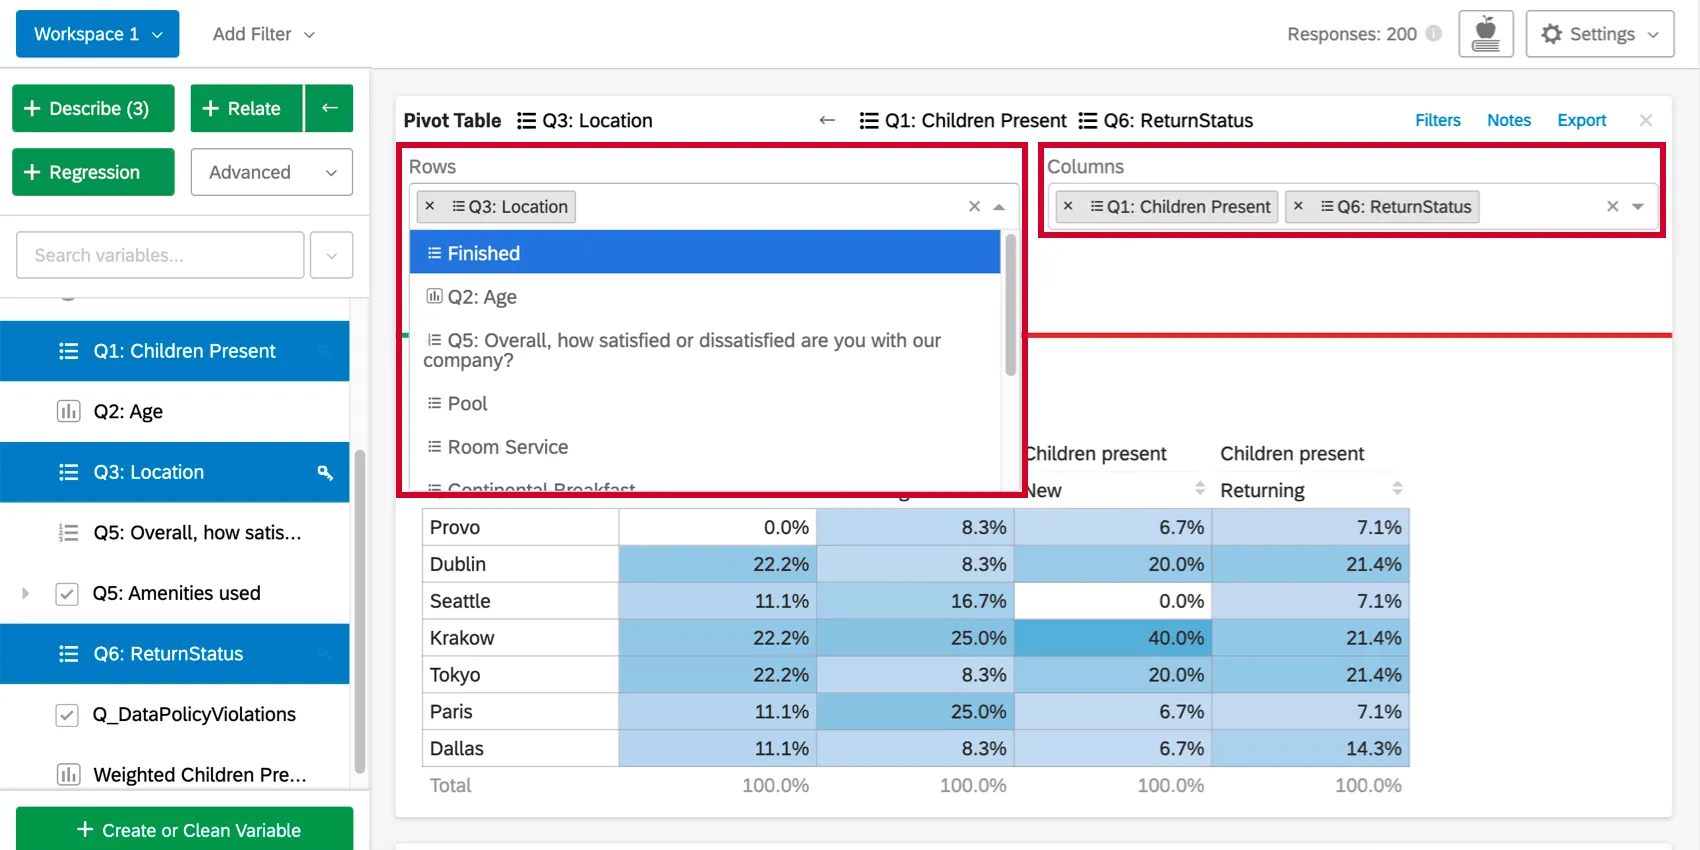
Adding Rows and Columns
Once you’ve created the pivot table, clicking the Rows or Columns dropdown above the table will allow you to add more variables to the rows or columns of the table. Each additional variable added will break out the table so that there is a row or column for each combination of variable values.
Changing the Cell Values
By default, the cells of the pivot table card will display the column percentages (the percentage of each column that falls into each row value). This value can be changed by clicking the the dropdown under Values, or by initially including a numbers variable. The first set of options for cell values use the data for the selected rows and columns.
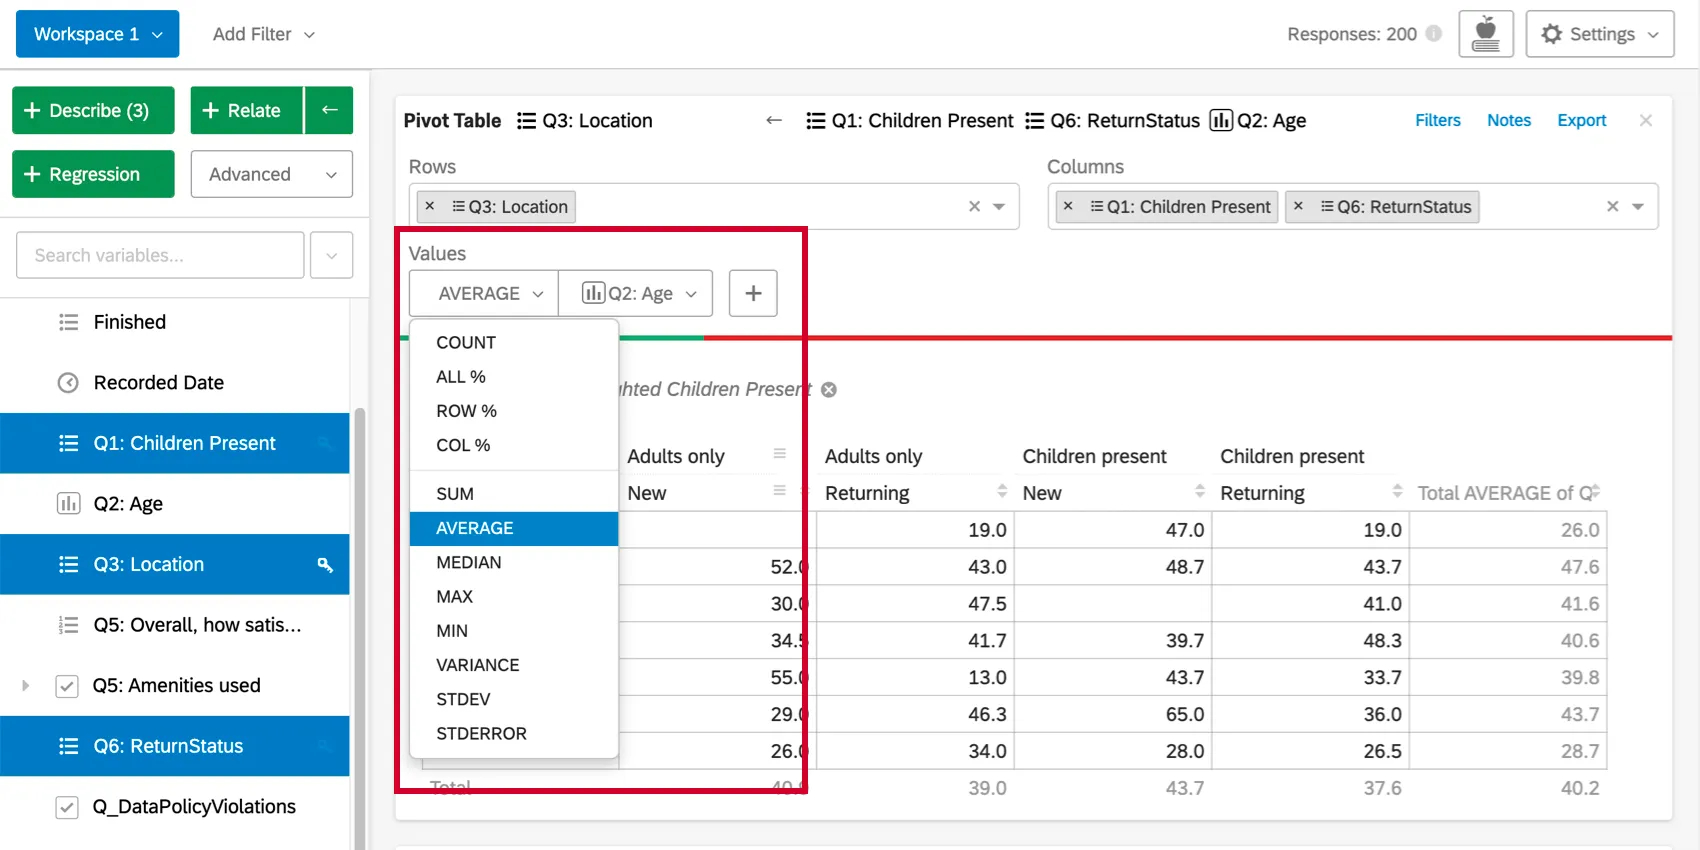
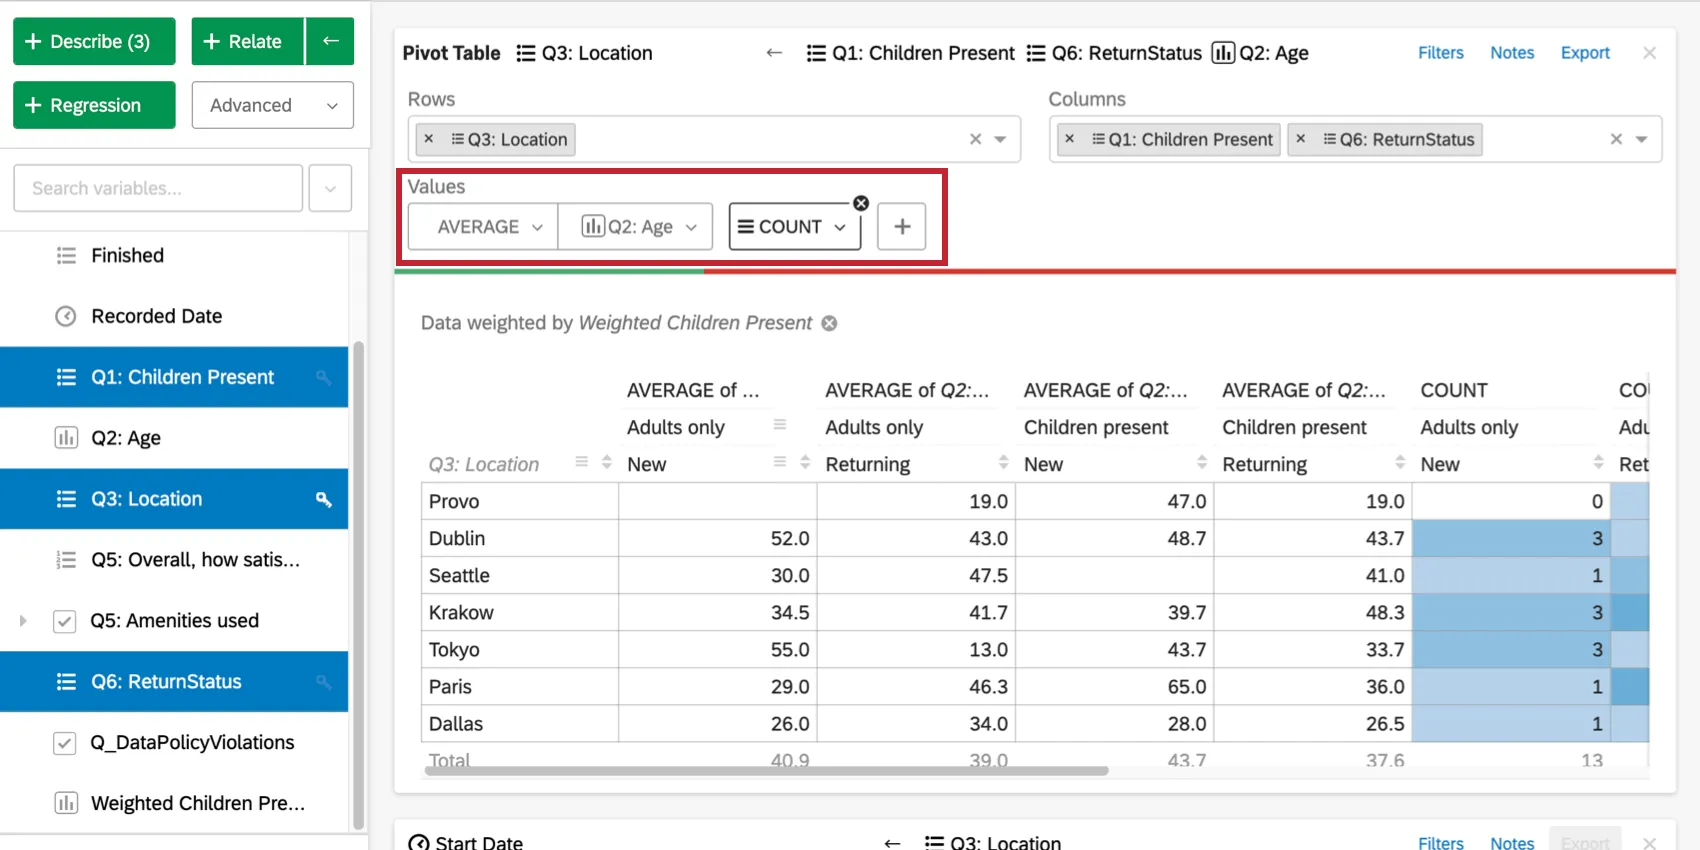
The second set of options (sum, average, median, max, min, variance, and standard deviation) allows you to use statistical values from other variables in the dataset in the table cells. For example, you may want to find the average income of any respondent who falls into a given cell.
You can also click the plus sign ( + ) to add additional data to your table. Hover over a value to re-order it or remove it.
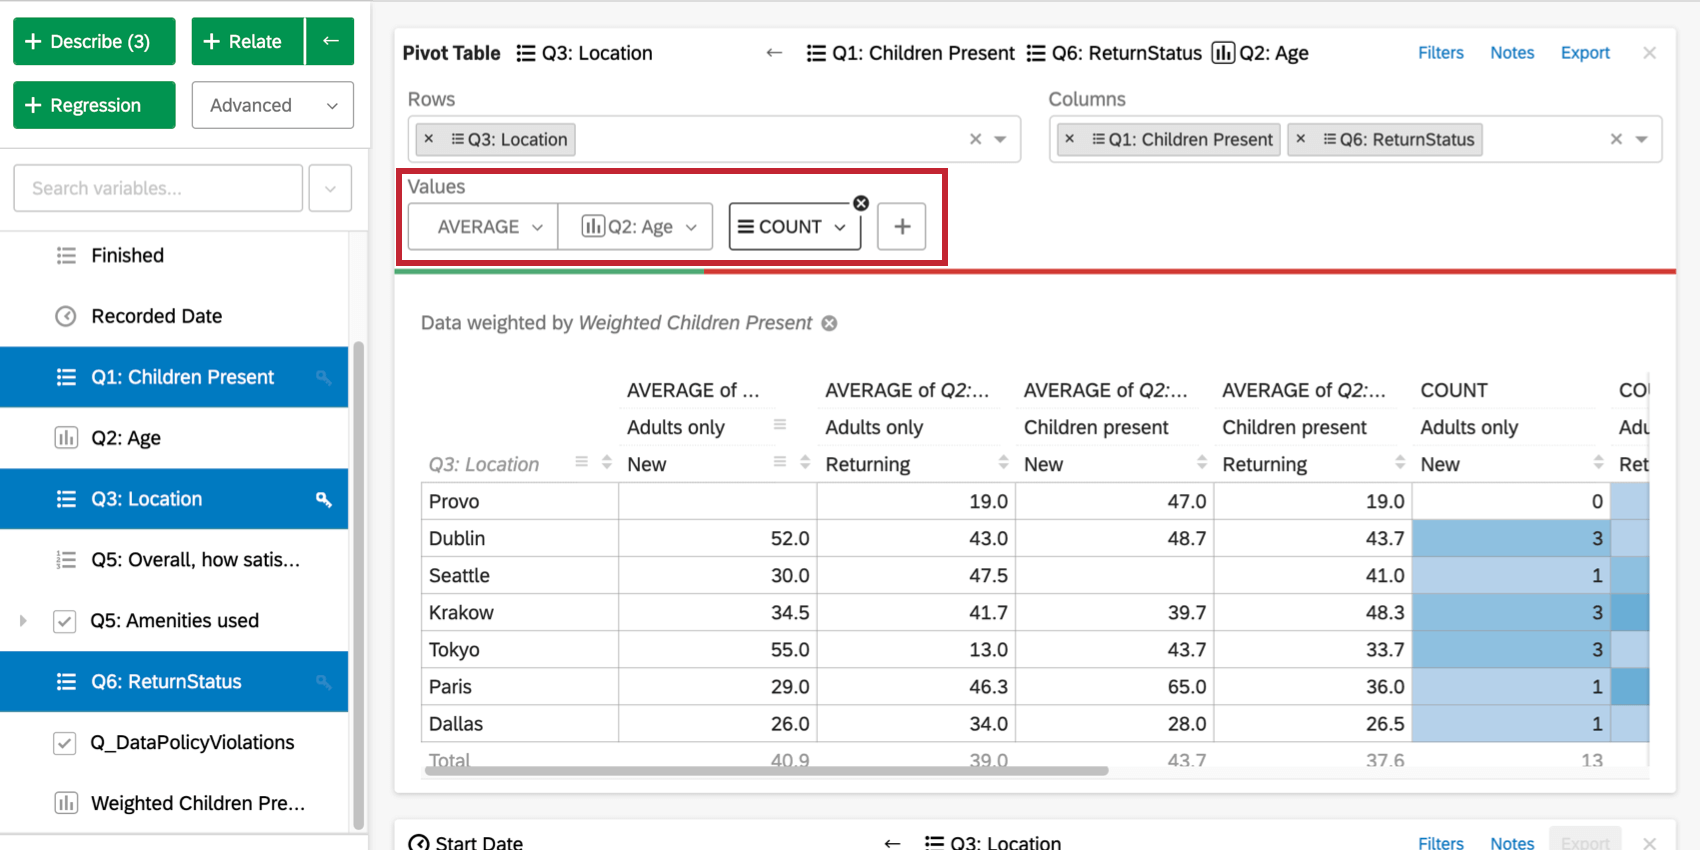
Stats iQ Pivot Table vs. Regular Crosstabs
Pivot tables in Stats iQ differ from traditional crosstabs, such as the ones created in the Crosstabs section of Data & Analysis.
- Unlike a traditional “banner and stub” cross tab, when multiple variables are added to the columns on a Stats iQ pivot table, there will be a column created for each combination of the values for all of the column variables. In a traditional cross tab, a column is created for each variable value individually, such that one variable’s values are to the side of the other’s and not nested underneath them.
- In Stats iQ, you have the ability to use values from other (non-row or column) variables in the cells of the table. This creates the potential for a wider range of information to be displayed.
Statistical Tests Within Pivot Tables
The significance arrows for each cell in the pivot table are determined in the same way as they are in the table created when relating two categorical variables. Specifically, the arrows are determined by the adjusted residual of each cell. Stats iQ shows up to three arrows, depending on the p-value calculated from the adjusted residual. A different number of arrows will be shown depending on the degree of significance of the result. Specifically, one arrow is shown if the p-value is less than alpha (?) where ? = (1 – Confidence Level) (the confidence level is set under analysis settings), two arrows if the p-value is less than ?/5, and three arrows if the p-value is less than ?/50.
For example, if your confidence level was set to 95%:
- p-value <= .05: one arrow
- p-value <= .01: two arrows
- p-value <= .001: three arrows
FAQs
How do I create a new Stats iQ variable?
How do I create a new Stats iQ variable?
What are the options for analyzing my data in Stats iQ?
What are the options for analyzing my data in Stats iQ?
- Describe: Selecting a variable from the list and then clicking Describe will give you a visualization of the data contained in that variable. Use this when you would like to see how the data for a certain variable is distributed.
- Relate: Selecting two variables and then clicking Relate will run a statistical analysis of the relation between the two variables. Use this when you would like to know how strongly two variables are correlated.
- Pivot Table: Selecting two or more variables and clicking Pivot Table will create a table that displays the values of the variables as rows and columns. The cells can be set to display a variety of different information including column and row percentage, Sum, and Variance. Use this when you would like to compare the overlap between specific values of a set of variables.
- Regression: Selecting two variables and clicking Regression will give the mathematical relationship between the variables. Use this when you would like to predict values for one variable based off of the values of another.
- Cluster: Selecting two to ten demographic variables and clicking Cluster will display groupings of traits most likely to occur together, thus revealing the population segments captured in your data.
I don't know what this statistical term means. Can you tell me?
I don't know what this statistical term means. Can you tell me?
- Statistical tests: ANOVA, T-test, and Chi-squared are all statistical test that Stats iQ performs to test whether or not the relationship between two variables is significant. These tests are used to generate a P-Value.
- P-Value: This value represents the probability that the observed results would be seen if no correlation between the variables exists. A lower P-Value means more correlated data.
- Effect Size: The effect size is a measure of how large the correlation between two variables is. This is measured in different ways depending on the type of the statistical test performed. Examples are Cohen’s d, Pearson’s r, and Cramer’s v. The larger the effect size value, the more correlated the variables are.
How do I filter the data that appears in Stats iQ?
How do I filter the data that appears in Stats iQ?
How do I get my new responses to show up in Stats iQ?
How do I get my new responses to show up in Stats iQ?
How are analysis cards ordered in my Stats iQ Workspace?
How are analysis cards ordered in my Stats iQ Workspace?
What’s Stats iQ? / Where’s Statwing?
What’s Stats iQ? / Where’s Statwing?
What do I do if my data isn't loading properly?
What do I do if my data isn't loading properly?
That's great! Thank you for your feedback!
Thank you for your feedback!