
Response Weighting
What's on this page
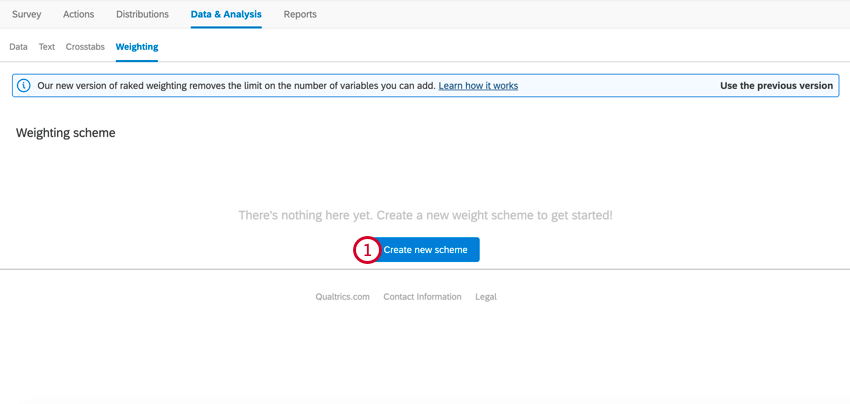
About Response Weighting
Imagine that you have a product used equally as often by men and women. But when your customer feedback on this product returns, 70% of your respondents were female, and 30% were male. If you were to present these results as collected, they would skew in favor of the women’s answers, even though they are only 50% of the target demographic.
Response weighting allows you to change the weights of variable fields so the data in your Reports tab will reflect targeted demographics. Wave based weighting can also be used to apply unique weights over various time periods or specific categories, which can be useful for long-running programs that require multiple weighting configurations.
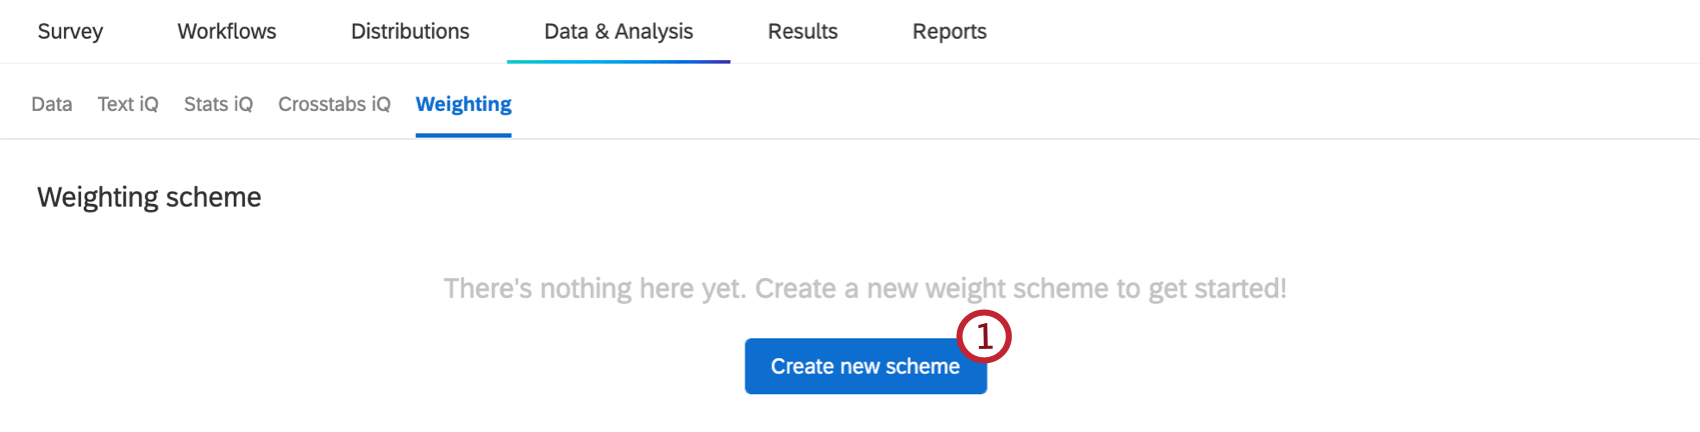
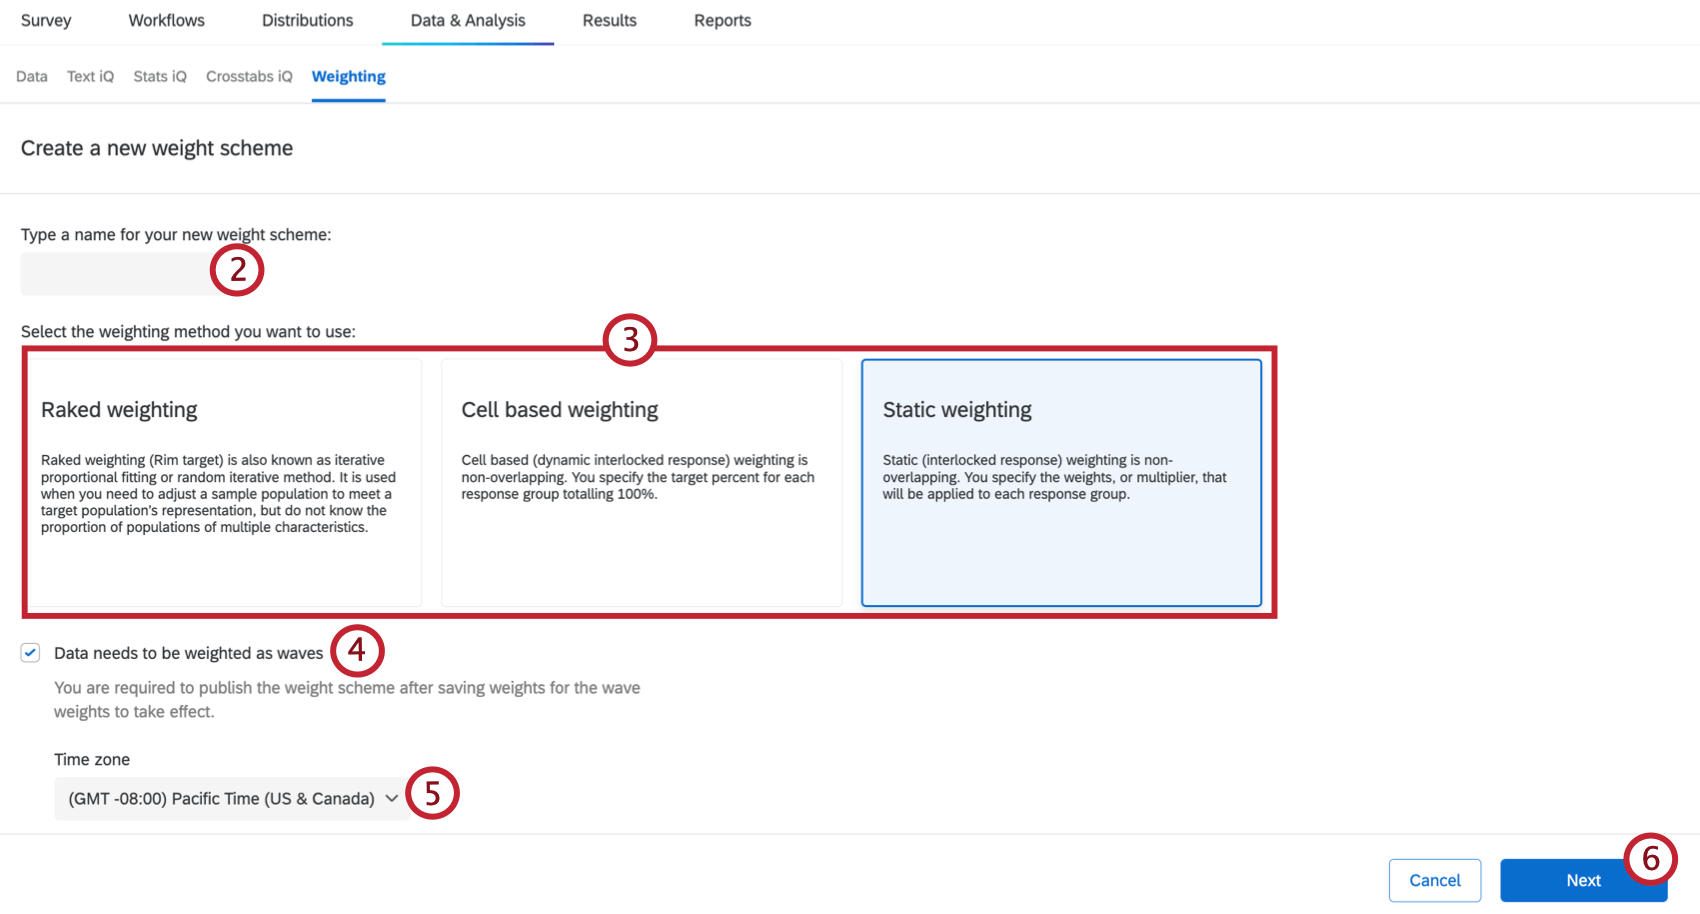
To get started, go to the Data & Analysis tab of your survey and select Weighting.
Adding Weights
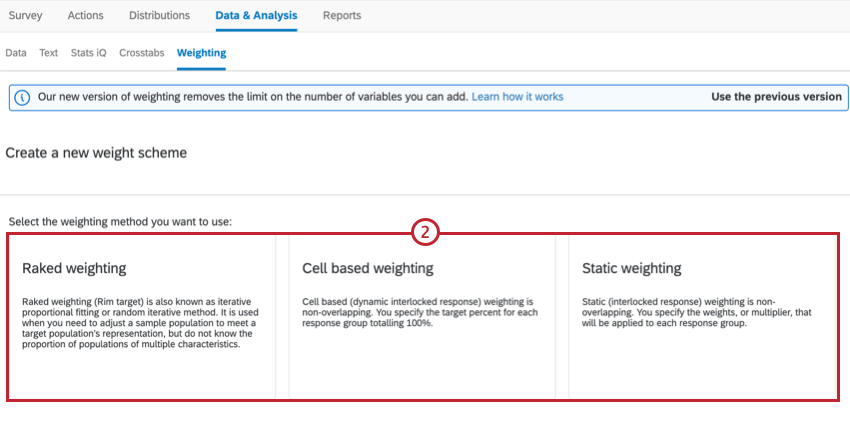
Your options include:
- Raked weighting
- Cell based weighting
- Static weighting Qtip: Check out the section on Raked vs. Interlocked Weighting for more information about these weighting types.

Qtip: If you want to use waved weighting, see Wave Based Weighting.
Qtip: This weighting feature has been updated to display 6 digits of precision. This does not alter any existing percentages or weight calculations.
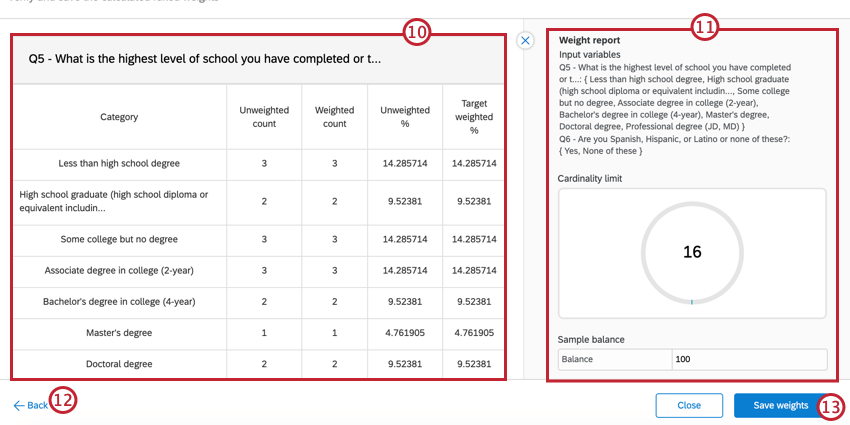
Qtip: See Cardinality for more information, including limits.
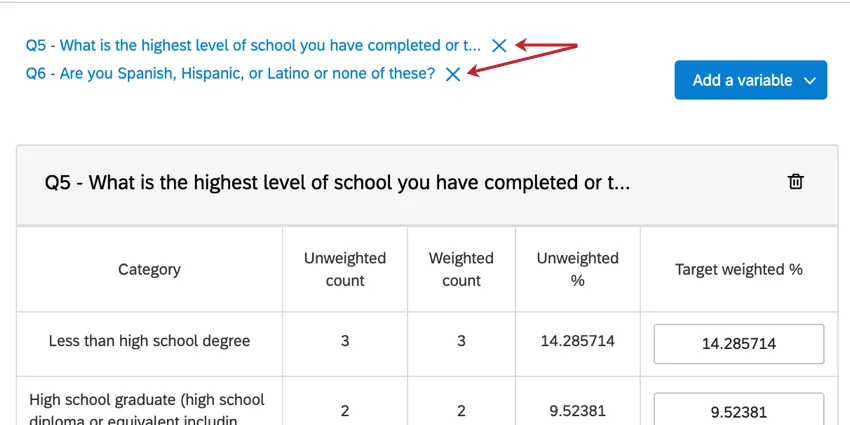
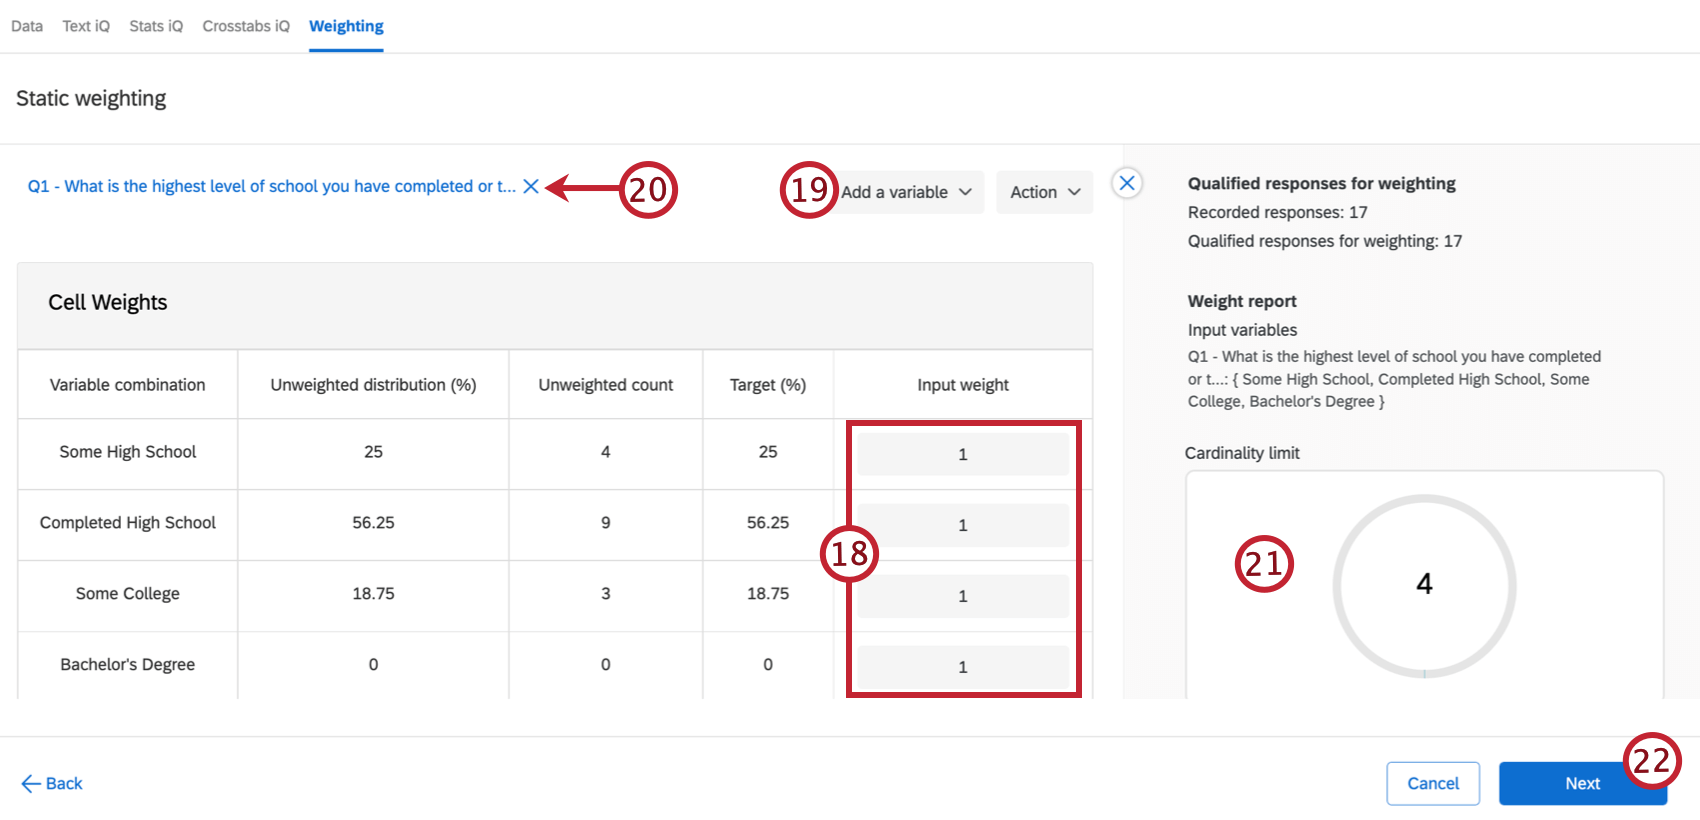
Qtip: You can also click the X next to the variable name above your weighting scheme to remove the variable.

Qtip: See Cardinality Limit.
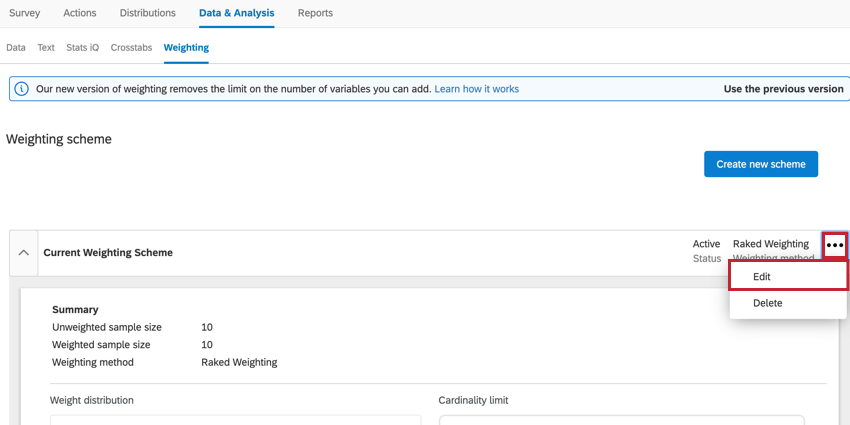
Qtip: After saving your weights, you can edit them by clicking the three dots and then Edit.

Weighting Multiple Variables: Raked vs. Interlocked
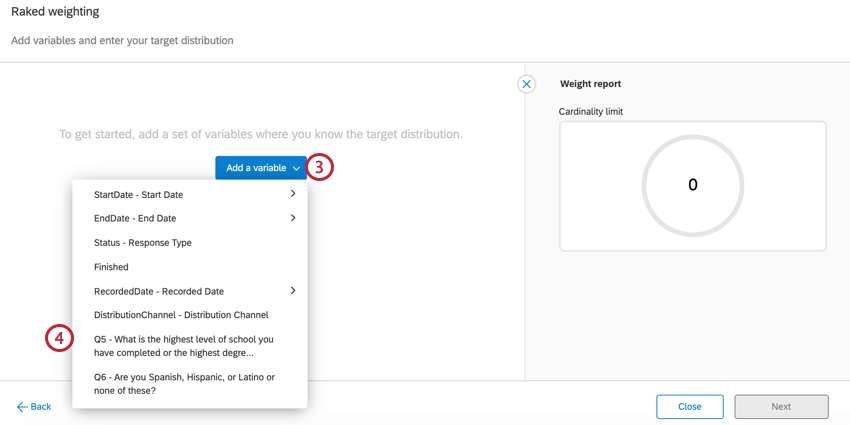
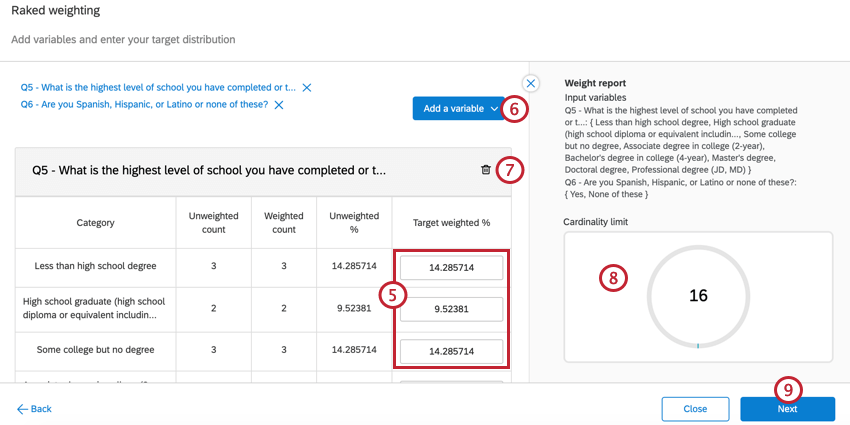
Raked Weighting
Raked Weighting (also known as Rim target) takes a simplistic approach to multiple variables. You can add up to two variables at a time, and each one is configured separately. This type of weighting is best if you’re looking at non-overlapping variables.
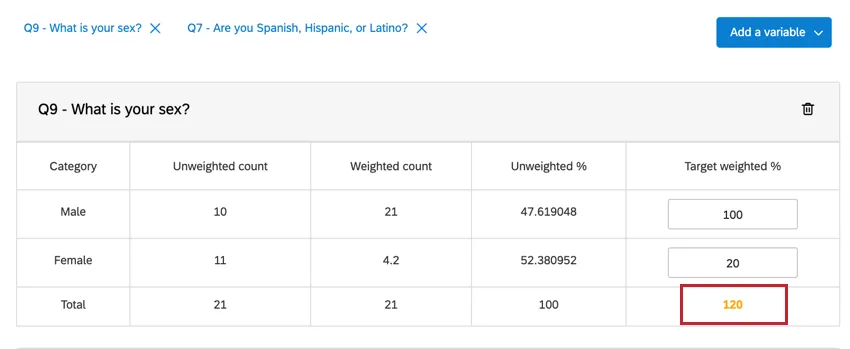
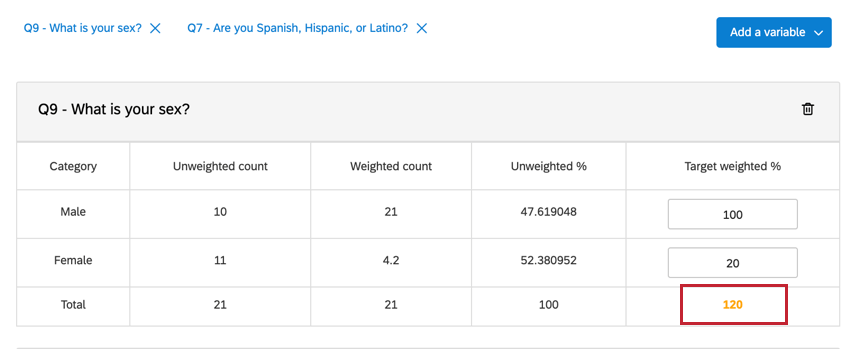
For example, if you wish to weight both Gender and Spanish/Hispanic/Latino identity, you determine your desired percentages of each Gender, then of each identity. The software will then calculate the weights of overlaps (for example, Hispanic Women or Latino Men) for you.
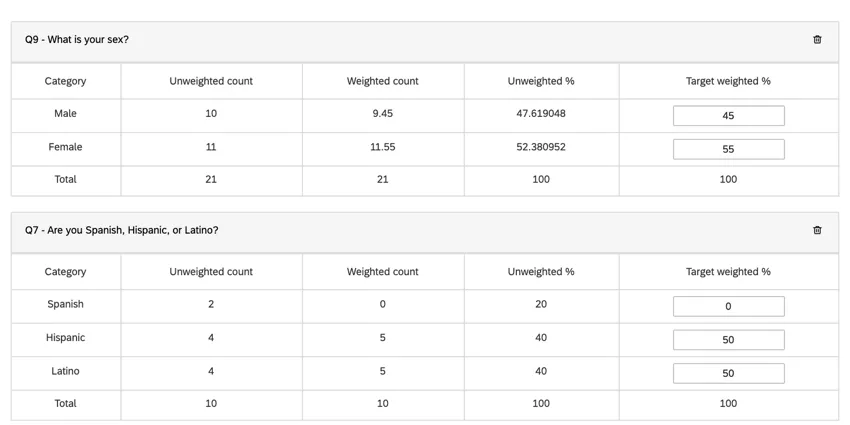
Qtip: The value under Calculated Weight will change to yellow when your weight is invalid. In this example, our total weighted percentage was 120%, exceeding the maximum of 100%.
Interlocked Weighting
Interlocked Weighting is useful if you’re interested in targeting overlapping variables. For example, if you have a larger audience of Spanish Women than Spanish Men, you can adjust these percentages accordingly.
There are two different types of Interlocked weighting schemes:
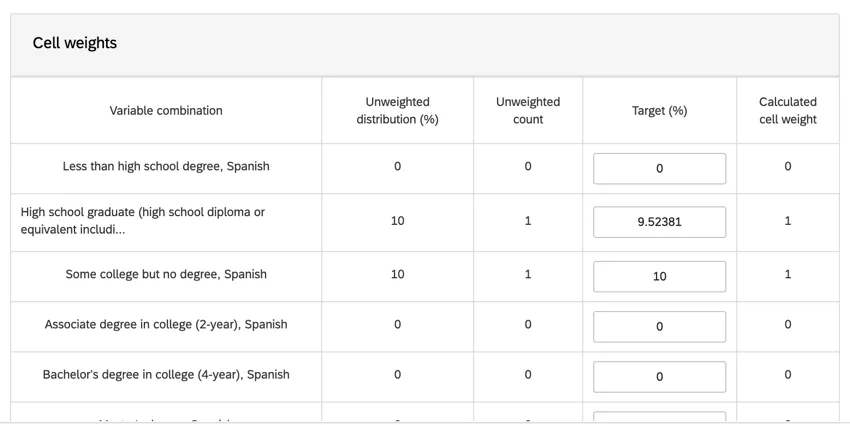
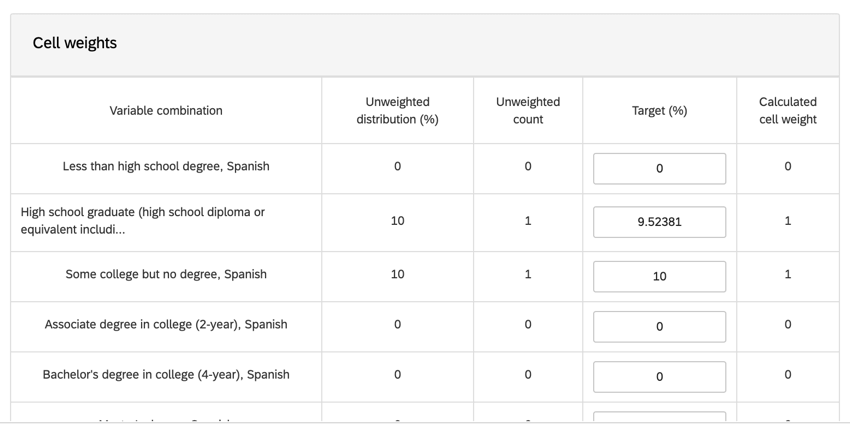
- Cell Based: Also known as dynamic interlocked response. Define values in the Distribution column. These are measured in percentages adding up to 100%. When you define these values, the system automatically defines the Weight column for you. Qtip: If you are not as familiar with weights, we recommend using this option.
- Static: Also known as interlocked response. Edit the values in the Weight column. These numbers are what the data in a given category will be multiplied by once collected. 1 means no weight is applied.
Wave Based Weighting
Wave based weighting allows you to apply unique weights over various time periods or specific categories.
Qtip: For raked and cell-based weighting, the platform will recalculate the weights for unlocked waves if the number of new, unweighted responses exceeds 5%. This could result in your dataset being rebuilt daily. While data is rebuilding, it may be unavailable.
- Raked weighting
- Cell based weighting
- Static weighting
Qtip: See Raked vs. Interlocked Weighting for more information about these weighting types.
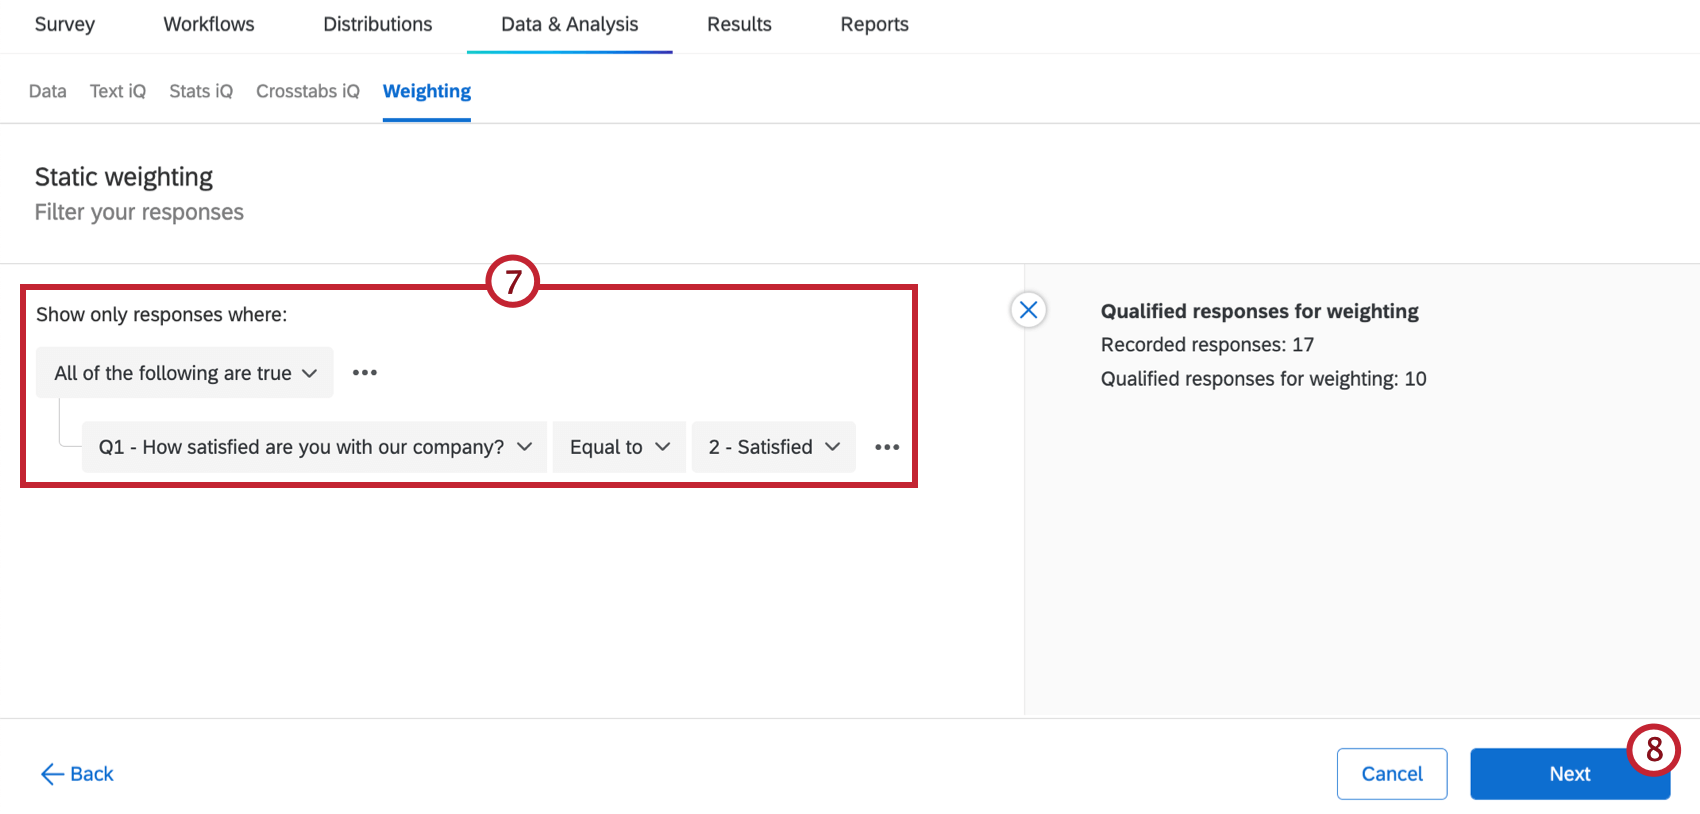
Qtip: If you want to weight all your responses, do not add a filter.
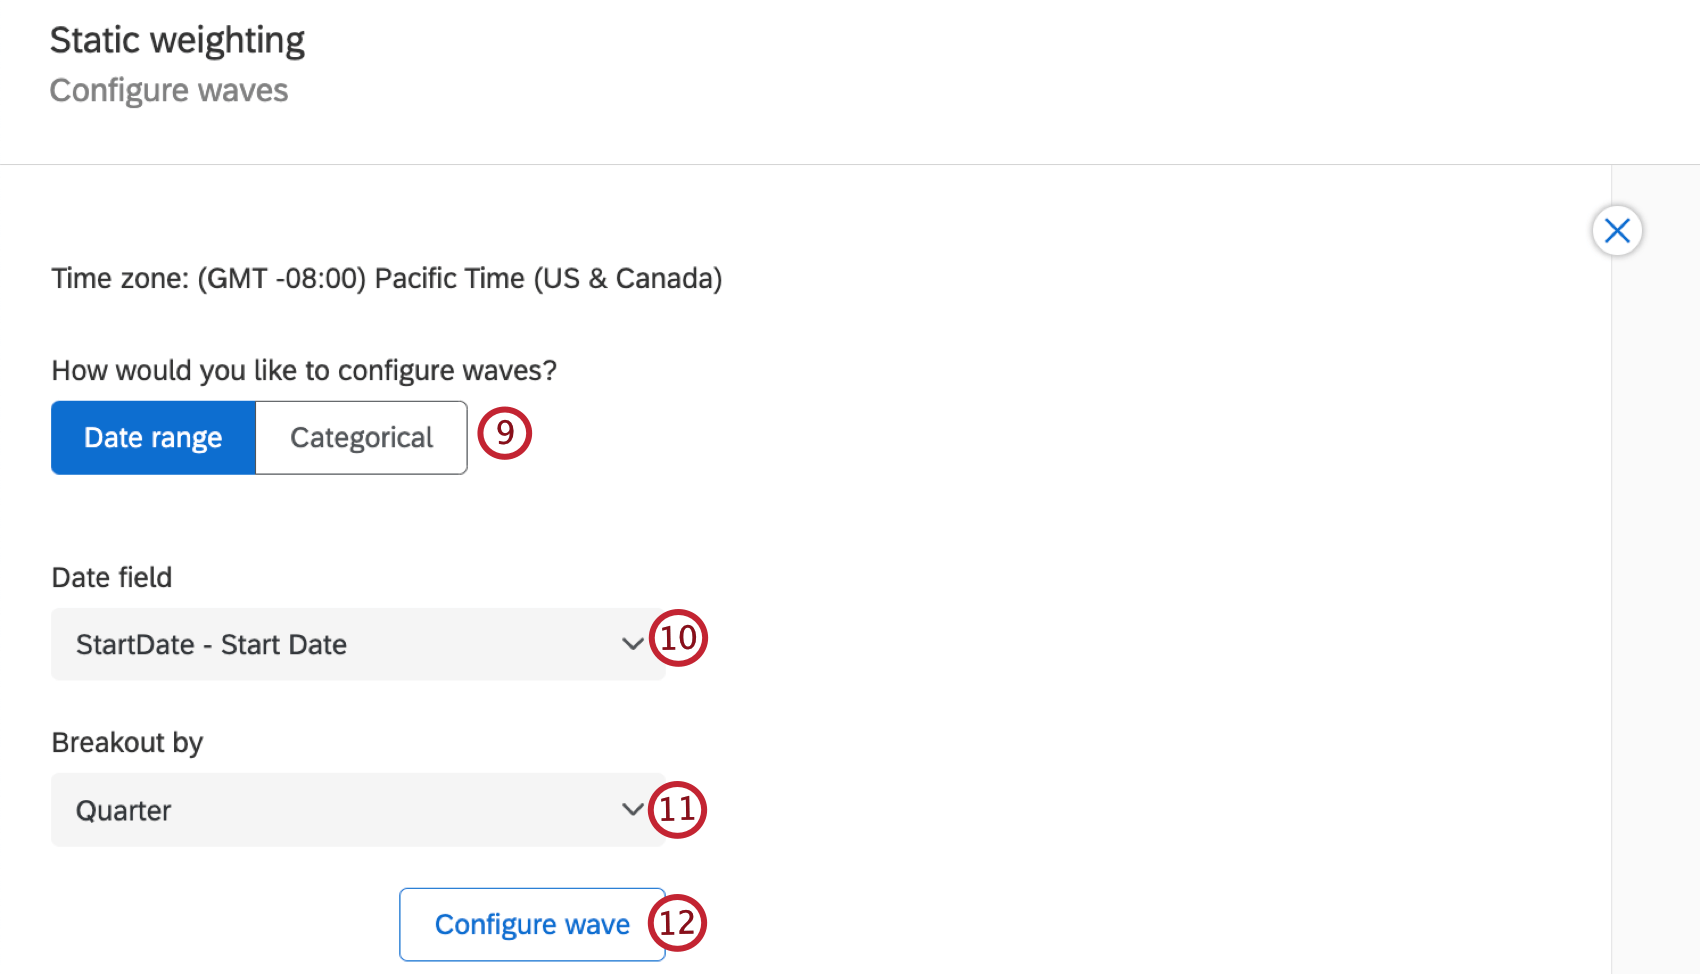
- Date range: Waves are defined using a date field, such as Start Date or End Date, and waves are broken out by different time periods.
- Categorical: Waves are created based on non-date fields, such as survey questions or survey metadata.

Attention: Dates within a field group won’t appear in the date field dropdown. These fields must be mapped as dates outside of a field group for them to appear.
Qtip: For categorical waves, all fields types are supported except for Geometry, Date Time, Enumberable Value or Enumerable Value Set.
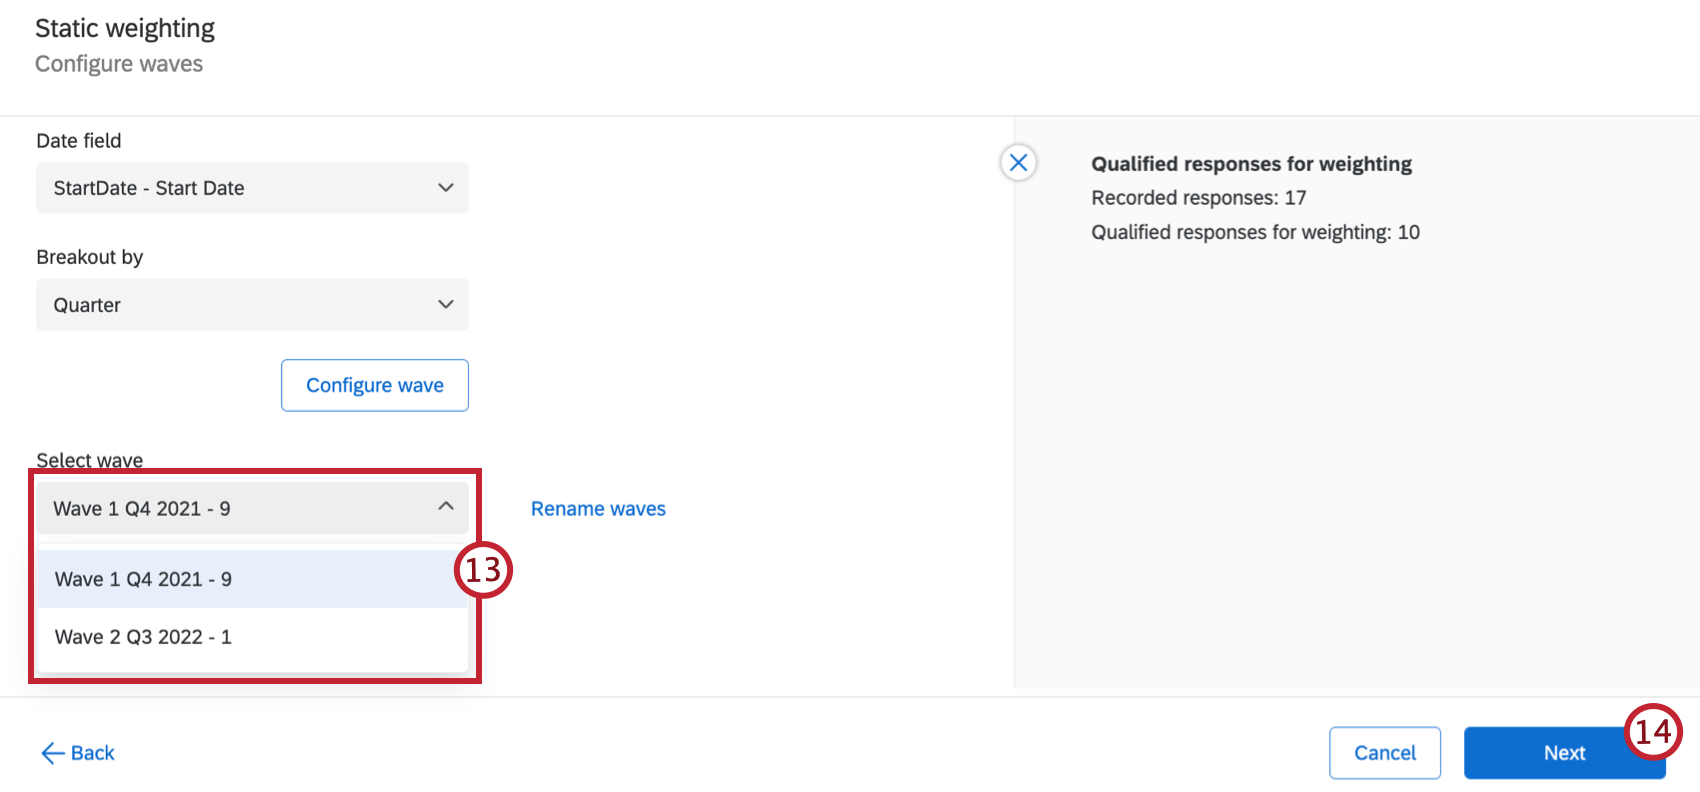
Qtip: Click Rename waves if you would like to give your waves different names.
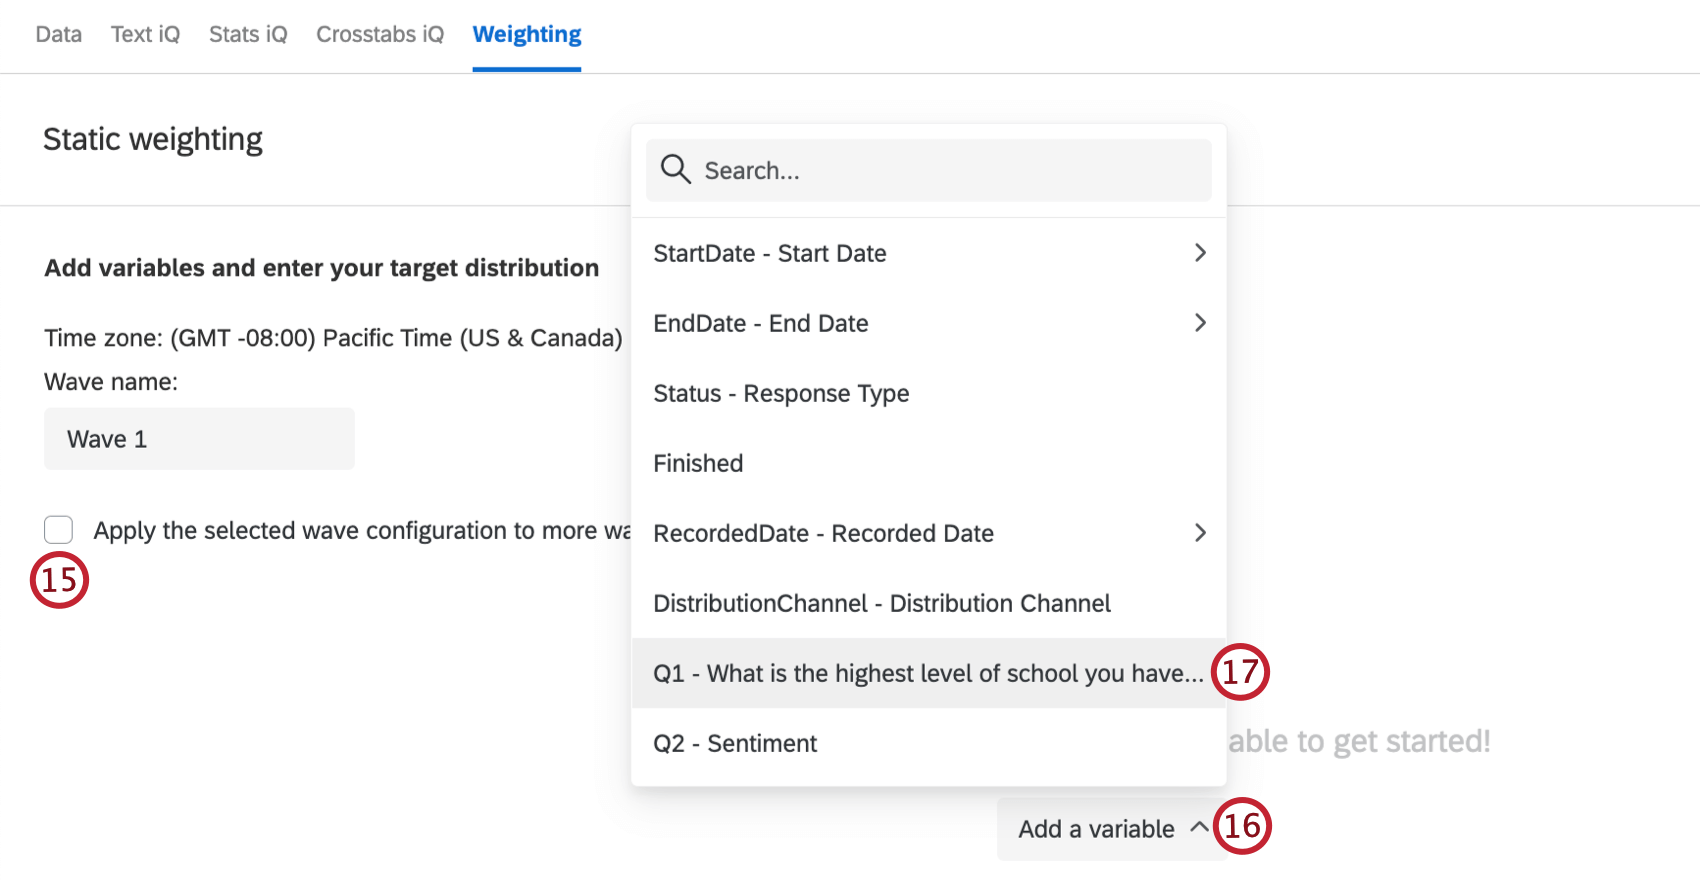
Qtip: If desired, you can rename your wave by typing a new name into the Wave name text box.
Qtip: You can also import weights using a CSV or TSV, which is useful If you are adjusting the weighting of many variables. See Exporting & Importing Weights for more information.
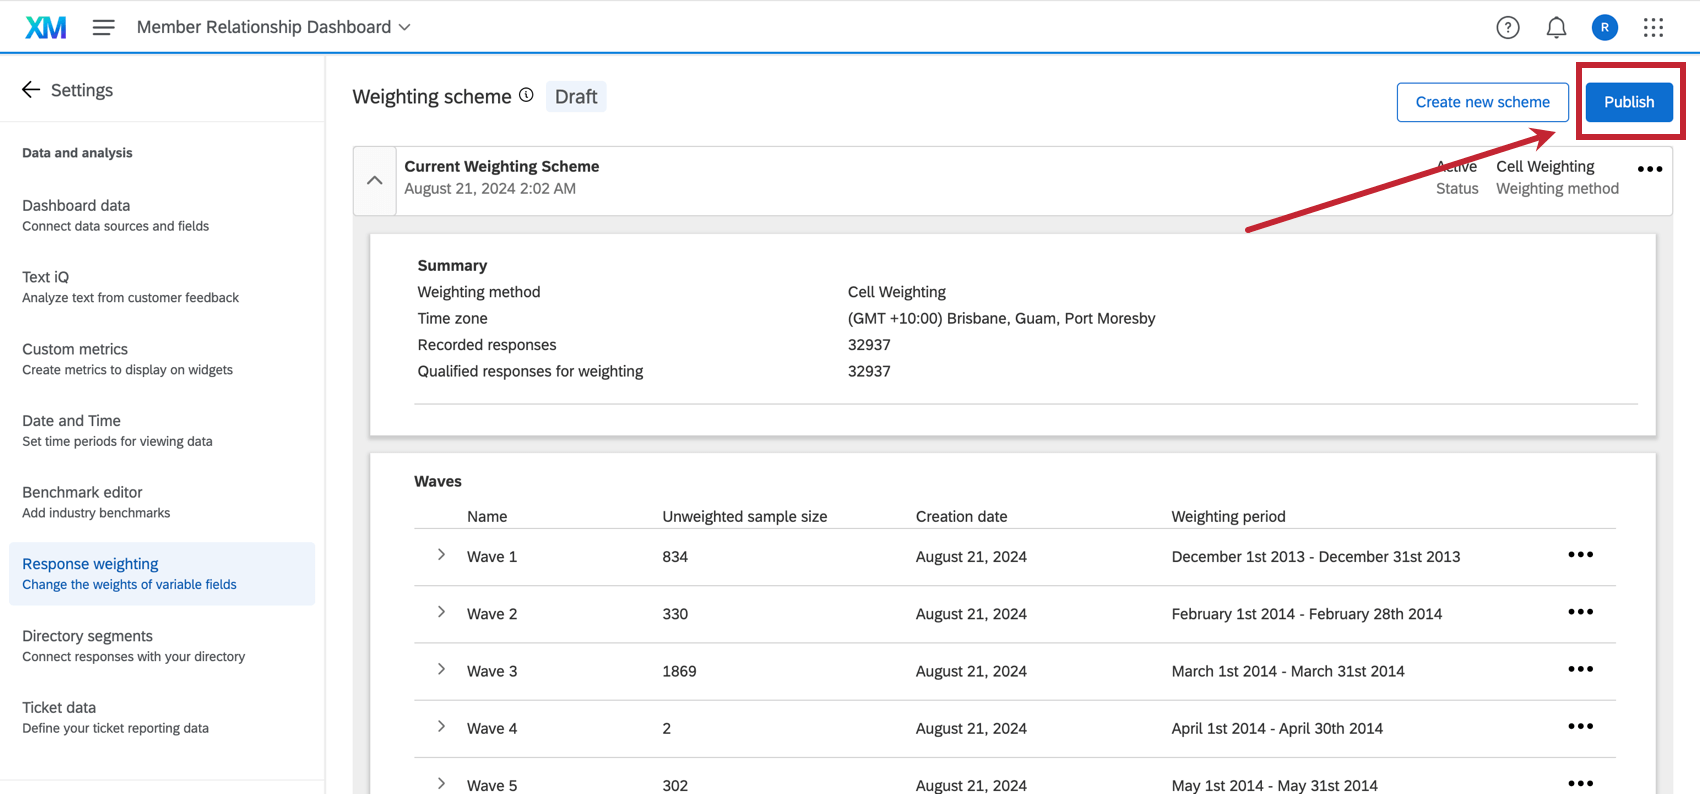
Attention: If you’re creating weights in CX Dashboards, you need to Publish your weighting scheme after you save it.

Qtip: To edit weights that have been saved, click the three horizontal dots in the top-right corner for non-waved schemes or next to each wave for waved schemes. Then, select Edit from the menu.
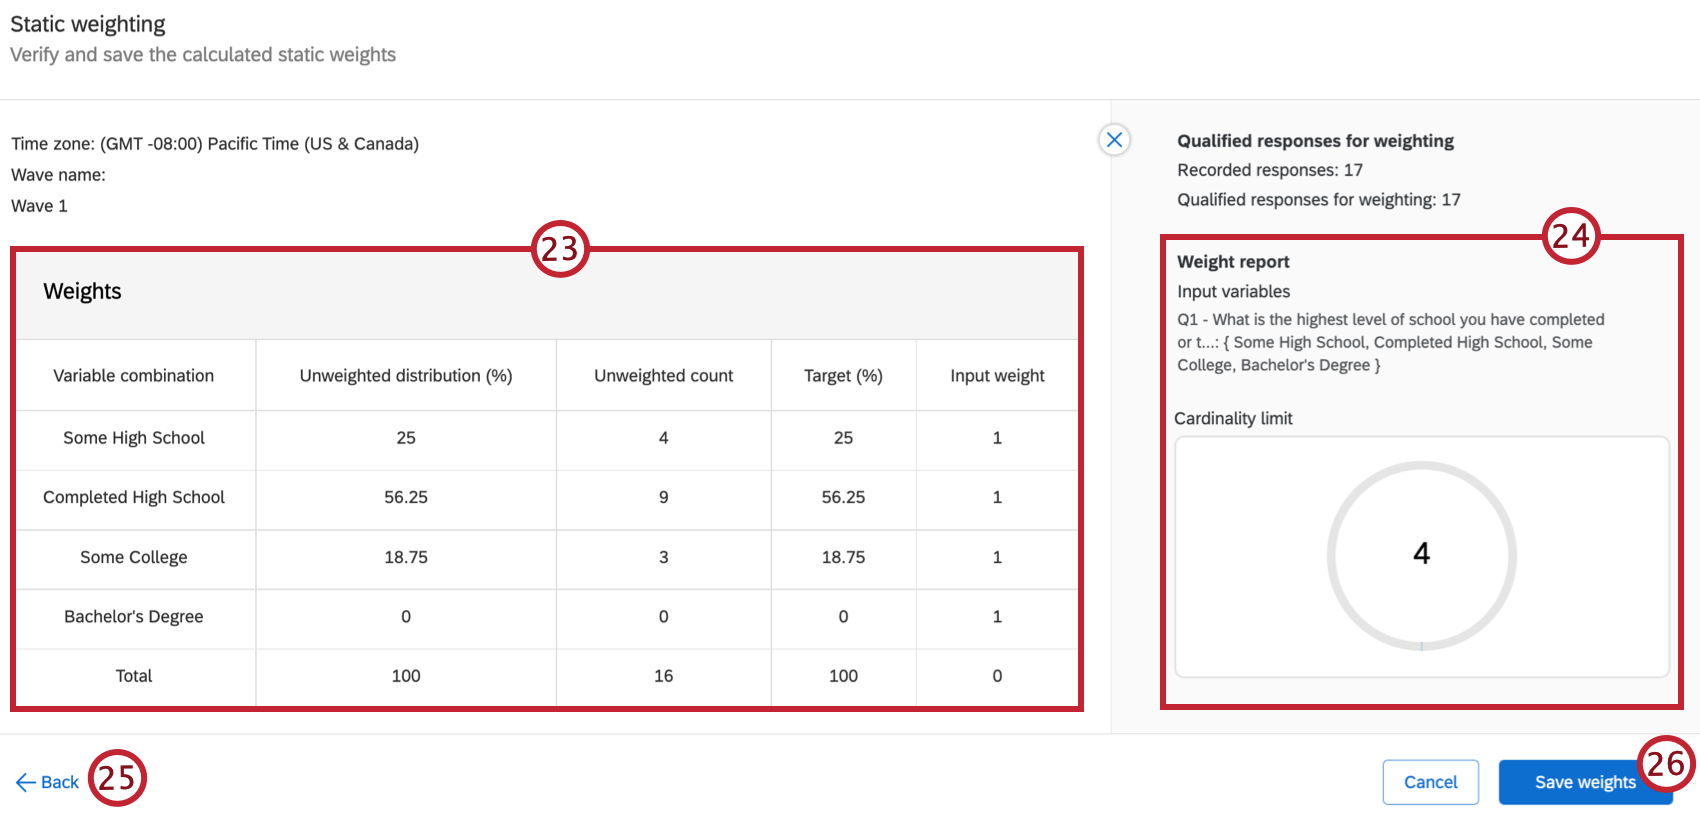
Weight Reports
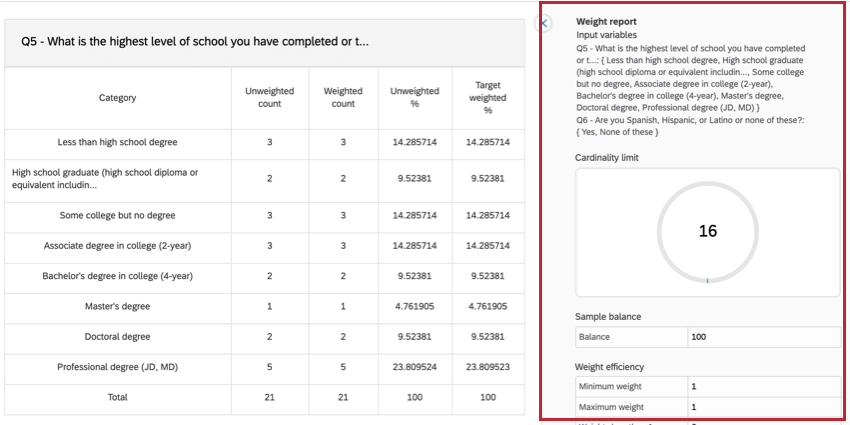
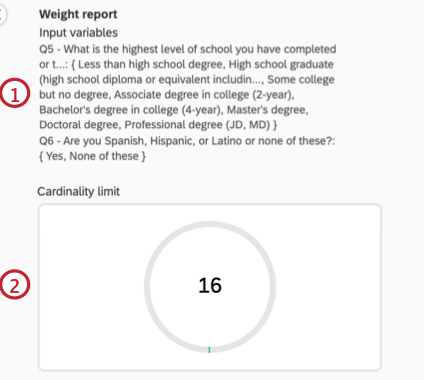
Once you create your weighting scheme, the Weight report will update, showing you key pieces of information about your weighting.
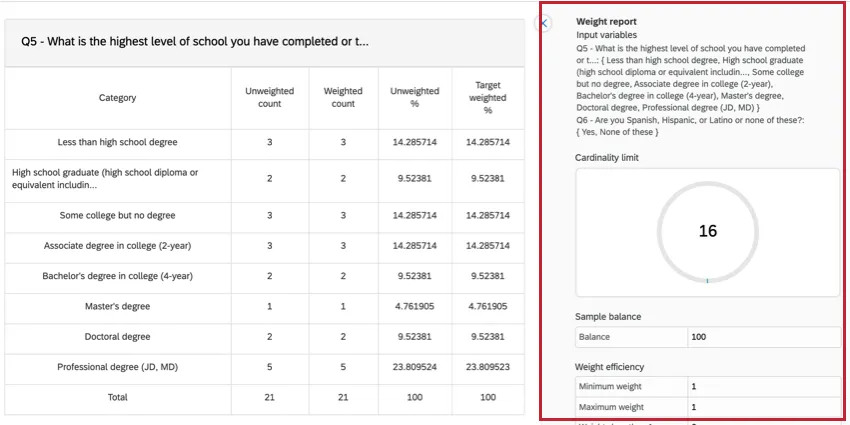
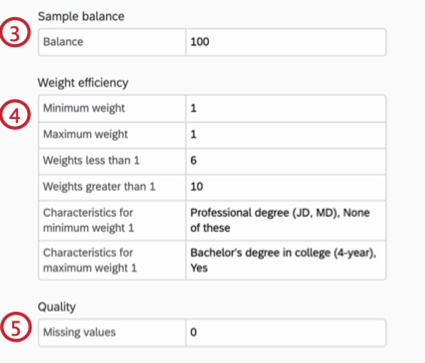
- Minimum weight: The minimum weight. This is represented as a multiplier instead of a percentage out of 100.
- Maximum weight: The maximum weight. This is represented as a multiplier instead of a percentage out of 100.
- Weights less than 1: Of all the characteristics you’re weighting, this is the number of characteristics that have a multiplier less than 1.
- Weights greater than 1: Of all the characteristics you’re weighting, this is the number of characteristics that have a multiplier greater than 1.
- Characteristics for minimum weight X: X varies based on what your minimum weight is. Each combination of variables has a corresponding weight. Characteristics for minimum weight are the variable combinations corresponding to the minimum weight. Example: Let’s say we are weighting education, and we gave “Professional degree (JD, MD)” a targeted weight of 2%, and every other education level a targeted weight above 10%. “Professional degree (JD, MD)” would be our characteristic for minimum weight.

- Characteristics for maximum weight X: X varies based on what your maximum weight is. Each combination of variables has a corresponding weight. Characteristics for maximum weight are the variable combinations corresponding to the maximum weight.
Cardinality
Cardinality refers to the number of unique weight values that will be generated during the weighting process. The goal of a cardinality calculation is to count the unique weights that will actually be generated, not the number that could theoretically exist.
Qtip: The highest possible cardinality that Qualtrics can support is 5000. Once you reach this number, you cannot add more variables to your weighting scheme.
Cardinality can be less than or equal to the number of responses you’ve collected, but never greater.
Adding a variable to your weighting scheme doesn’t always increase the cardinality; collecting data that reflects new combinations does. Again, this is because cardinality is based on actual data as opposed to possible data.
For Interlocked (Cell-Based) Weighting
Interlocked weighting creates a weight for each unique combination of variable categories that exists in your data. Cardinality is thus based on present data collected, not all possible options that could eventually exist.
Example: Let’s say you have an Age Range field with 5 categories and a Region field with 4 possible categories.
- Variables: Age (5 categories) × Region (4 categories) = 20 theoretical options.
- Actual data you collected: 100 responses with only 12 unique combinations present.
- Cardinality: 12 (not 20 or 100).
For Raked (IPF) Weighting
Raked weighting uses Iterative Proportional Fitting (IPF) to assign weights to individual responses based on marginal distributions. As with interlocked, the cardinality is based on the unique combinations of weighting variables present in the actual data. This count cannot exceed the number of responses you collected.
Example: Let’s say you have 8 demographics variables.
- Variable: Between all of the options cross the 8 variables, there are 180,000 theoretical combinations.
- Actual data you collected: 1,608 responses with only 1,347 unique combinations.
- Cardinality: 1,347 (not 180,000 or 1,608).
Exporting & Importing Weights
Attention: You can only export weights for interlocked weighting schemes.
Qtip: Exporting weights is not possible for cell based weighting with data weighted as waves.
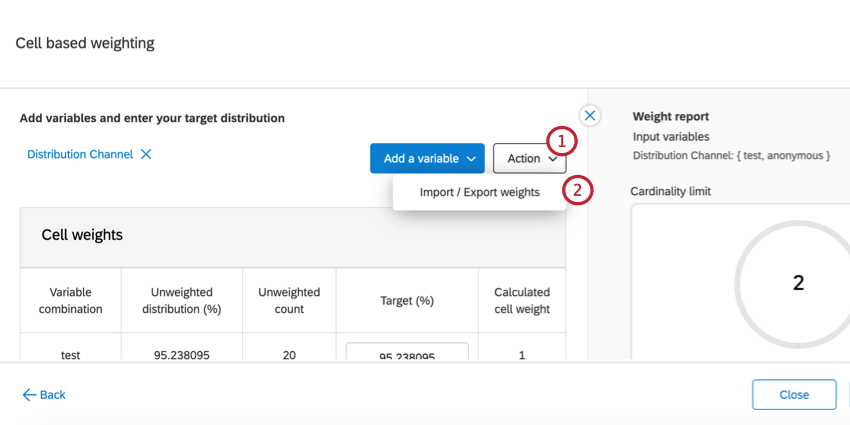
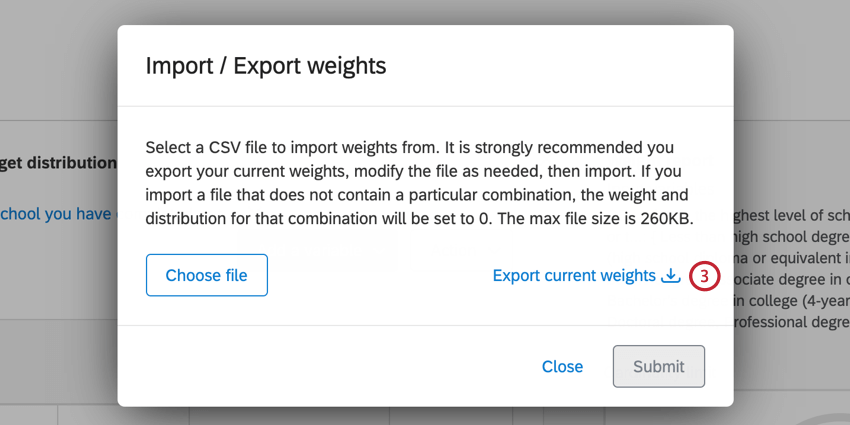
After creating your weighting scheme, you can export the weights so you can easily use them again in the future. This section will go over importing and exporting weighting schemes.
Exporting Weights
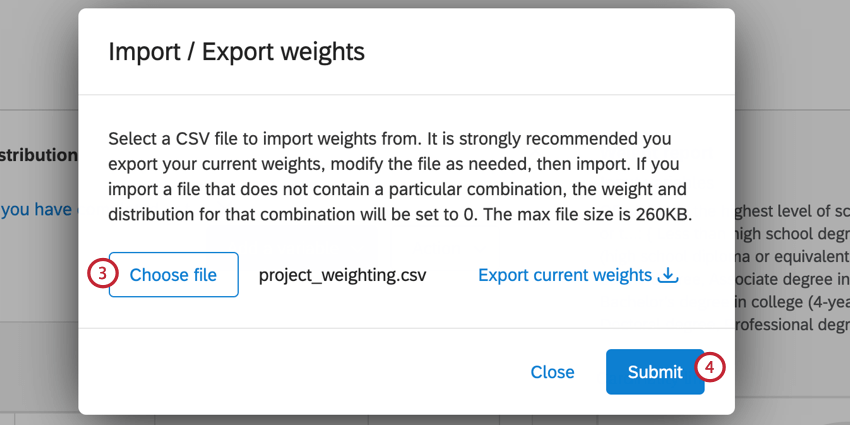
Importing Weights
Reports
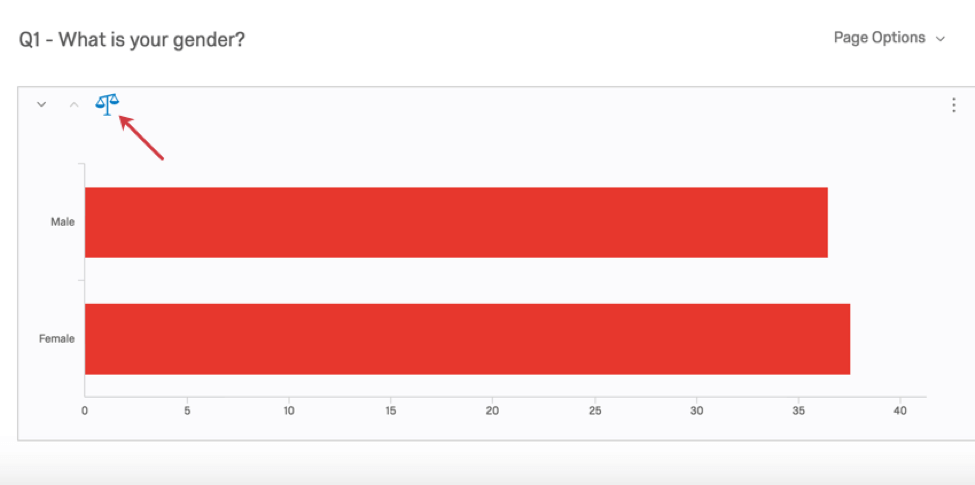
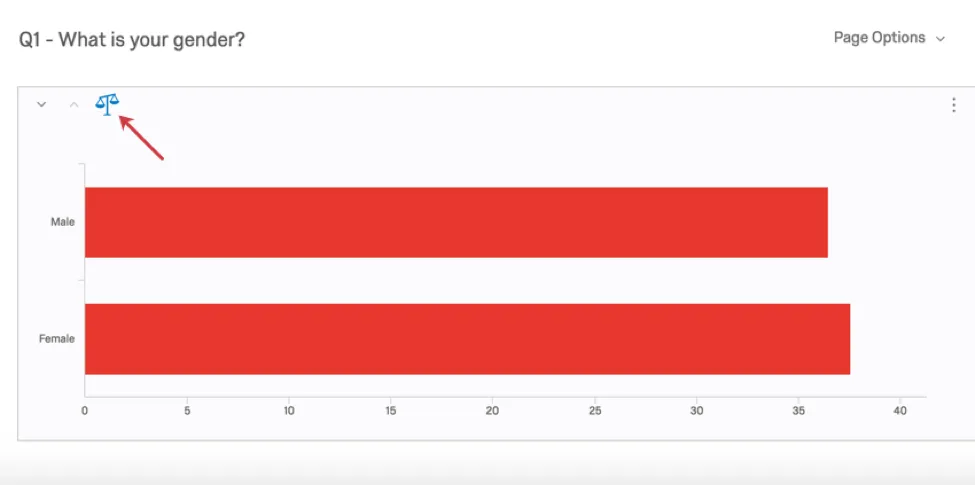
Response weighting is automatically applied to the reports in the Results tab. You can choose to turn this on or off either at the Global Level (for a whole report), or at the Visualization Level (for a single graph or table).
Qtip: This section refers to the legacy Results reporting feature. At this time, new Results dashboards do allow you to customize your report’s weighting.
Turning off Weighting for a Visualization
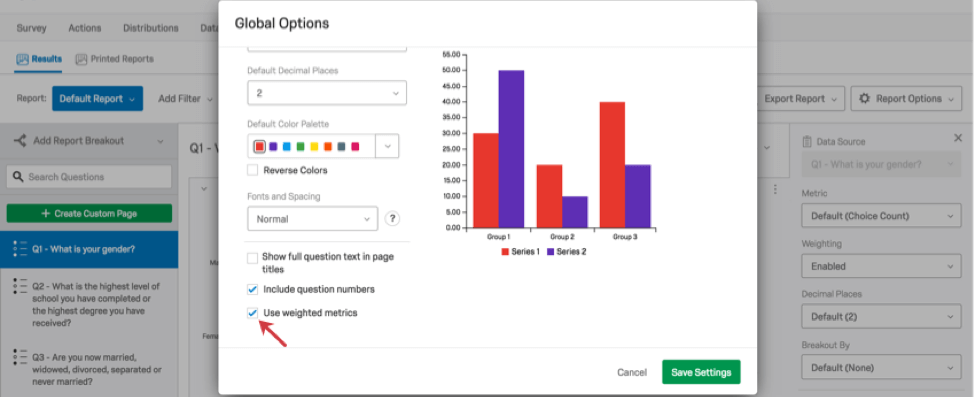
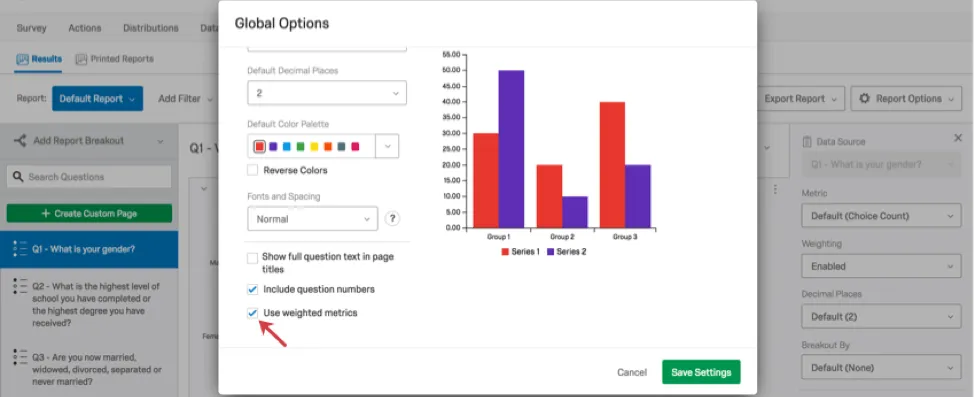
Turning off Weighting for a Report
Compatible Variables
Any variable with a finite number of answer choices can be supported by response weighting. This includes:
- Single answer multiple choice questions
- Rank Order
- Pick, Group, and Rank
- Hot Spots and Heat Maps with defined regions
- Start Date or End Date by Day, Week, Month, Quarter, or Year
- Finished status
- Response Type
- Respondent Language
- Embedded Data set to Number Set or Text Set type
- Custom Tags
- Bucketed Variables
Variables where the answer choices are infinite – such as Text Entry fields – are not compatible.
Projects Where Responses Can Be Weighted
Response weighting is only available in a few different types of projects:
- Survey projects
- XM Solutions Qtip: Response weighting is not available in Pricing Studies (Gabor Granger projects).
- Imported data projects
Qtip: While other areas of the platform, like CX Dashboards and Stats iQ, may also allow you to weight data, this support page is solely focused on weighting responses in Data & Analysis. For steps on other kinds of weighting that may exist in the XM platform, try narrowing your support site search.
That's great! Thank you for your feedback!
Thank you for your feedback!