
Global Results-Reports Settings
What's on this page
Qtip: There is a new version of Results available. To opt in to the new Results Dashboards, navigate to the Results tab and click Try it now.

Report Settings
When you click the report options dropdown and select Report Settings, you have the ability to change options that will apply to your whole report.
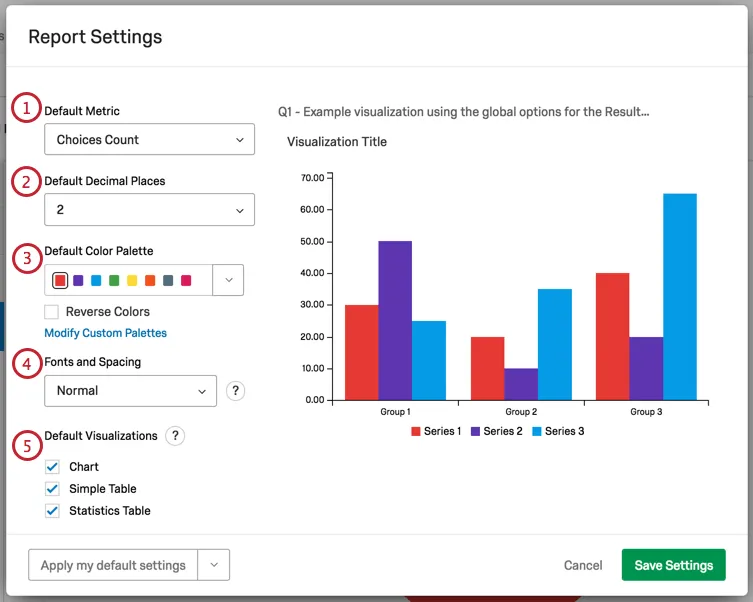
- Choices Count: The number of times each choice was selected. Note that for multi-answer questions, where respondents can choose more than one answer, the choices counts will often add up to a higher number than your total survey respondents!
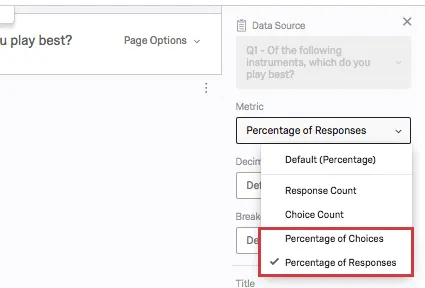
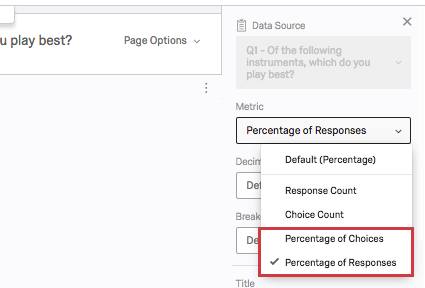
- Percentage: The percentage of respondents who chose each choice. Qtip: If you have multi-answer questions and are more interested in the percentage of choices than the percentage of respondents, adjust the metric on the visualization editing pane.

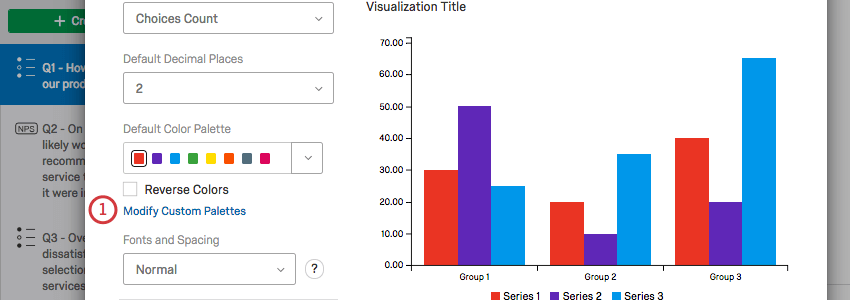
Qtip: To create your own color palette, see the Adding Custom Palettes section below.
When you adjust any of these settings, the visualization on the right will adjust so you can preview your changes.
To keep your changes, click Save Settings.
Default Visualizations
When you generate a report, each question gets a page, and there are visualizations already created on these pages for you. You have three options you can include as default visualizations:
- Chart: This is usually a Bar Chart. A chart is included with almost all questions, except for Text Entry, Hot Spot, Heat Map, and other incompatible fields.
- Simple Table: The Simple Table is included for almost all questions, except for Text Entry and other incompatible fields.
- Statistics Table: The Statistics Table is only included by default for numeric, open-ended questions.
All three of these visualization types can be edited after the fact.
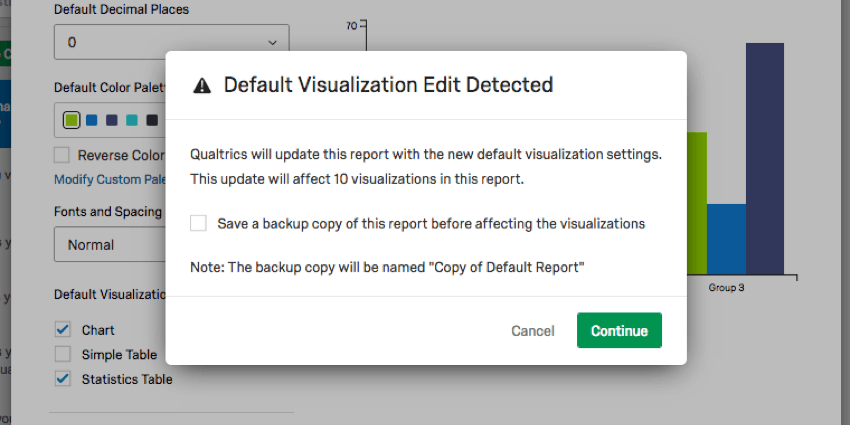
When you elect to remove one of these visualizations from your settings, you will be warned about the number of questions this will affect and be asked if you want to keep a copy of the original report. Select Save a backup copy of this report before affecting the visualizations to do so.

Default Settings
It can be a hassle to edit your colors, fonts, and visualizations over and over again. Global Settings help you create a standard style for your whole report, but what about when you create a new report? Do you have to start editing your global settings all over again?
Thanks to Default Settings, you can choose your favorite global settings for reuse over and over again. Any new reports you create will take on your personalized default settings, and you can easily switch old reports over.
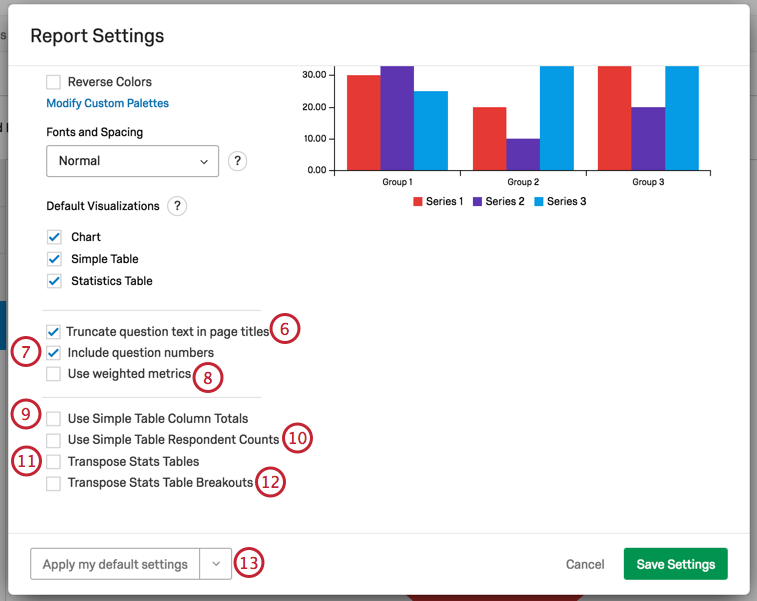
Applying Default Settings
When you click the default settings dropdown arrow, you have three options:
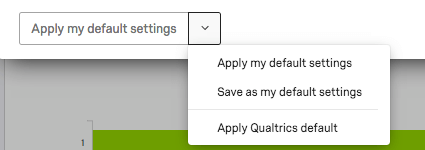
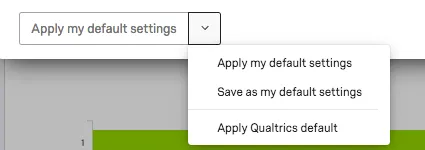
- Save as my default settings: Allows you to save changes you’ve made on this window as personalized default settings. This option does not apply changes to the report you’re working on, but saves them for reuse. These default settings will be applied to new reports you create.
- Apply my default settings: Apply the default settings you saved earlier.
- Apply Qualtrics default: Go back to the default Qualtrics settings.
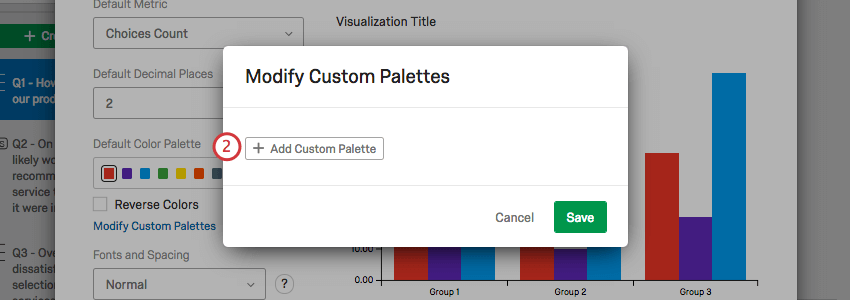
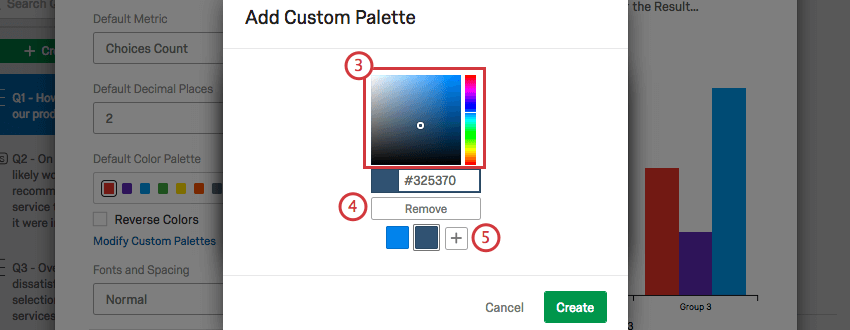
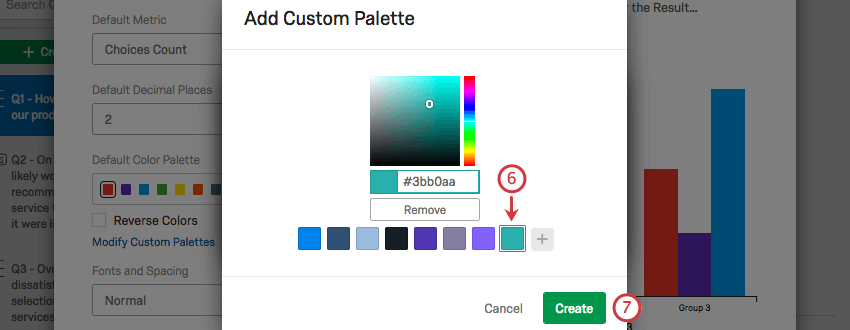
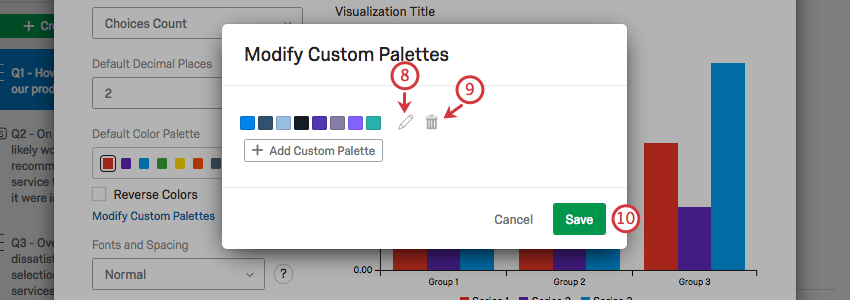
Adding Custom Palettes
In addition to choosing from preset color palettes, you can create your own custom palette to use in your reports.
FAQs
Can I change the default settings on a report instead of editing each visualization one at a time?
Can I change the default settings on a report instead of editing each visualization one at a time?
You can learn how to change your default settings on Results-Reports on the Global Results-Reports Settings support page, and you can learn how to change the default settings for Advanced-Reports on the Global Advanced-Reports Settings support page.
How do I rename my report?
How do I rename my report?
- Results-Reports: Click the gear in the upper-right and select Edit Report. A new window will open with a field for the name.
- Advanced-Reports: Go to File and choose Rename.
That's great! Thank you for your feedback!
Thank you for your feedback!