Research to ROI.
On repeat.
Bring quantitative and qualitative research to life, build an iconic brand, and design products people love. Qualtrics helps organisations detect emerging market trends, design winning strategies, and make informed decisions that convert prospects into customers.
The world's
best brands
choose
Qualtrics
Today's reality
Fast-changing markets
What was true last year – or even last month – may no longer be true today.
Savvier and pickier consumers
An abundance of choice and low switching costs make for more selective customers and users.
Pressure to reduce cost
Businesses demand more insights, faster – yet research budgets have not kept pace.
With Qualtrics Strategic Market Research you can
- Conduct custom quantitative and qualitative research faster and more efficiently
- Recruit, manage and reward panelists without leaving the platform
- Build an always-on and curated pool of respondents to tap into for agile research
- Store every insight from every study and easily find relevant data within those studies using AI-powered search
- Quickly analyze large amounts of data using ML, AI and natural language processing capabilities
- Capture market, product and brand data in a single system, alongside your customer and employee data
Conduct custom research, faster and more efficiently
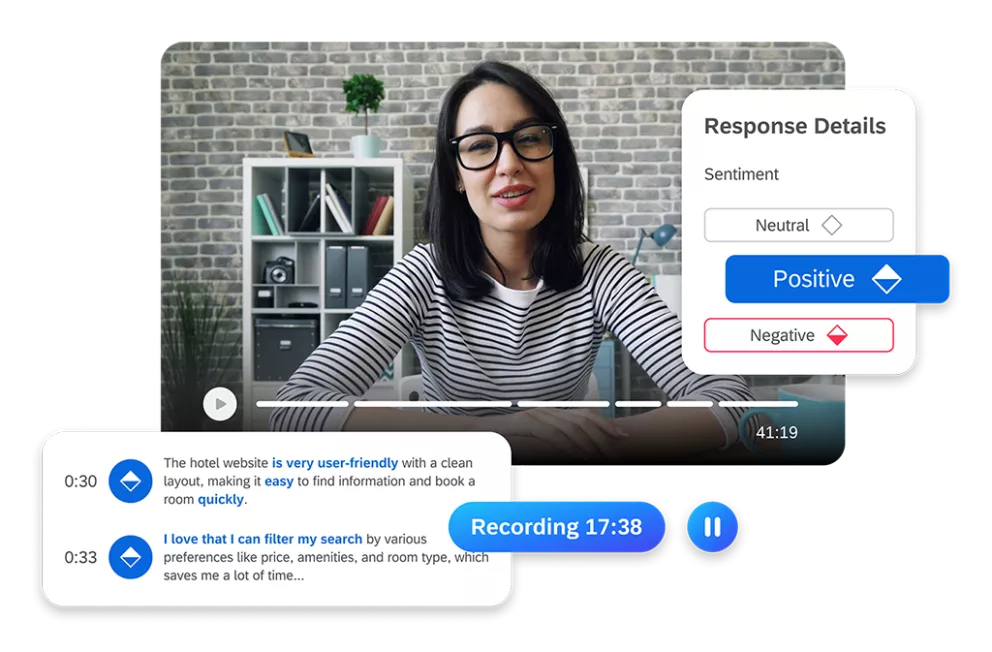
Execute custom quantitative and qualitative research faster and more efficiently across market, product and brand use cases.
- Gather feedback from every customer in 70 languages using a broad array of methodologies
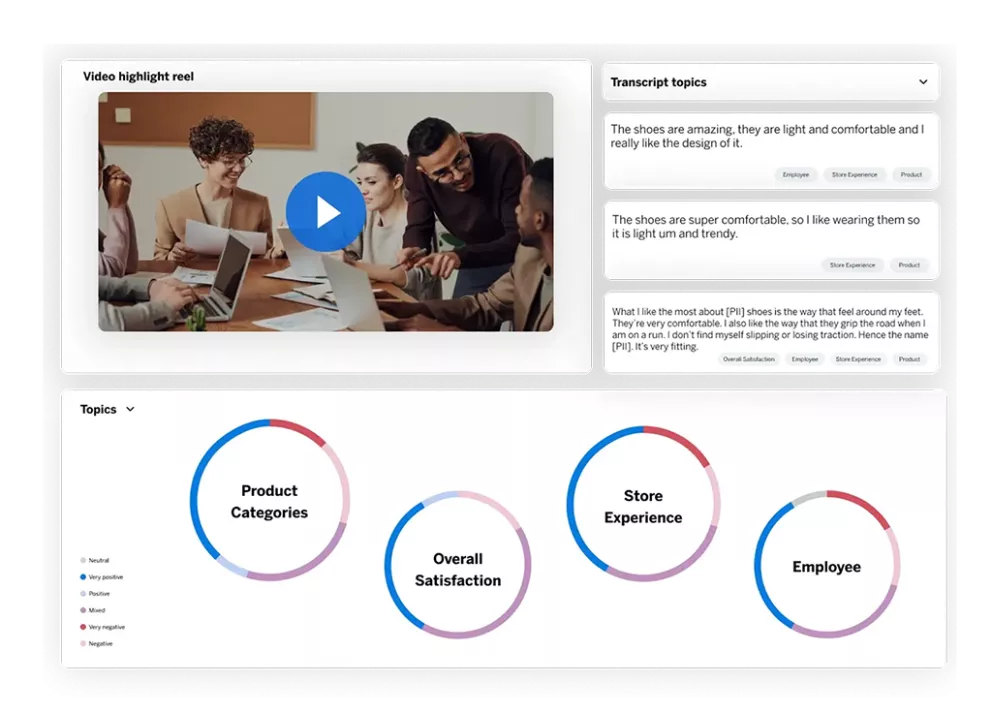
- Use AI-powered analytics to get answers faster and automate advanced statistical analyses including Conjoint and MaxDiff
- Visualise your insights with advanced role-based dashboards and bring data to life for key stakeholders
Increase the quality of your insights to drive impactful decisions
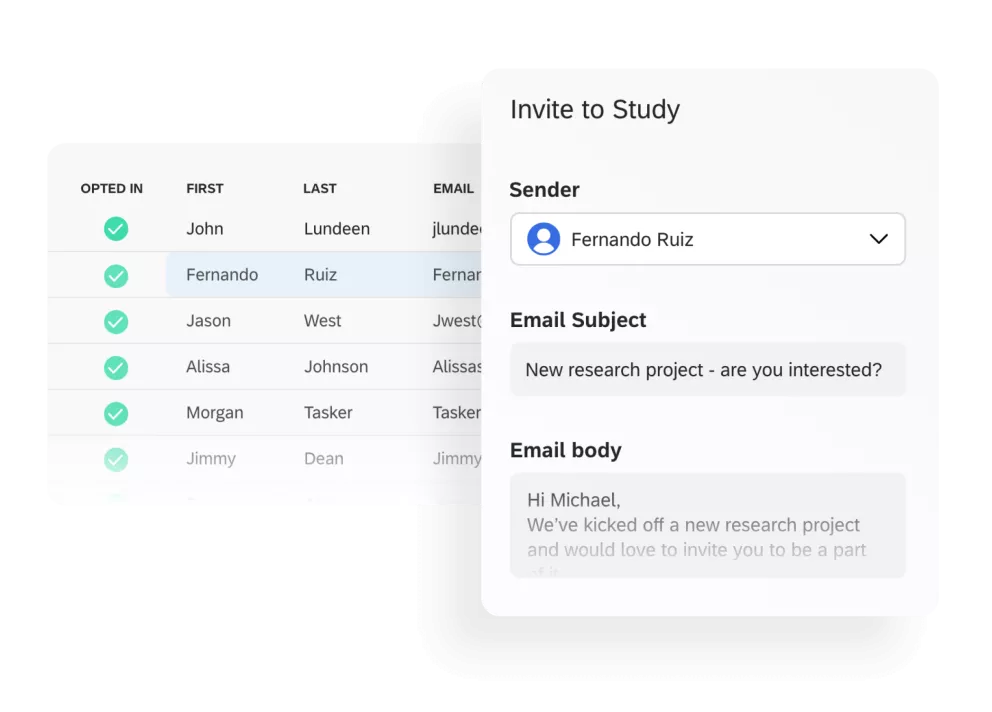
Easily create and manage your own research panel, or access third-party samples on-demand. Our comprehensive tools help businesses engage participants fast and without friction, unlocking in-depth research insights – without the red tape.
- Access ready-to-go research panels for rapid participant engagement without lengthy set-ups
- Create custom panels effortlessly to target specific demographics and gather focused insights
- Implement participant tracking to monitor engagement and ensure diverse representation in your research
research
2024 Market Research Trends
2024 Market Research Trends
Advances in artificial intelligence (AI) have dramatically expanded the speed, efficiency, and scale of research capabilities, giving businesses the data they need to make smarter, effective business decisions.
We spoke to more than 3,000 researchers in 14 countries around the world to discover what trends are shaping the year ahead.

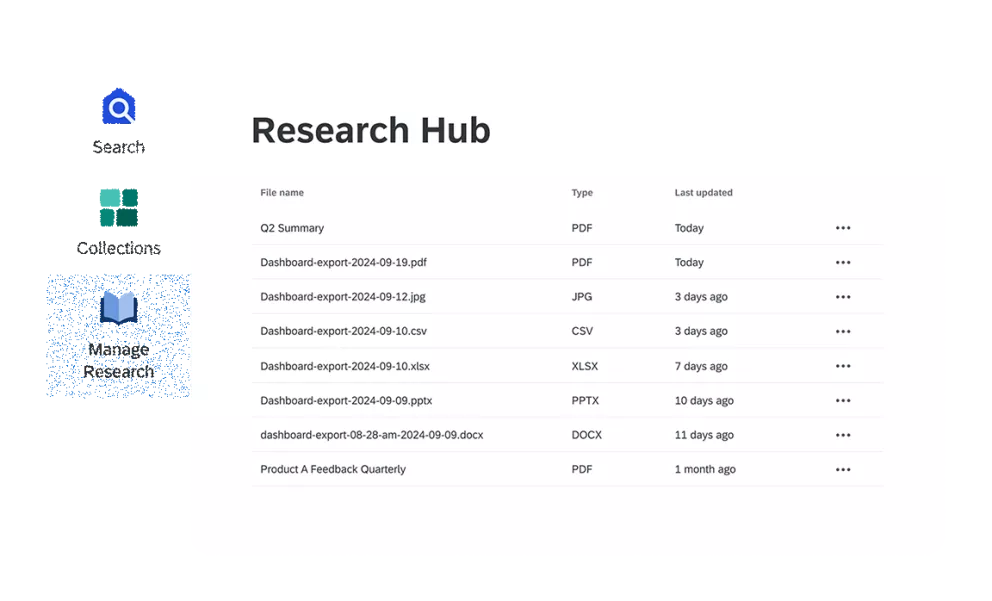
Get more ROI out of every research study
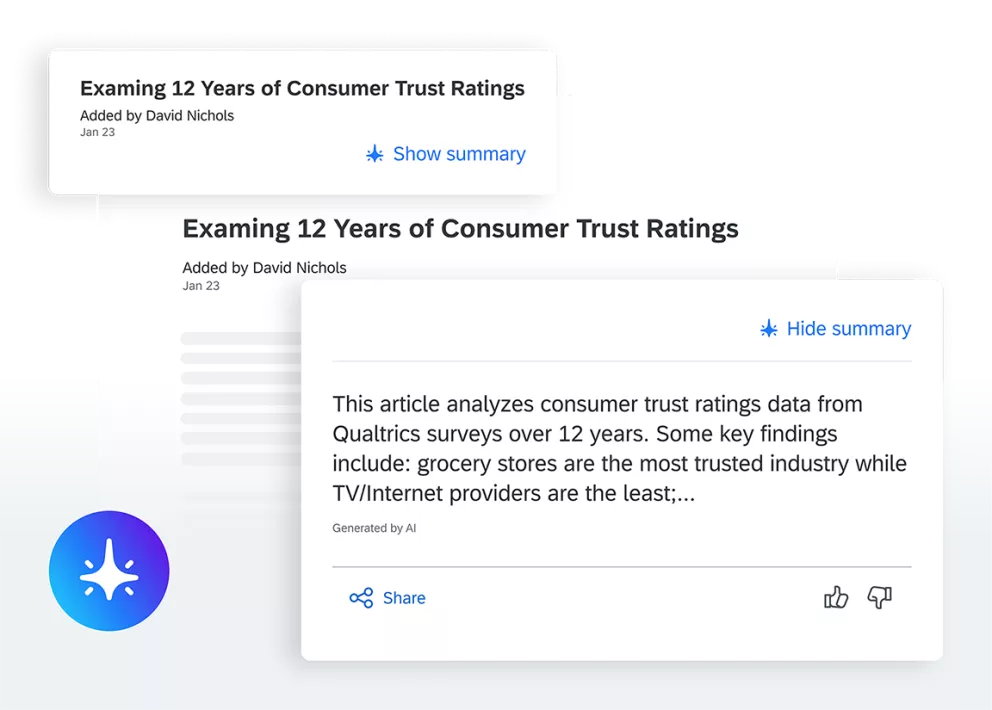
Archive insights from every study and quickly find relevant data using AI-powered search. Maximise your return on your research investment by automatically surfacing valuable insights – and use them to drive decision-making up and down your entire organisation.
- Maximise research ROI by using archived data to extract new insights
- Leverage AI-powered search to quickly locate specific insights and enhance data-driven decisions
- Implement analysis tools to visualise results and share impactful findings with your organisation seamlessly
Create flexible workflows that fit your needs
Zero in on relevant processes and deliver actionable insights for effective change. With Qualtrics, you’ll configure bespoke workflows that reflect your unique research needs, with options for evaluation, management, and subject specifics.
- Use customisable templates to design workflows that align with your team's specific research goals
- Leverage workflow automation to reduce manual tasks and enhance efficiency throughout your process
- Implement status tracking to monitor progress in real-time and ensure timely completion of research
Hear from organisations redefining their market research
Hear from organisations redefining their market research
Upgrade your programs with flexible, scalable plans
Upgrade your programs with flexible, scalable plans
Strategic Market Research FAQs
What is the Qualtrics Strategic Market Research solution?
What is the Qualtrics Strategic Market Research solution?
Our Strategic Market Research solution brings together powerful quantitative and qualitative research capabilities in one intuitive platform. You'll get the clear, actionable insights needed to develop winning products, deliver exceptional customer experiences, and make strategic decisions with confidence. The solution reveals market trends and consumer behaviours that help you identify opportunities and drive growth.
What are its key features?
What are its key features?
Everything you need for comprehensive market research is right at your fingertips: customisable surveys that dig deep into consumer insights, real-time analytics dashboards, AI-powered recommendations, and seamless integration with your existing tools. You can also build and manage your own research panel or instantly access third-party samples. Finding the exact data you need is simple with our AI-powered search.
How can it enhance product development?
How can it enhance product development?
From initial concept testing to prototype refinement, you'll know exactly how to align your products with customer needs. Our solution is designed to accelerate insights that drive real business impact. Transform your product development process with continuous customer feedback at every stage.
How does this platform help with understanding market trends?
How does this platform help with understanding market trends?
You'll see shifts in consumer behaviour as they happen and understand how your performance measures against industry benchmarks. This enables quick, confident decisions to maintain your competitive advantage. Stay ahead of changing market dynamics with tools that track and analyse trends in real-time.
Can the platform help with audience segmentation?
Can the platform help with audience segmentation?
Absolutely. Our solution helps you understand exactly who your customers are and what matters to them. Advanced analytics reveal distinct customer segments based on demographics, behaviours, and preferences. These insights make it possible to create highly targeted marketing strategies that resonate with each unique audience.
How does the platform improve competitive intelligence?
How does the platform improve competitive intelligence?
Our solution helps you gather detailed competitive insights and understand your position on key attributes that matter to customers. These insights show exactly where to invest your efforts for maximum impact. Get a clear picture of where you stand in the market and where to focus next.
More strategy & research solutions
More strategy & research solutions
XM for
