
Analysis Settings
What's on this page
About Analysis Settings
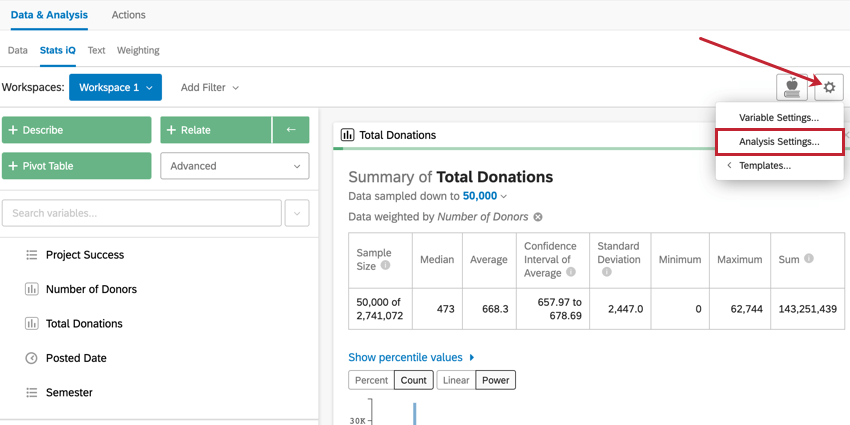
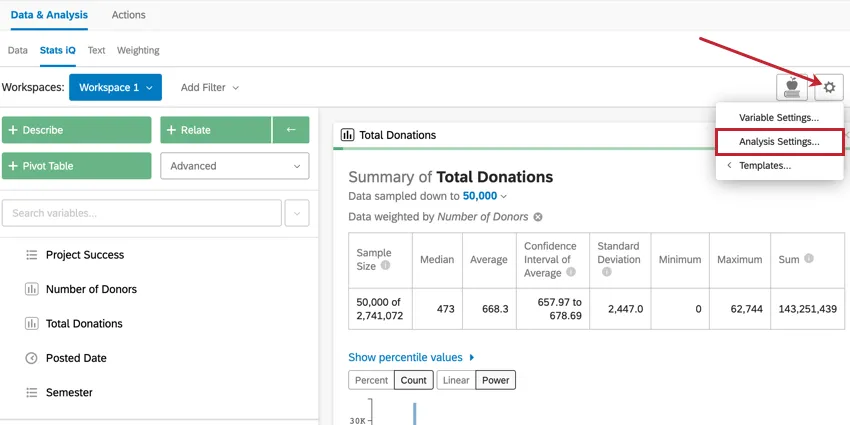
The Analysis Settings in Stats iQ allow you to change details of analyses within Stats iQ. To access Analysis Settings, click the gear icon in the upper-right corner of the workspace. If you would like to know more about variable settings instead, visit the Variable Settings page.
Weighting

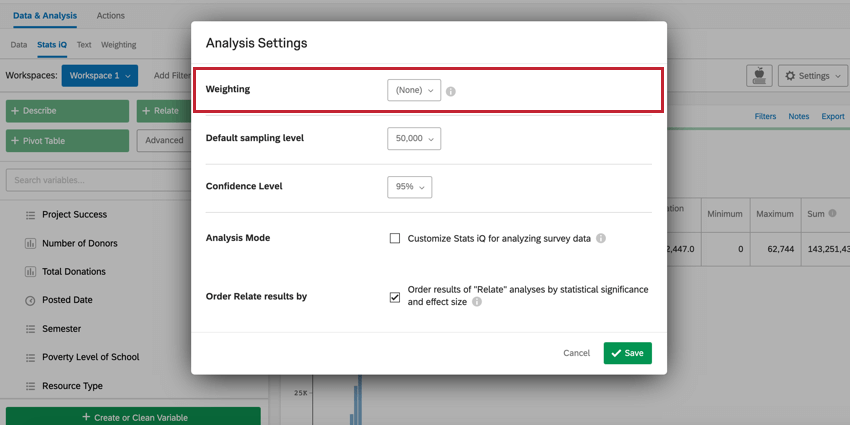
The Weighting option in Analysis Settings allows you to apply weights to your entire workspace. To choose a weight, click the dropdown menu next to the Weighting option and choose the weight you’d like to apply to your analyses.
Qtip: “Qualtrics-defined weighting” is any weighting set up in the Weighting section of the Data & Analysis Tab.
Qtip: For more information on creating weighting variables in Stats iQ, read the Creating & Applying Weights page.
Default Sampling Level
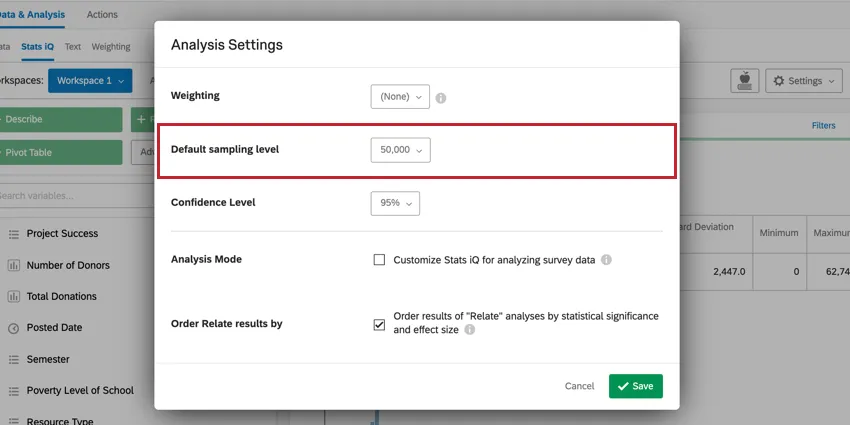
Attention: You will only see this option if your dataset contains more than 10,000 responses. Sampling will be automatically applied if your dataset contains more than 200,000 responses.
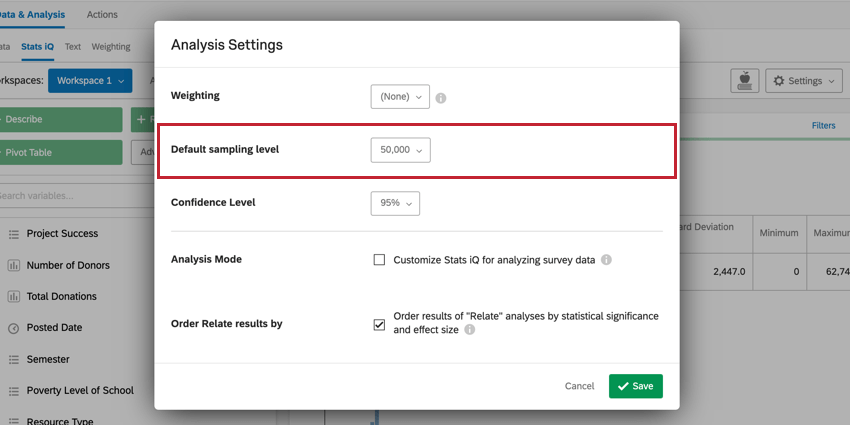
Under “Analysis Settings,” you can change the default sampling for your entire Stats iQ analysis. By default, the sampling level is set to 10,000 responses. This is because of the following:
You may adjust the Default sampling level by clicking the dropdown menu. The minimum is 10,000 responses. The maximum is your entire dataset.
Samples are taken before weights are applied. However, if you choose to apply a filter, sampling takes place (or is reevaluated) after the filter is added.
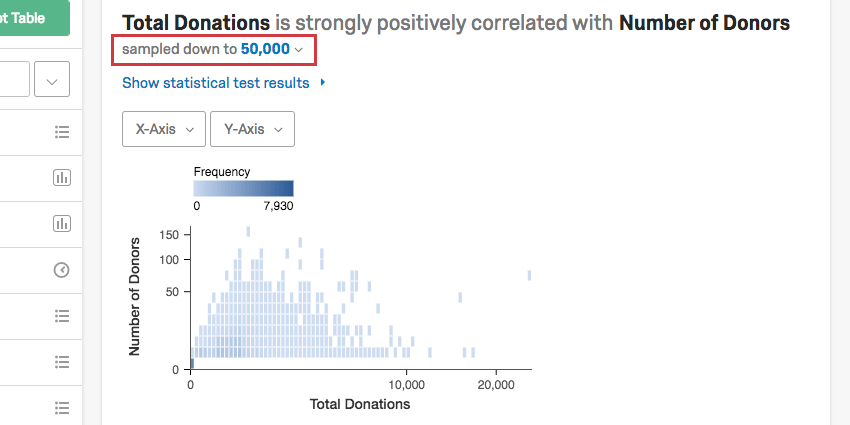
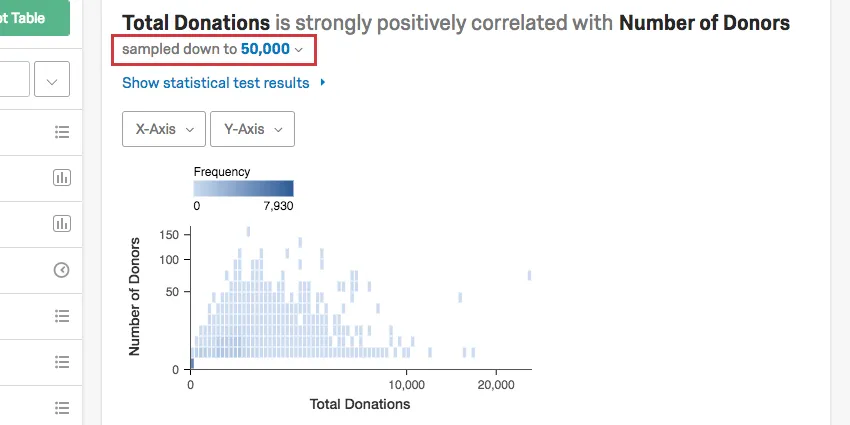
Card Settings
Sometimes you may want to adjust the sampling on an analysis-by-analysis basis. To change the sampling on a single card, click the dropdown in the upper-left that says sampled down to X.
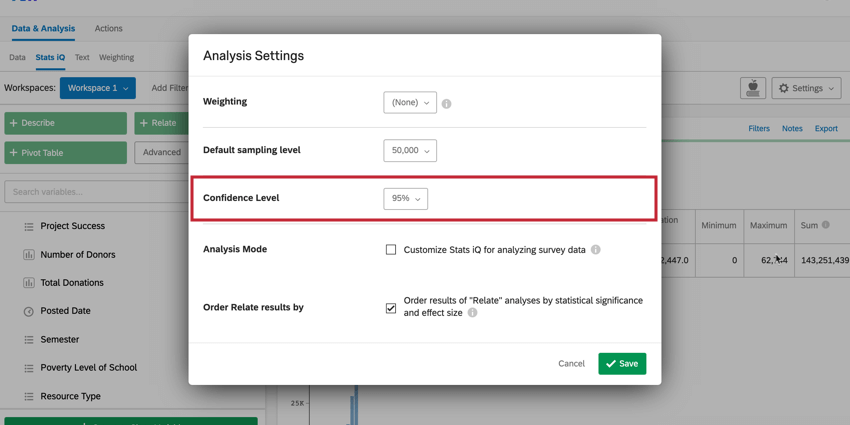
Confidence Level
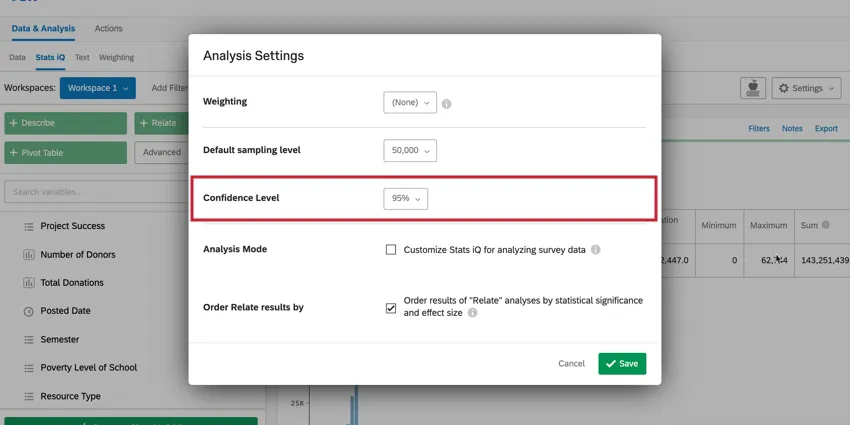
Setting the confidence level in Stats iQ indicates how confident you would like to be that the results generated through the analysis match the general population. To change your Confidence Level, use the dropdown menu next to the Confidence Level option in Analysis Settings.
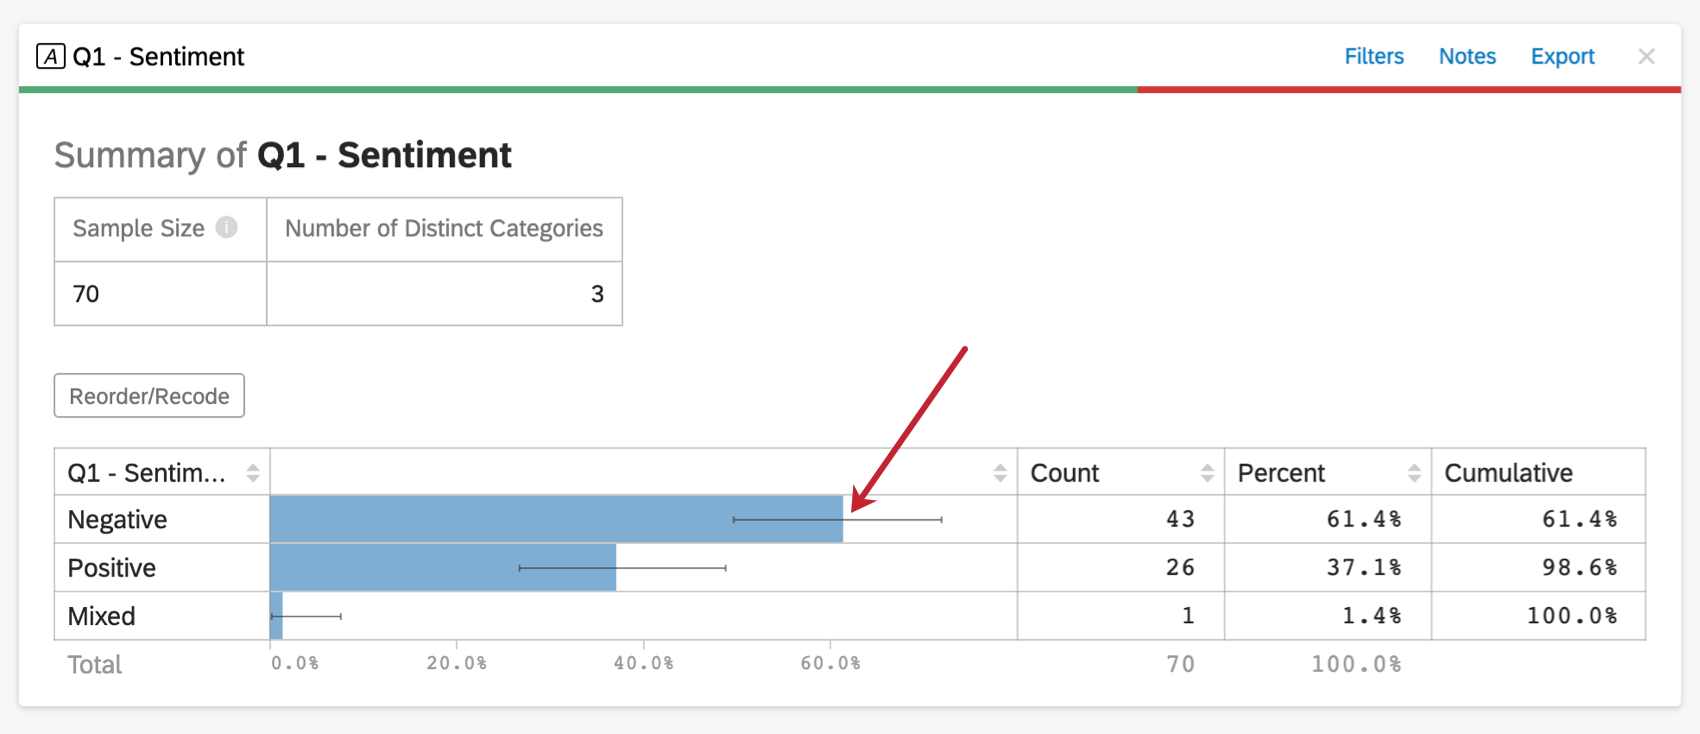
If you select the Describe analysis option for a variable that contains data on location, Stats iQ will display a confidence interval (in the form of error bars) on the graphical output. If the confidence level is set to 95%, this width of the error bars indicates that, if we were to sample the population multiple times, we would expect that the results would fall within the bars 95% of the time.

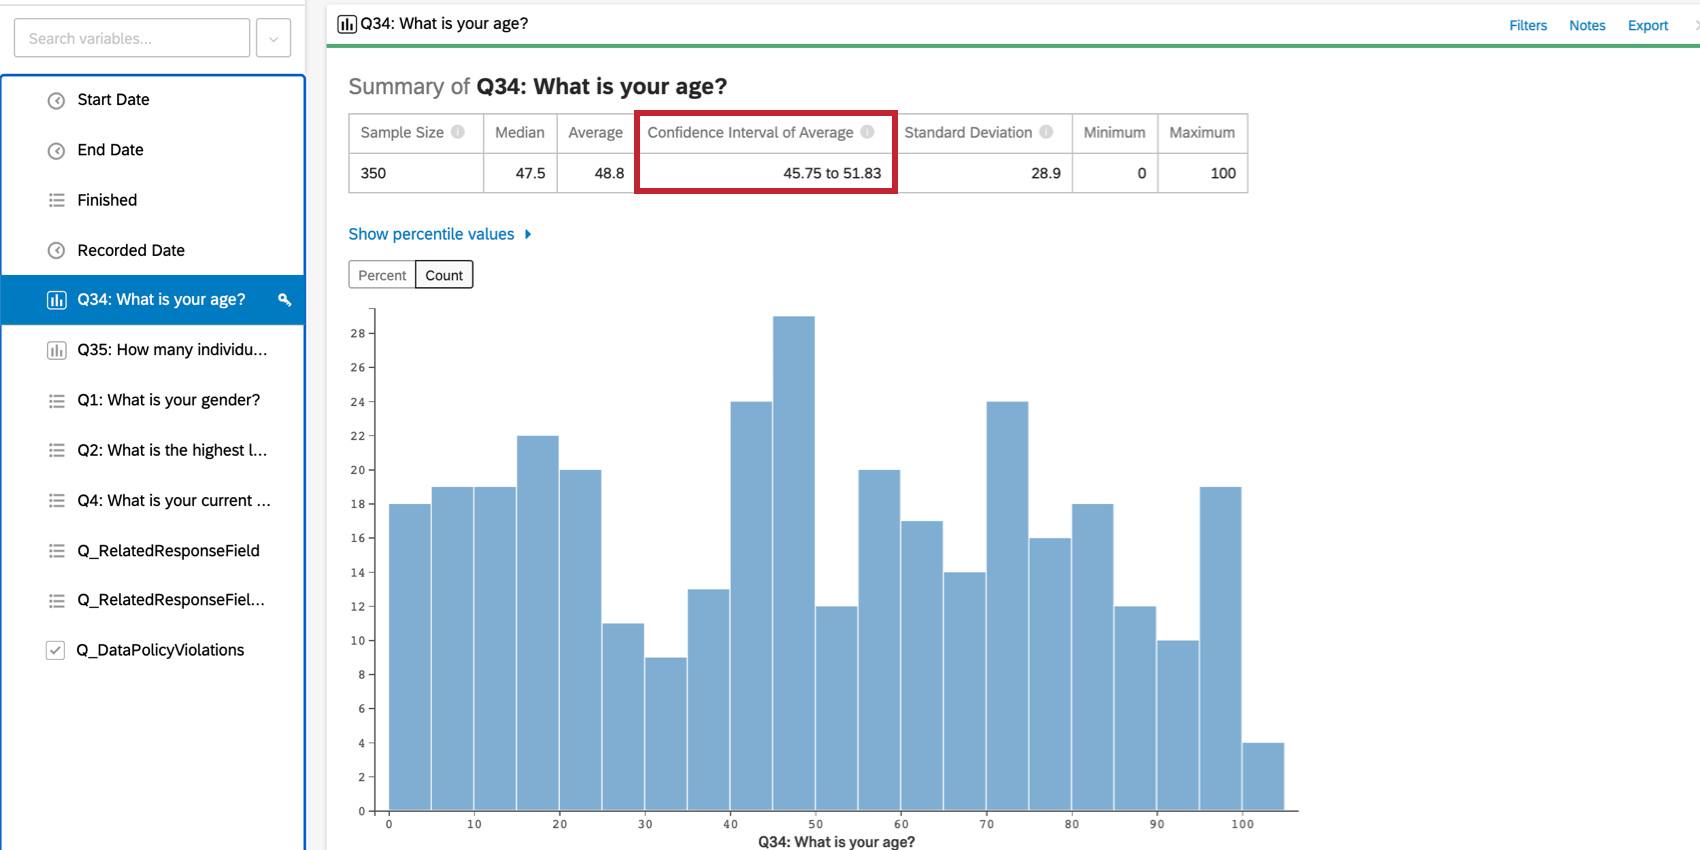
Stats iQ will also indicate explicitly the range of the confidence interval when hovering over graphs for categorical data and at the top of the card for numerical data.

The same logic applies to statistical tests created using relate, coefficients produced in regression, and several other statistical calculations in Stats iQ.
By a wide margin, the most commonly used confidence level is 95%. It’s also relatively common to see 90% in business settings, or 99% or higher in scientific settings when there is a lot of available data.
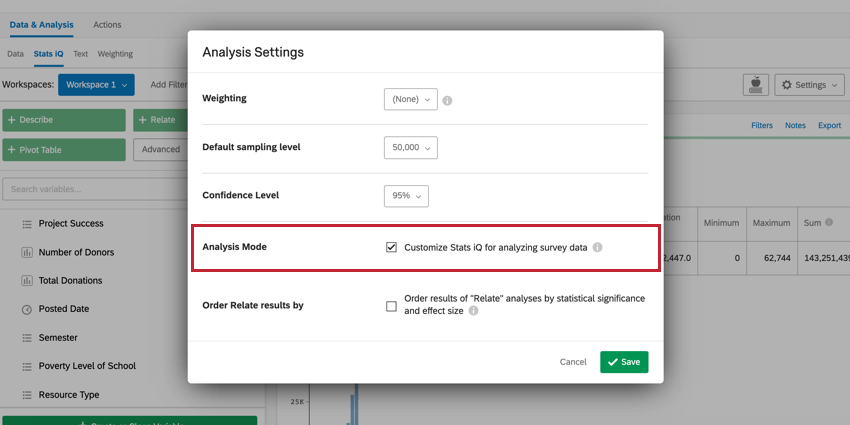
Analysis Mode

Attention: This option will appear only for Imported Data Projects.
The Analysis Mode option is used to customize your Stats iQ workplace for analyzing survey data. When this setting is enabled, “Sum” calculations will be hidden from your analyses since this metric usually isn’t relevant in a survey context.
Order Relate Results By
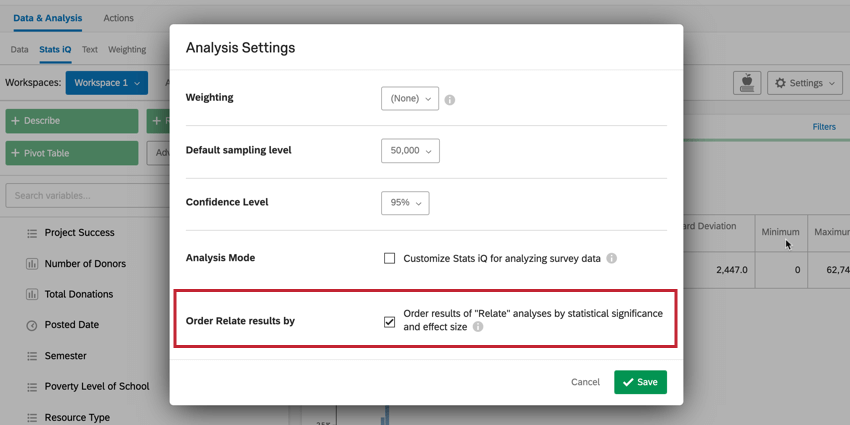
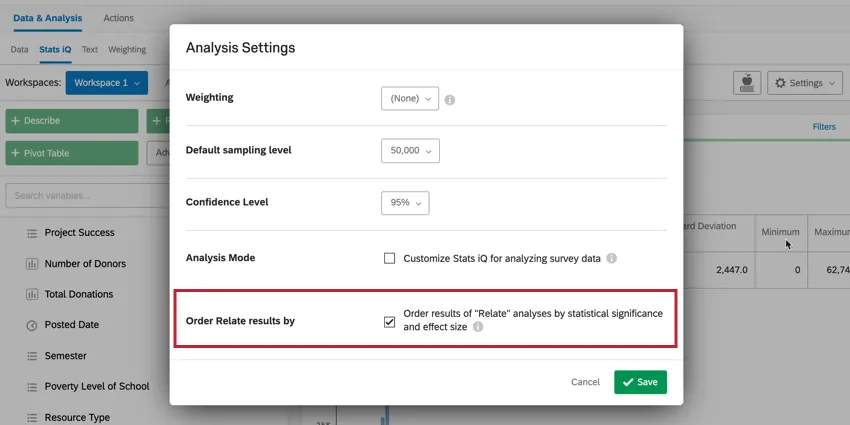
The Order Relate results by option determines how your relate cards are ordered in your workspace. When this option is enabled, your relate analyses will appear in order of statistical significance and effect size, with the strongest relationships appearing first. If this option is disabled, your relate analyses will appear in the same order as the variables appear in the variable pane.
Qtip: Multiple relate cards are created when more than one variable is selected in addition to the key variable, before the Relate analysis button is selected. For more information, visit the page on relating data.
FAQs
How do I create a new Stats iQ variable?
How do I create a new Stats iQ variable?
How can I "recode" values in Stats iQ?
How can I "recode" values in Stats iQ?
For variables that can't be directly recoded, you can recode values for in the Create or Clean Variable menu. In the Create Variable window, use the Logic method to assign numerical values to each existing value for the variable. You can either create a new variable or select Replace Existing Variable in the lower-left corner to update the variable with the new numeric values.
For more information on the Logic method for variable creation, please visit the support page on Variable Creation.
What are the options for analyzing my data in Stats iQ?
What are the options for analyzing my data in Stats iQ?
- Describe: Selecting a variable from the list and then clicking Describe will give you a visualization of the data contained in that variable. Use this when you would like to see how the data for a certain variable is distributed.
- Relate: Selecting two variables and then clicking Relate will run a statistical analysis of the relation between the two variables. Use this when you would like to know how strongly two variables are correlated.
- Pivot Table: Selecting two or more variables and clicking Pivot Table will create a table that displays the values of the variables as rows and columns. The cells can be set to display a variety of different information including column and row percentage, Sum, and Variance. Use this when you would like to compare the overlap between specific values of a set of variables.
- Regression: Selecting two variables and clicking Regression will give the mathematical relationship between the variables. Use this when you would like to predict values for one variable based off of the values of another.
- Cluster: Selecting two to ten demographic variables and clicking Cluster will display groupings of traits most likely to occur together, thus revealing the population segments captured in your data.
What do the different variable types mean in Stats iQ?
What do the different variable types mean in Stats iQ?
I don't know what this statistical term means. Can you tell me?
I don't know what this statistical term means. Can you tell me?
- Statistical tests: ANOVA, T-test, and Chi-squared are all statistical test that Stats iQ performs to test whether or not the relationship between two variables is significant. These tests are used to generate a P-Value.
- P-Value: This value represents the probability that the observed results would be seen if no correlation between the variables exists. A lower P-Value means more correlated data.
- Effect Size: The effect size is a measure of how large the correlation between two variables is. This is measured in different ways depending on the type of the statistical test performed. Examples are Cohen’s d, Pearson’s r, and Cramer’s v. The larger the effect size value, the more correlated the variables are.
How do I filter the data that appears in Stats iQ?
How do I filter the data that appears in Stats iQ?
How do I get my new responses to show up in Stats iQ?
How do I get my new responses to show up in Stats iQ?
What’s Stats iQ? / Where’s Statwing?
What’s Stats iQ? / Where’s Statwing?
What do I do if my data isn't loading properly?
What do I do if my data isn't loading properly?
That's great! Thank you for your feedback!
Thank you for your feedback!