
Variable Settings
What's on this page
About Variable Settings
The Variable Settings menu allows you to manage details of the variables in your dataset, including changing the variable name, recoding the variable values, and hiding variables from your workspace. Here are some examples of when you might need this functionality:
Example: You have a question where you ask if respondents are members of group 1, 2, or 3. Stats iQ thinks this is a numeric variable, and when analyzing it, finds values such as average, max, and min. But these groups are truly categories, and should be treated as if they were called Group A, B, or C, or red team, blue team, and green team. In this case, it helps to go to variable settings to change the variable type.
Example: You have respondents select from a series of income ranges. You notice in Stats iQ that these ranges aren’t listed from lowest to highest; you could use the variable settings to reorder these ranges.
Example: One of your questions has a “Not Applicable” option respondents can choose if the question doesn’t apply to them. If desired, you can exclude these values from analysis.
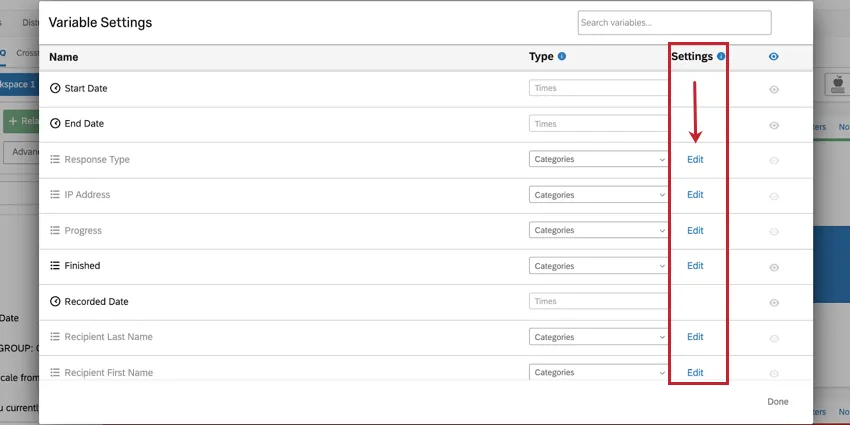
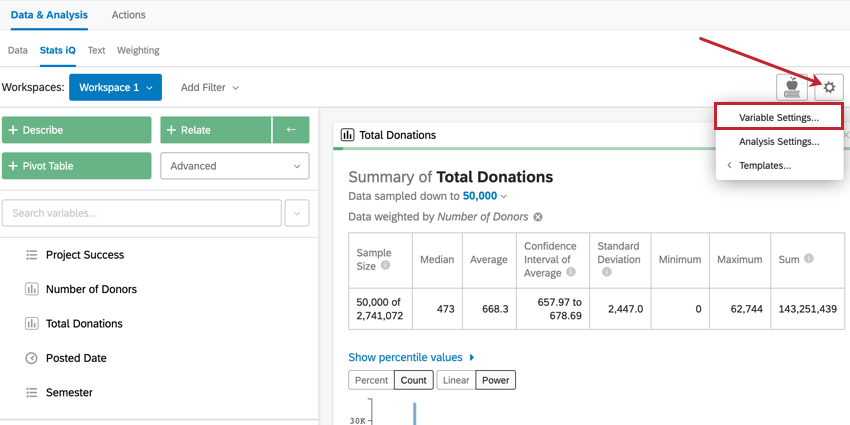
To access the variable settings, click the Settings icon in the upper-right corner of the workspace and select Variable Settings.
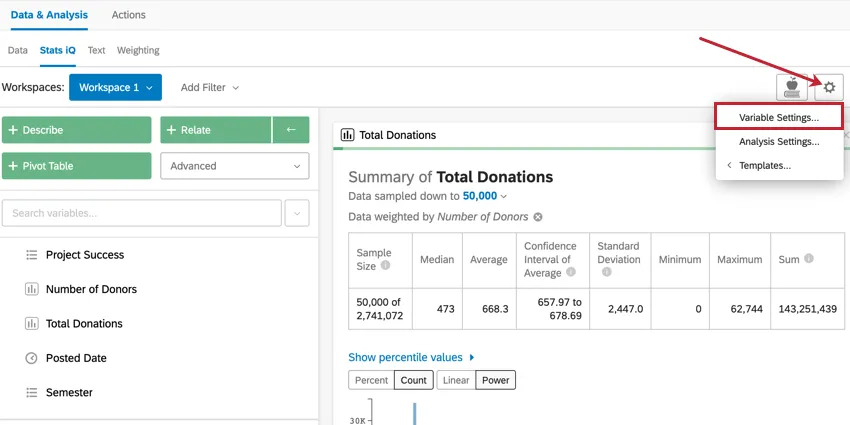
Qtip: If you would like to know more about analysis settings instead, visit the Analysis Settings page.
Renaming Variables
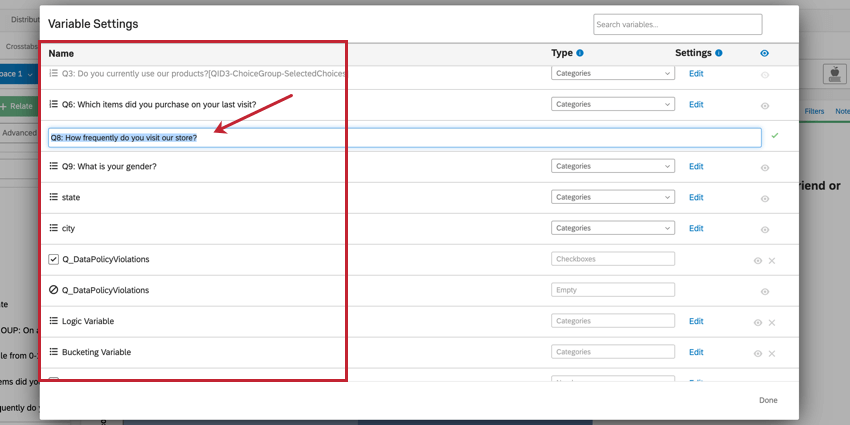
The Name column in the Variable Settings menu displays the current name of each variable in the dataset. Click a variable name to edit it. Type the new name and press Enter on your keyboard to save the new name. This will change the variable’s name in Stats iQ but not in the rest of Qualtrics.
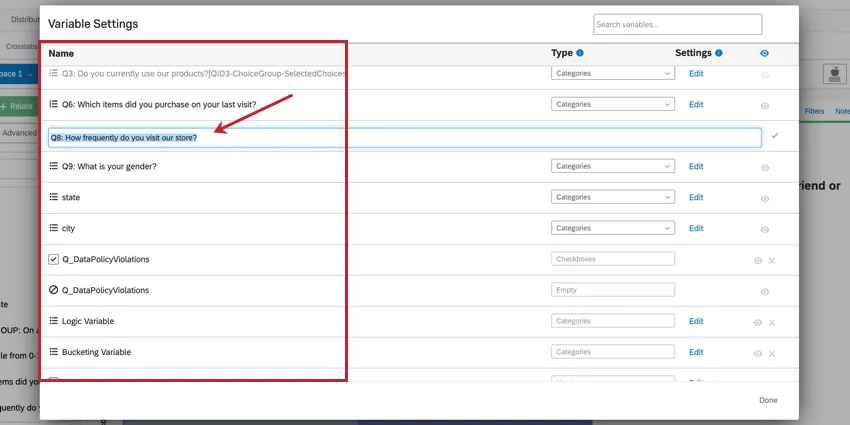
Qtip: You can speed up the process of renaming variables by clicking Tab to easily switch from one to the next.
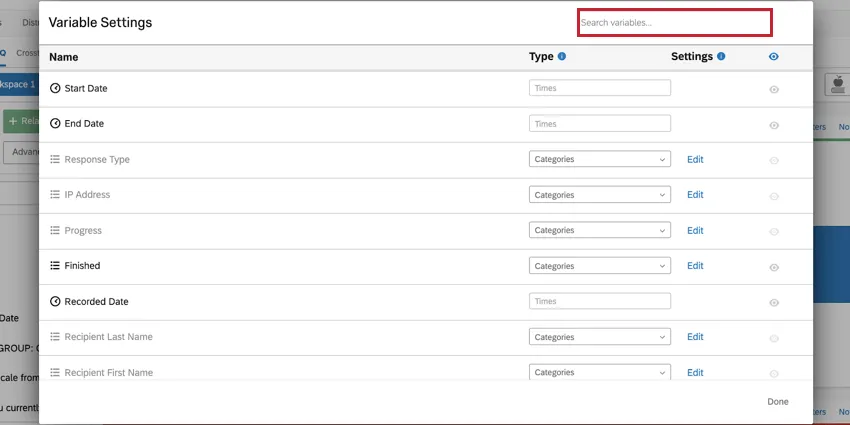
Use the search bar at the top of the window to search for variables in your dataset.
Changing Variable Types
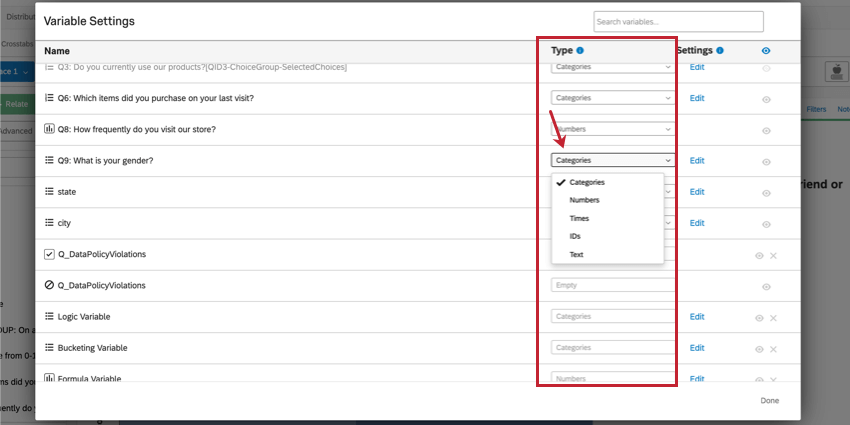
The Type column in the Variable Settings menu indicates each variable’s current type. Stats iQ will automatically determine which variable type should be assigned to each variable in the dataset, but you may encounter a situation where you need to manually change the variable type for a particular variable. Clicking the dropdown in this column allows you to select the variable type for a given variable.
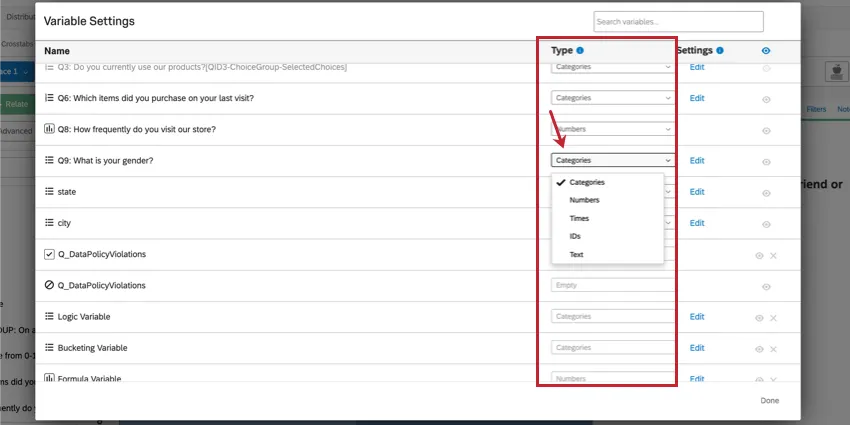
A list of variable types can be found on the Stats iQ Overview page.
Disallowed Variable Type Changes
Some variable types can’t be changed. See the below list on what changes are not allowed.
- Time variables cannot have their type changed.
- Checkbox variables cannot have their type changed. However, you can create a new variable using bucketing or logic to transform your data.
- Custom variables cannot have their type changed. You can however edit the conditions for your custom variable.
- No variables can be changed into the checkbox type. These variables come from multiple select questions only.
Editing & Recoding Variables
Stats iQ allows you to assign backend numbers to your data for performing statistical analysis and to exclude certain values from your analyses. The backend numbers for your data are called recode values. To change your recode values for a given variable, click Edit in the Settings column.
While the recode values in Stats iQ are separate from the recode values in the survey editor, they function the same. When the Stats iQ dataset is first generated, your variables will initially inherit their recode values from the survey editor. Once the Stats iQ dataset is generated, the recode values in the survey editor and the recode values in Stats iQ are separate from each other, and can be edited independent of each other.
Qtip: Any changes made to your recode values in Stats iQ will not affect your recode values in other areas of the Qualtrics platform.
Qtip: Only categories and checkboxes can be recoded. For variables that can’t be recoded, try creating a custom variable instead.
Recoding Categories Variables
You can recode categories variables so that your categories have a number associated with them. You can then use these numbers in your statistical analyses.
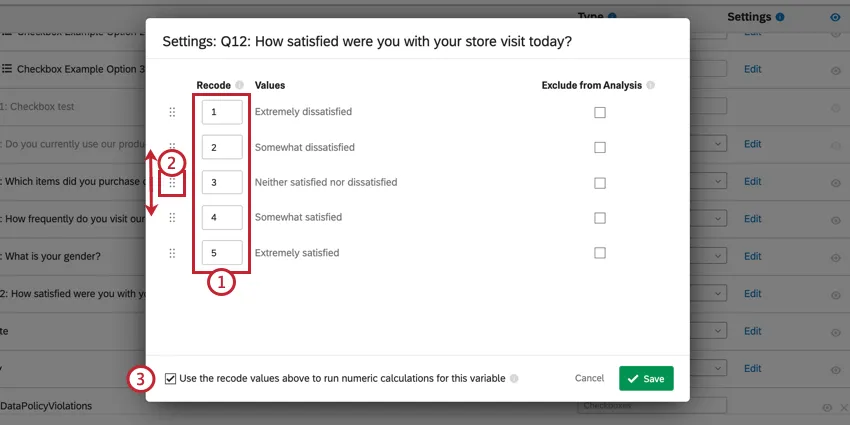
Qtip: This option is used when your categories belong in a certain order. For example, when asking respondents to pick an answer from “Extremely Dissatisfied” to “Extremely Satisfied” we can assign recode values to these categories in a chronological order from 1 to 5. This will make your statistical analyses for this variable more powerful and easier to interpret.
Recoding Checkboxes Variables
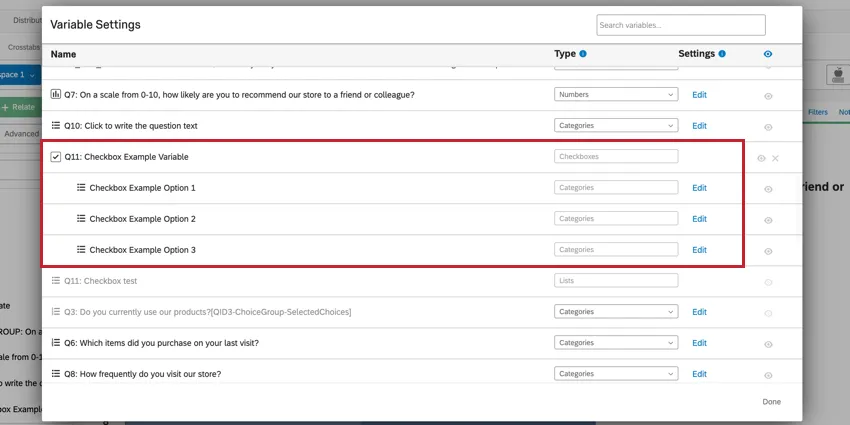
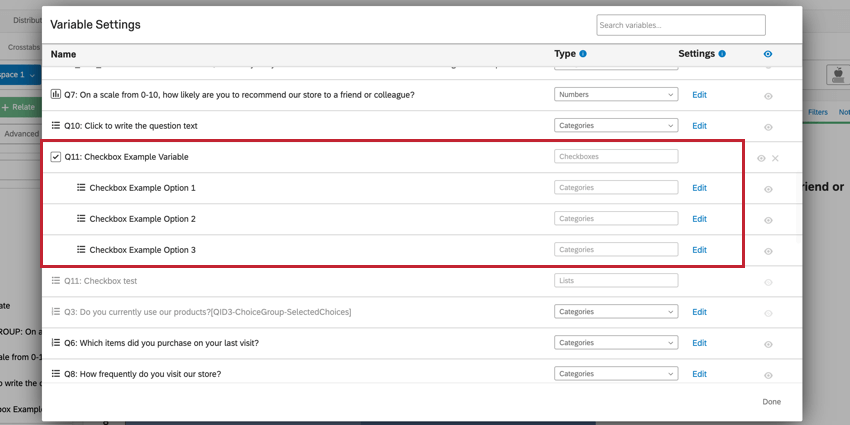
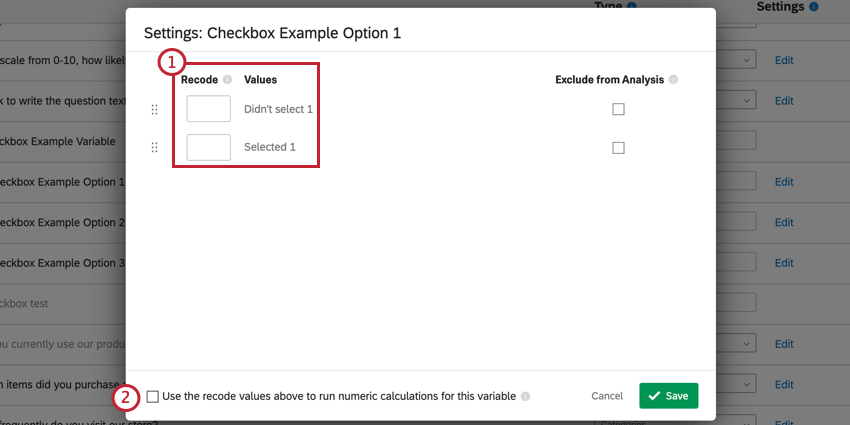
You can’t recode checkboxes variables directly. However, you can recode each value (i.e. answer choice) of your checkbox variable.
Example: In this example, we have a checkbox variable with three values. The edit button is available for each value that makes up the checkbox variable, but not for the variable itself.
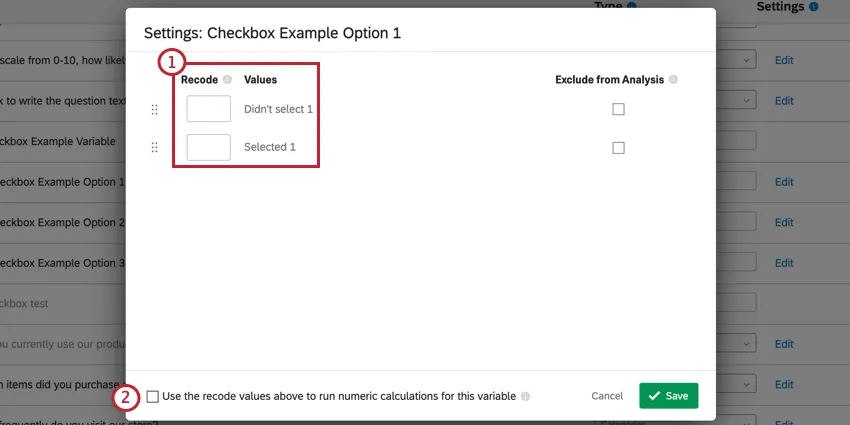
- Didn’t select recodes to 0
- Selected recodes to 1
Qtip: Use this option to use the recode values in your analyses. For example, let’s say you have a question asking respondents to select all of their preferred foods from a list. After recoding your values following the standards above, you can then run an analysis to see if there’s any statistical relationships for selecting or not selecting certain food items together.
Editing Custom Variables
If you’ve created a custom variable, you can edit the rules of your variable by clicking Edit next to the variable.
For more information on creating custom variables, see Stats iQ Variable Creation.
Exclude from Analysis
When recoding your variables, there’s an option to mark a value as “Exclude from Analysis”. What this means is that the value will not be used in any calculations in Stats iQ. This option is usually used for values such as “not applicable” or “other”.
When you build your survey, you have the option to mark certain answer choices as excluded. If you do this before generating your Stats iQ dataset, those same fields will automatically be marked as excluded from analysis in Stats iQ.
Qtip: Marking a field as “Exclude from Analysis” in Stats iQ will affect the field in both Stats iQ and Crosstabs. However, the field will be unaffected in other areas of the platform, such as in your raw data and in your reports.
You can mark values as “Exclude from Analysis” for the following variable types:
- Categories
- Numbers
- Checkboxes Qtip: For checkboxes, you cannot mark the entire variable as “Exclude from Analysis,” but you can mark individual values as excluded. See the above section on recoding checkbox variables for more information.

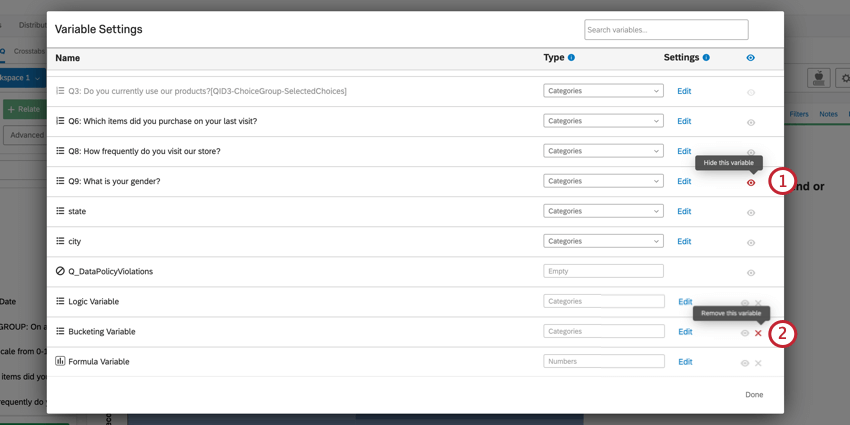
Hiding & Removing Variables
The Variable Settings window allows you to hide variables from your workspace and remove them from your dataset entirely.
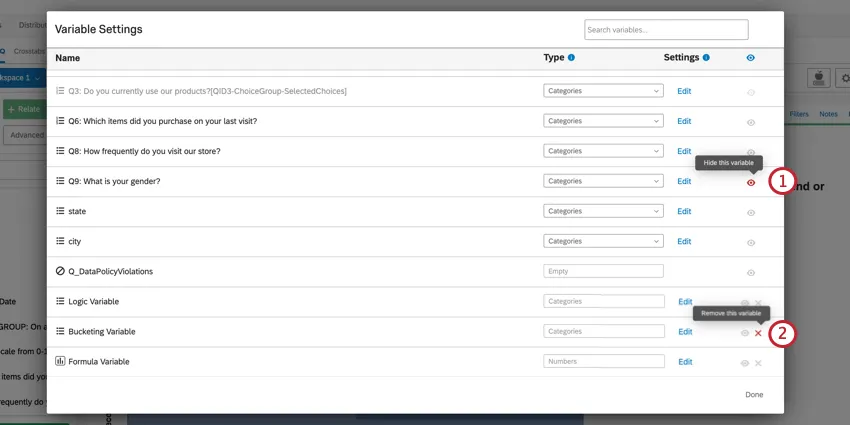
Qtip: You can’t run analyses on hidden variables. However, analyses you’ve already run on the variable will still be visible in your workspace.
Qtip: You can only delete custom variables. Once deleted, custom variables are irretrievable! Any analyses dependent on deleted custom variables will no longer be valid once the field is deleted.
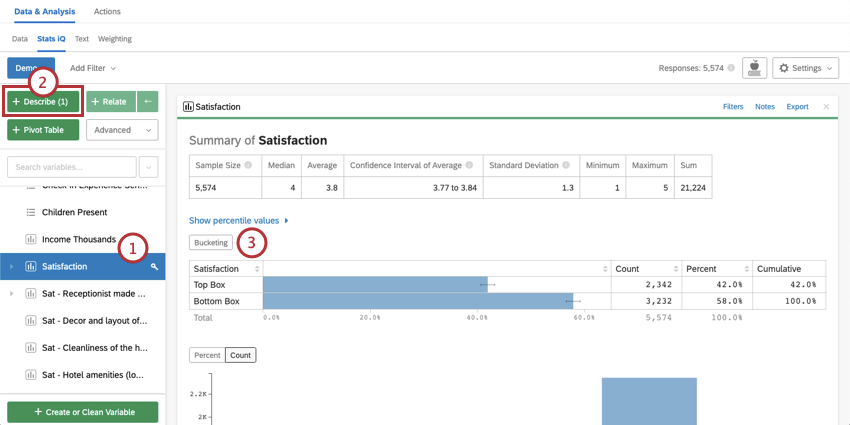
Using Top Box in Stats iQ
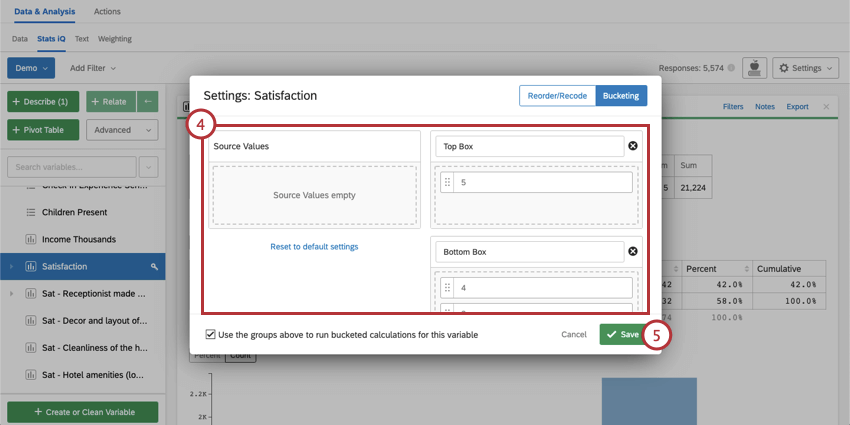
Top Box represents the percentage of respondents who fit into the highest ends of a question or variable’s scale. Creating a Top Box for your data can make your results stand out more intuitively. In other words, it’s generally more intuitive to think, “40% of people gave a really good answer!” than “the average was 3.8.” Stats iQ allows you to create a Bucketing setting directly on your variable card, which allows you to create a Top Box for your statistical analysis. This can be particularly helpful when interpreting your results, because it will break down your variable into a form that’s easily digestible and is commonly used in certain fields, like in Employee Experience research.
Attention: This feature allows you to create a Bucketing setting directly on the variable. If you would like to bucket a new variable, see Stats iQ Variable Creation.
Example: In some situations, like in Market Research, the only thing that matters is getting a Top Box measurement. It’s unlikely that someone responding with a 3 on a 1-to-5 satisfaction survey will buy a product, so it’s not meaningfully different from a 1 on that scale. In this case, Top Box allows you to collapse your data for easier analysis.
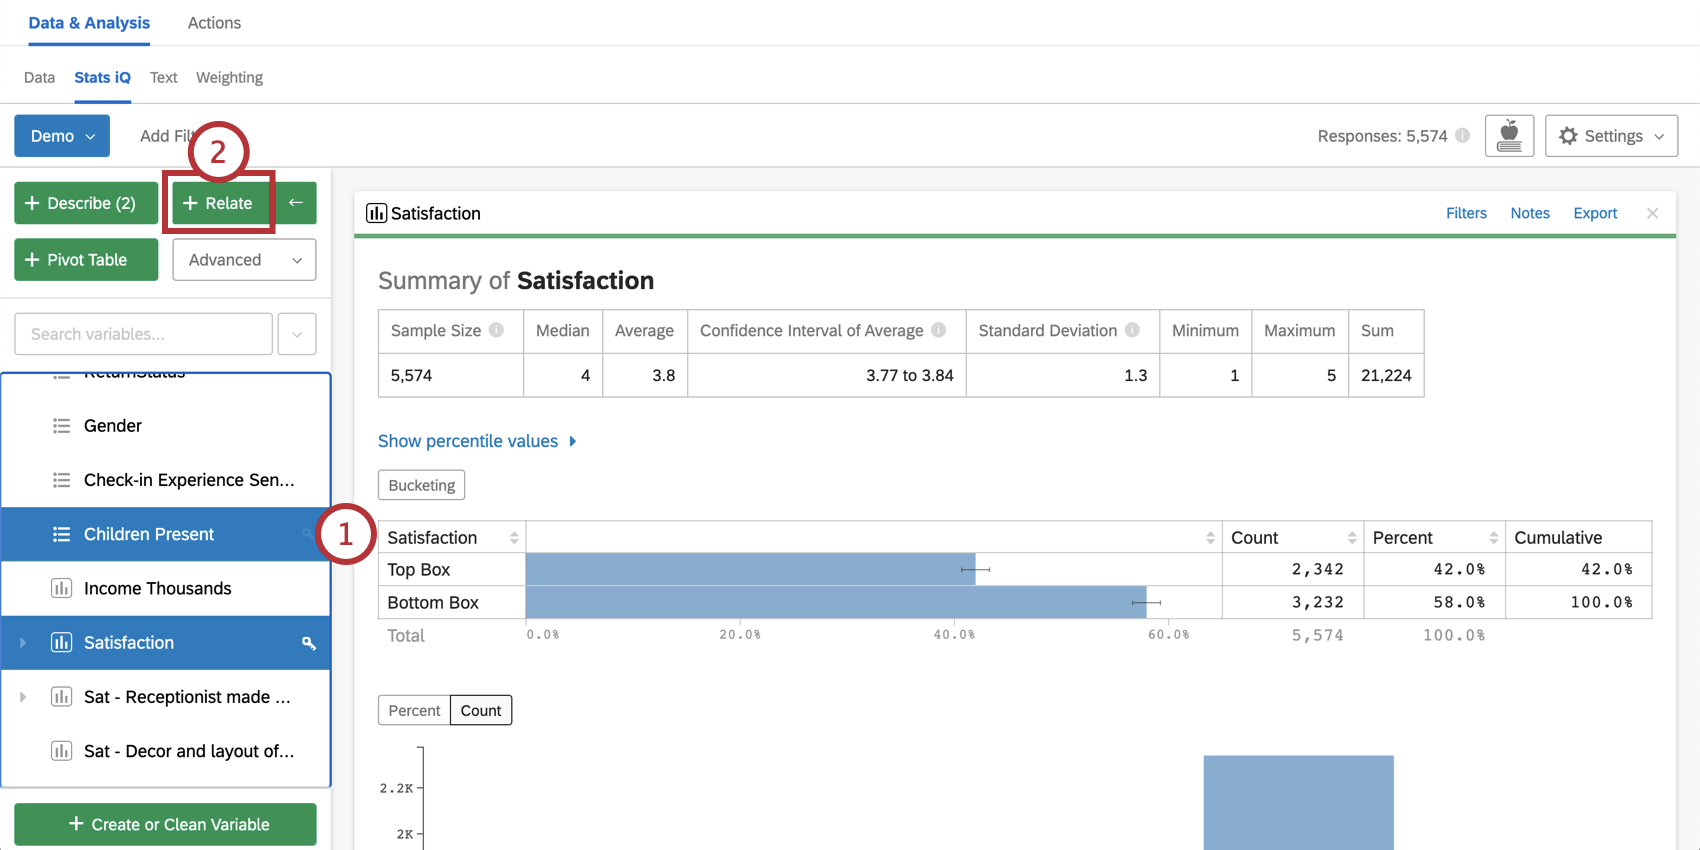
Using Top Box to Relate Two Variables
After Bucketing to apply Top Box to your variable, you can use Relate to analyze and compare the Top Box results between two variables.
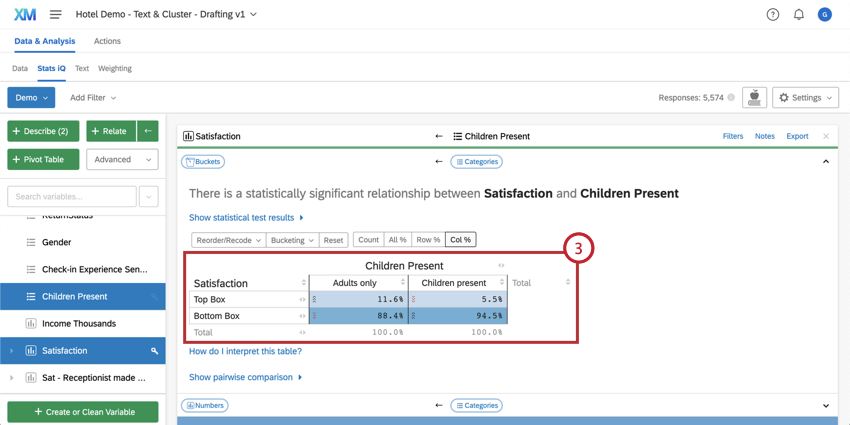
Attention: Once something is bucketed, it will continue to behave as a categorical variable throughout any other analyses that are done in Stats iQ.
FAQs
How do I create a new Stats iQ variable?
How do I create a new Stats iQ variable?
How can I "recode" values in Stats iQ?
How can I "recode" values in Stats iQ?
For variables that can't be directly recoded, you can recode values for in the Create or Clean Variable menu. In the Create Variable window, use the Logic method to assign numerical values to each existing value for the variable. You can either create a new variable or select Replace Existing Variable in the lower-left corner to update the variable with the new numeric values.
For more information on the Logic method for variable creation, please visit the support page on Variable Creation.
What are the options for analyzing my data in Stats iQ?
What are the options for analyzing my data in Stats iQ?
- Describe: Selecting a variable from the list and then clicking Describe will give you a visualization of the data contained in that variable. Use this when you would like to see how the data for a certain variable is distributed.
- Relate: Selecting two variables and then clicking Relate will run a statistical analysis of the relation between the two variables. Use this when you would like to know how strongly two variables are correlated.
- Pivot Table: Selecting two or more variables and clicking Pivot Table will create a table that displays the values of the variables as rows and columns. The cells can be set to display a variety of different information including column and row percentage, Sum, and Variance. Use this when you would like to compare the overlap between specific values of a set of variables.
- Regression: Selecting two variables and clicking Regression will give the mathematical relationship between the variables. Use this when you would like to predict values for one variable based off of the values of another.
- Cluster: Selecting two to ten demographic variables and clicking Cluster will display groupings of traits most likely to occur together, thus revealing the population segments captured in your data.
What do the different variable types mean in Stats iQ?
What do the different variable types mean in Stats iQ?
I don't know what this statistical term means. Can you tell me?
I don't know what this statistical term means. Can you tell me?
- Statistical tests: ANOVA, T-test, and Chi-squared are all statistical test that Stats iQ performs to test whether or not the relationship between two variables is significant. These tests are used to generate a P-Value.
- P-Value: This value represents the probability that the observed results would be seen if no correlation between the variables exists. A lower P-Value means more correlated data.
- Effect Size: The effect size is a measure of how large the correlation between two variables is. This is measured in different ways depending on the type of the statistical test performed. Examples are Cohen’s d, Pearson’s r, and Cramer’s v. The larger the effect size value, the more correlated the variables are.
How do I filter the data that appears in Stats iQ?
How do I filter the data that appears in Stats iQ?
How do I get my new responses to show up in Stats iQ?
How do I get my new responses to show up in Stats iQ?
What’s Stats iQ? / Where’s Statwing?
What’s Stats iQ? / Where’s Statwing?
What do I do if my data isn't loading properly?
What do I do if my data isn't loading properly?
That's great! Thank you for your feedback!
Thank you for your feedback!