
Stats iQ Variable Creation
What's on this page
Warning: Variables created in Stats iQ can also be used in Crosstabs. However, these variables cannot be used in Data & Analysis, Results-Reports, or Advanced-Reports.
About Variable Creation
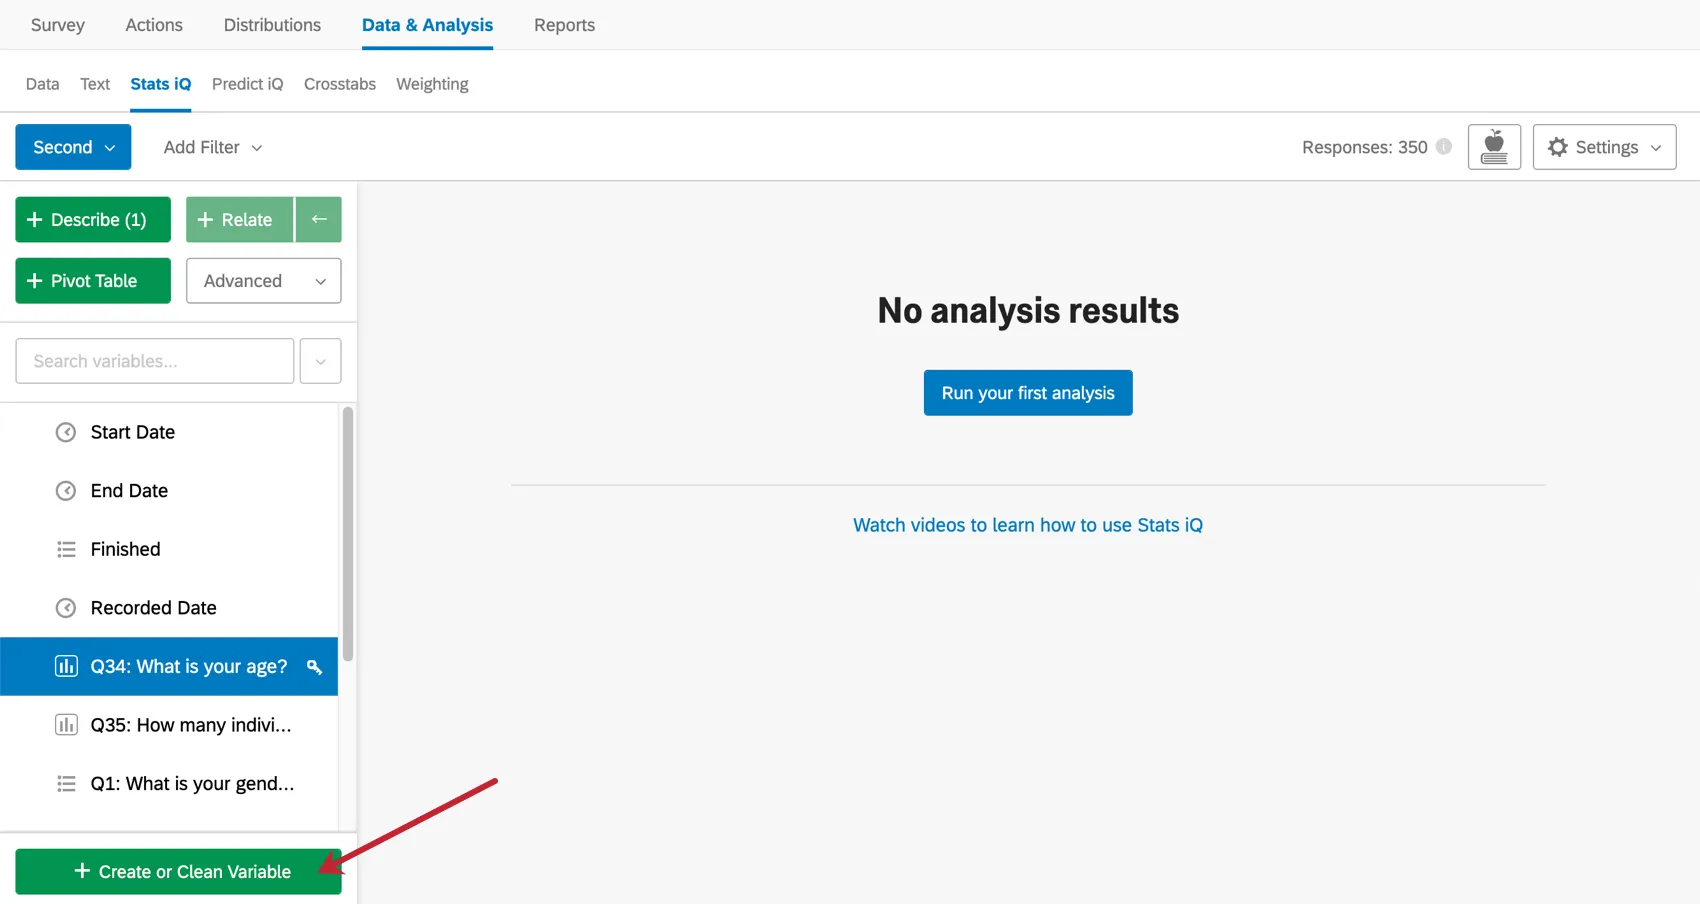
To create a new variable in Stats iQ, click Create or Clean Variable in the lower-left corner. This will open a menu where you can select from multiple methods for creating new variables.
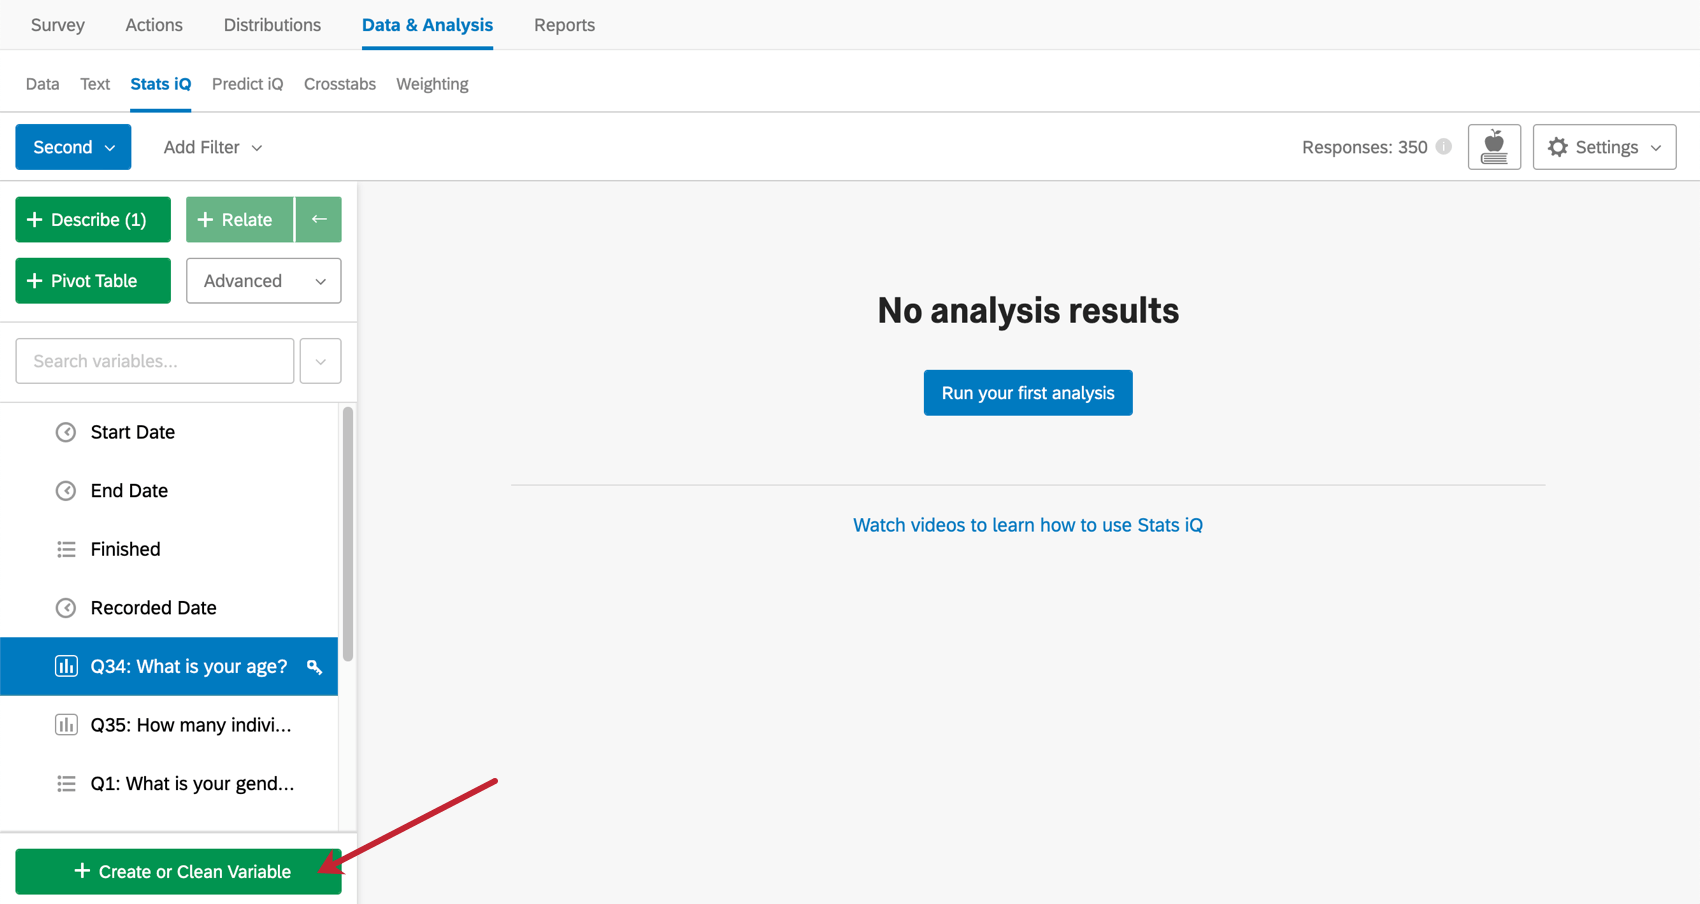
You can also use this menu to update an existing variable. To do this, check Replace existing variable in the lower-left corner and choose the variable you would like to replace with the updated version.
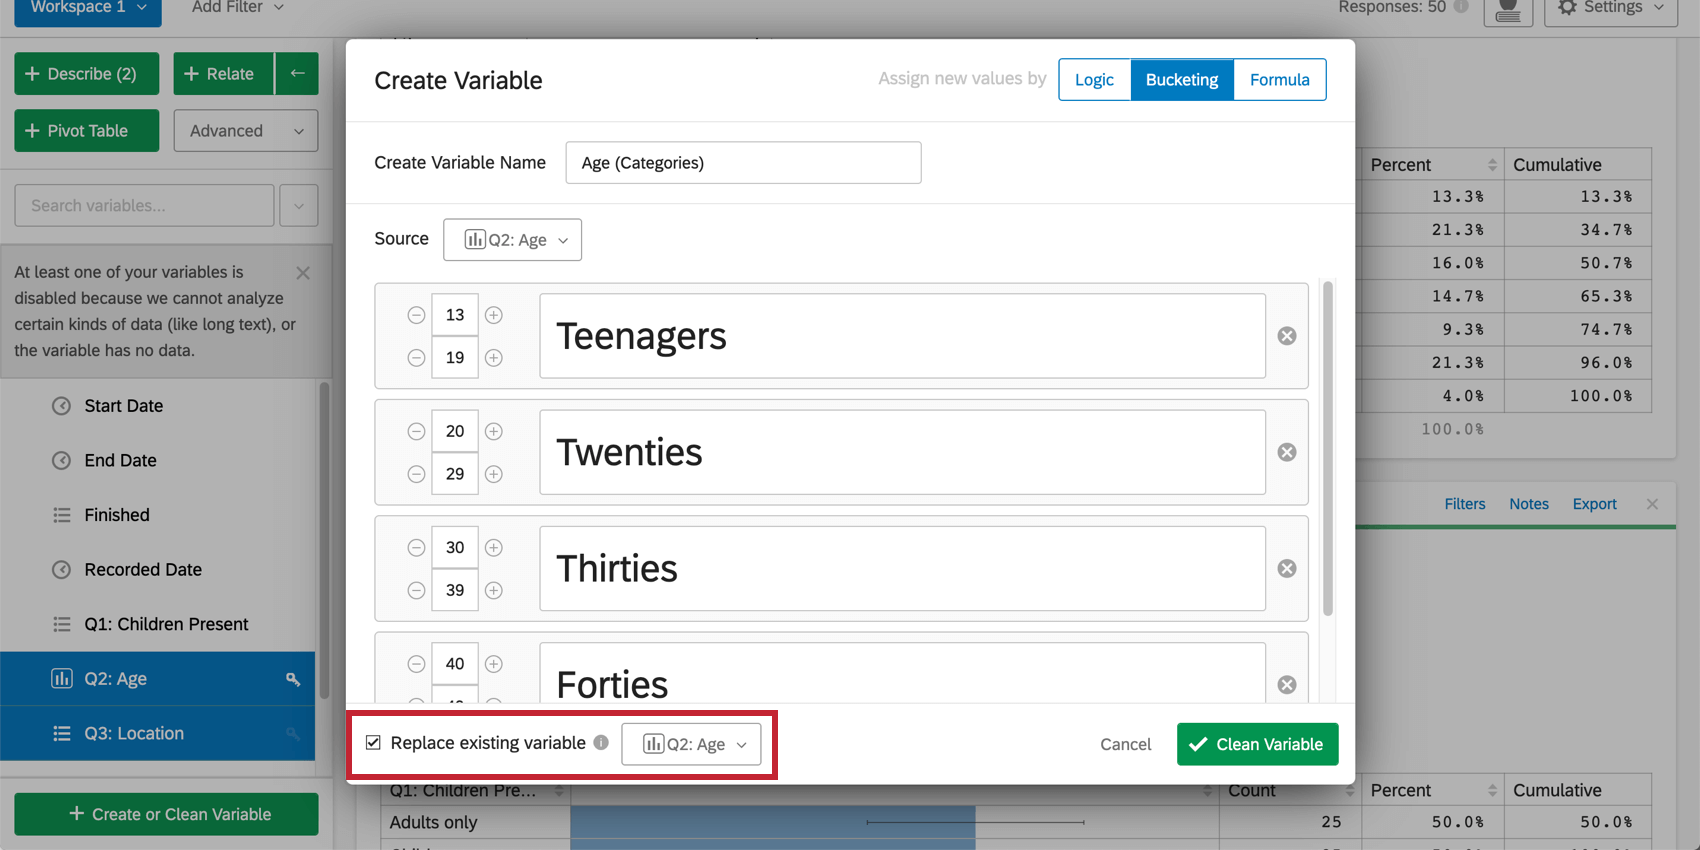

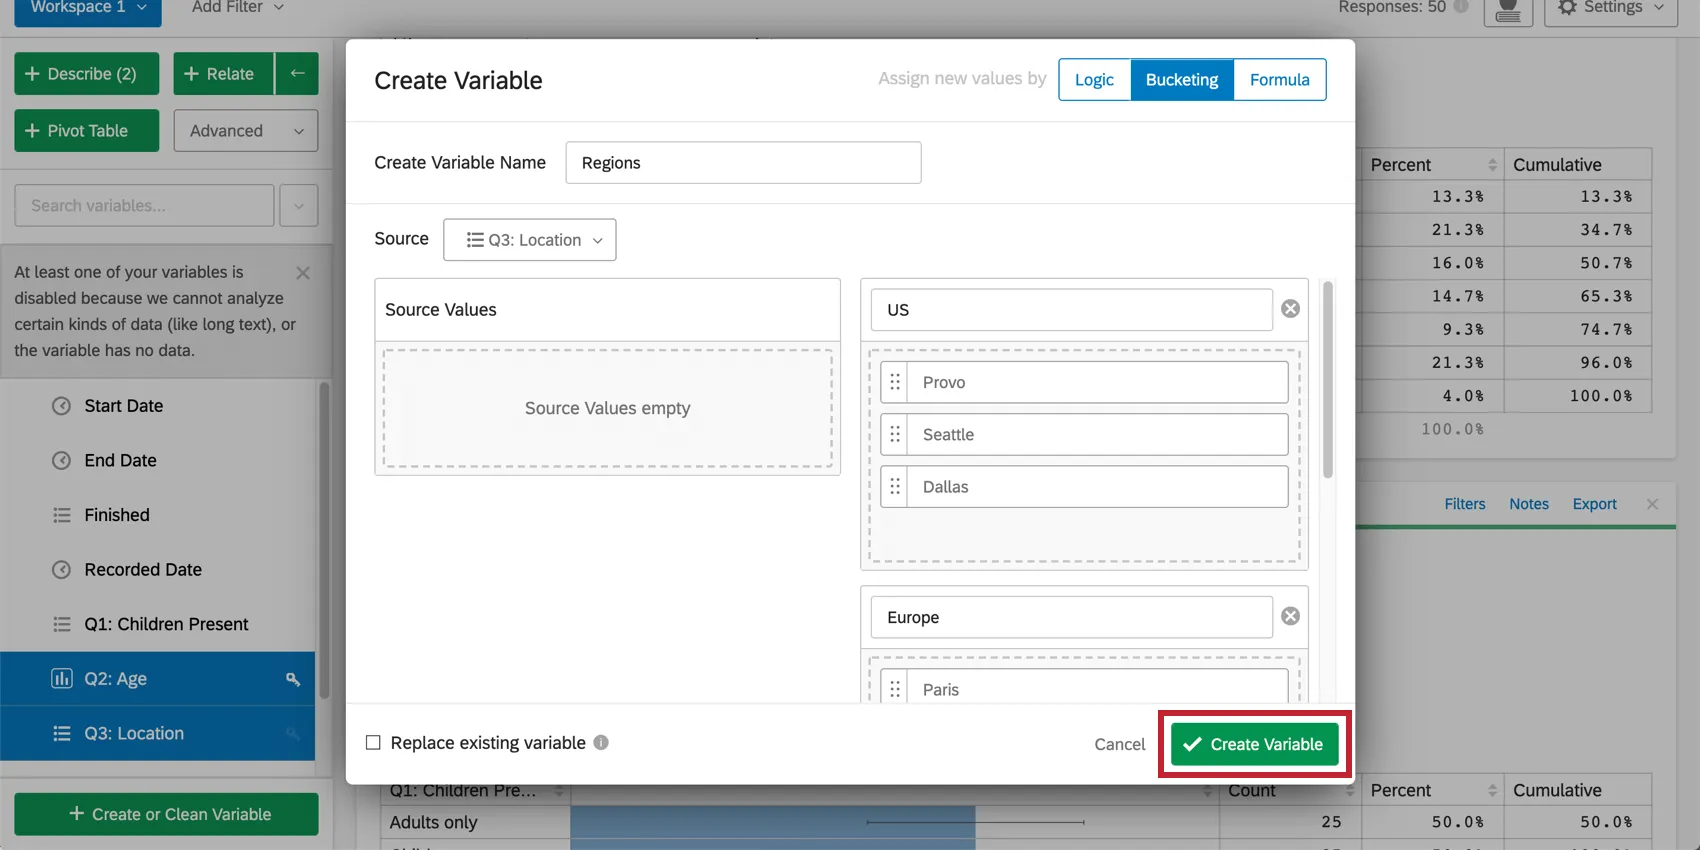
Once you have named the new or updated variable and set the conditions under which its value will be assigned, click Create Variable (or “Clean Variable”). The new variable will appear in the variable pane and can be selected for use in analysis.
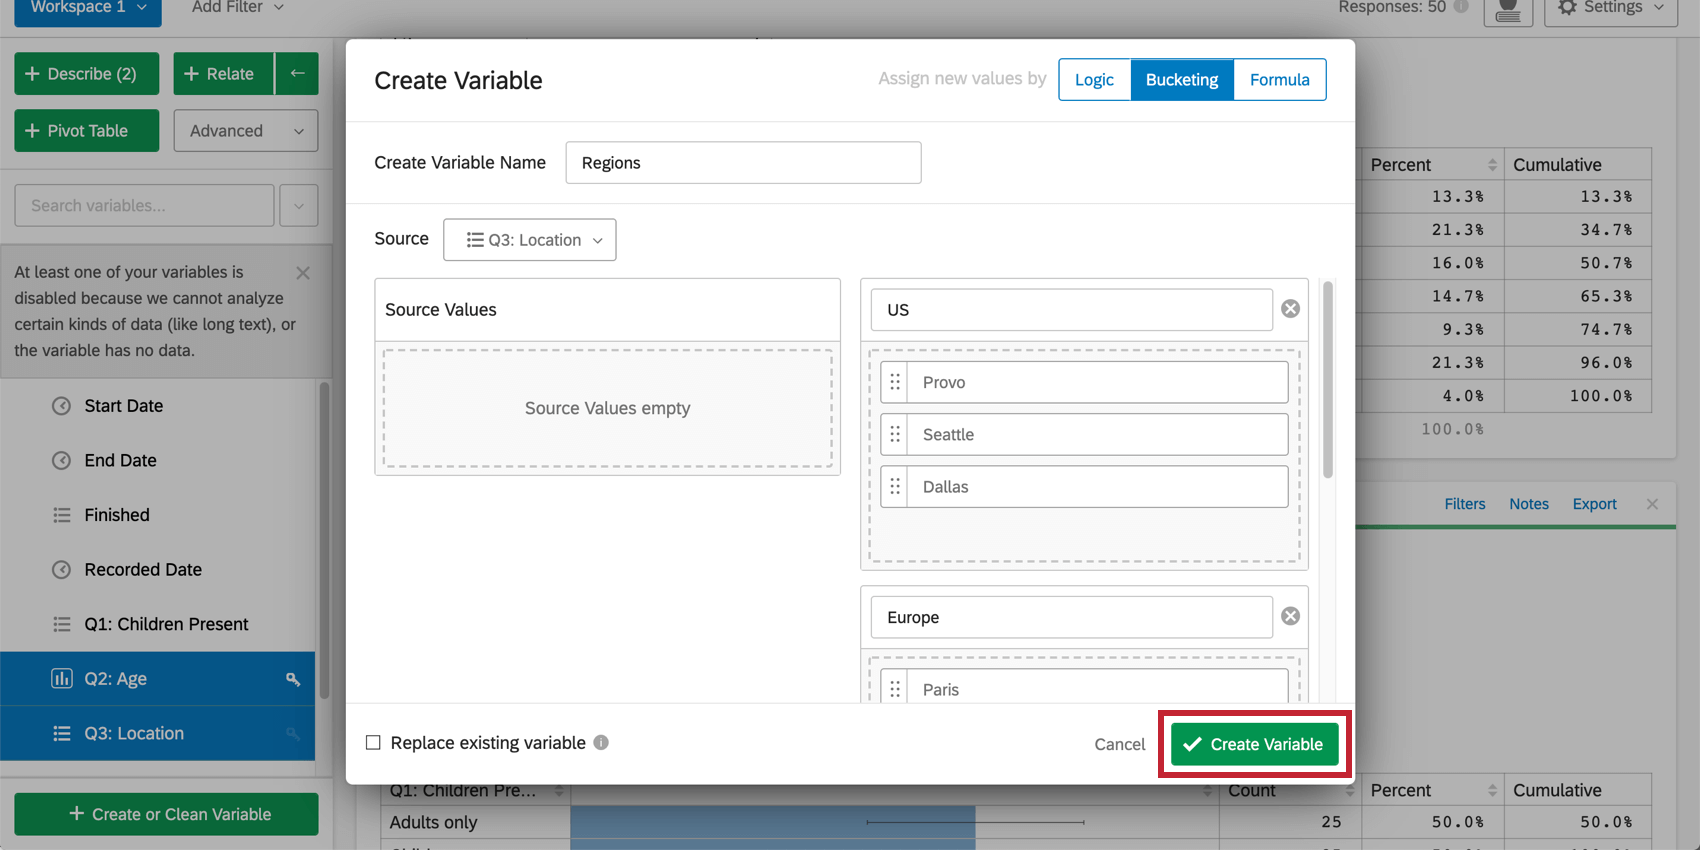
Qtip: After creating your custom variable, you can edit the variable’s conditions or delete the variable from the variable settings.
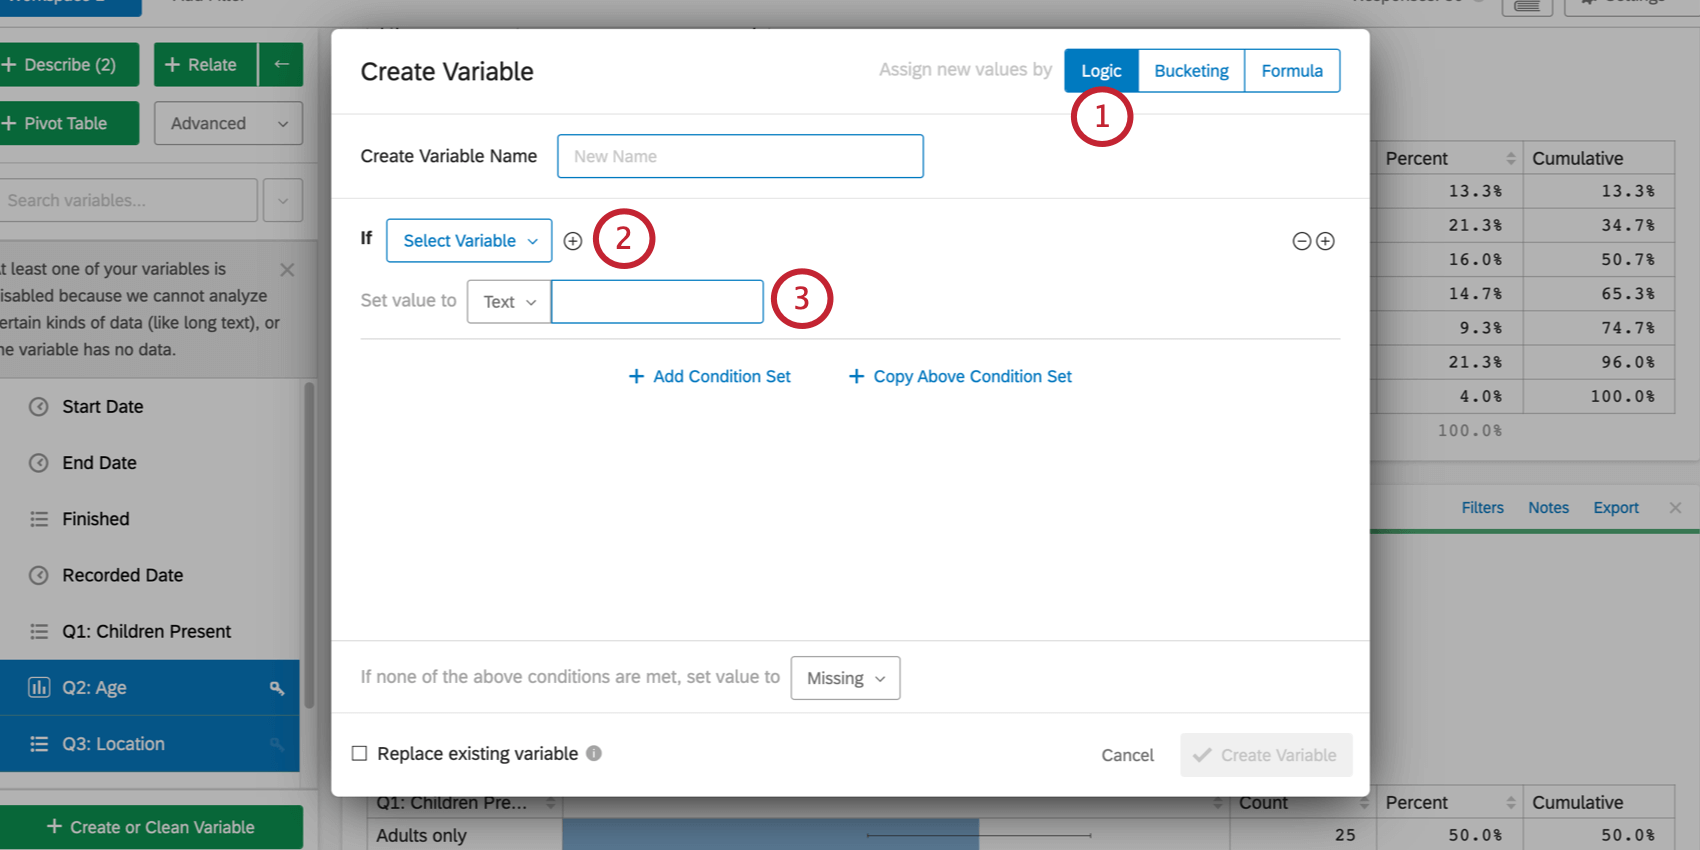
Logic
The logic variable creation method allows you to create a new variable whose values are determined by filter conditions that are based on other variables in the dataset. The filters will determine if a particular value is assigned to the variable. The values themselves can be set from existing variables in the dataset, or can be manually specified.
To create a new variable using Logic:
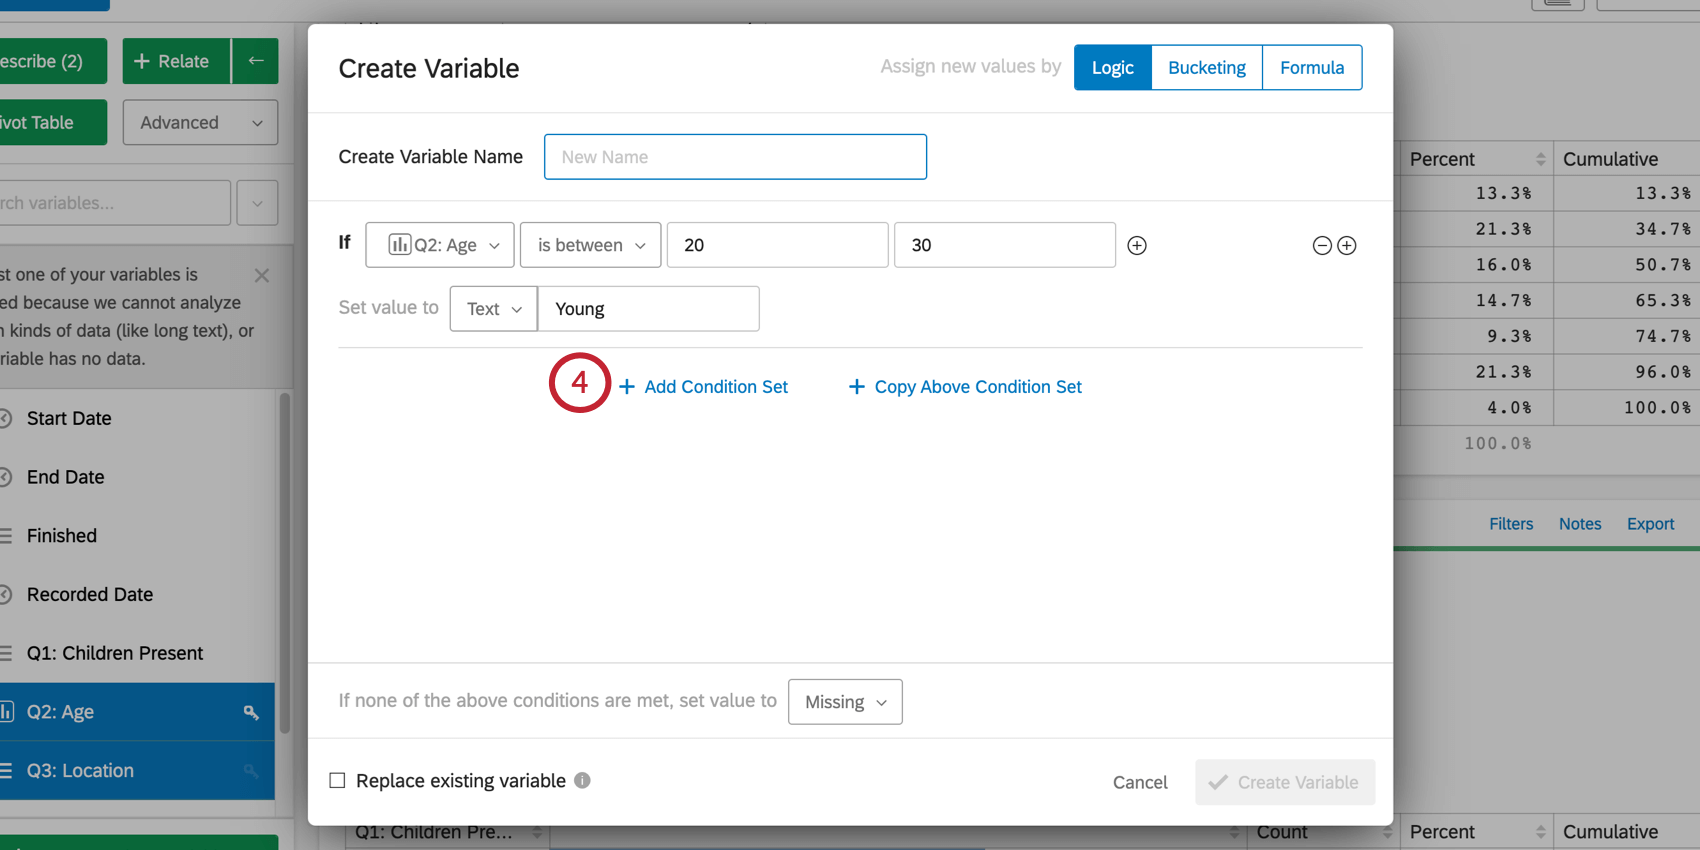
Qtip: If you have multiple condition sets, a response will only be categorized by the first condition set it meets the criteria for.
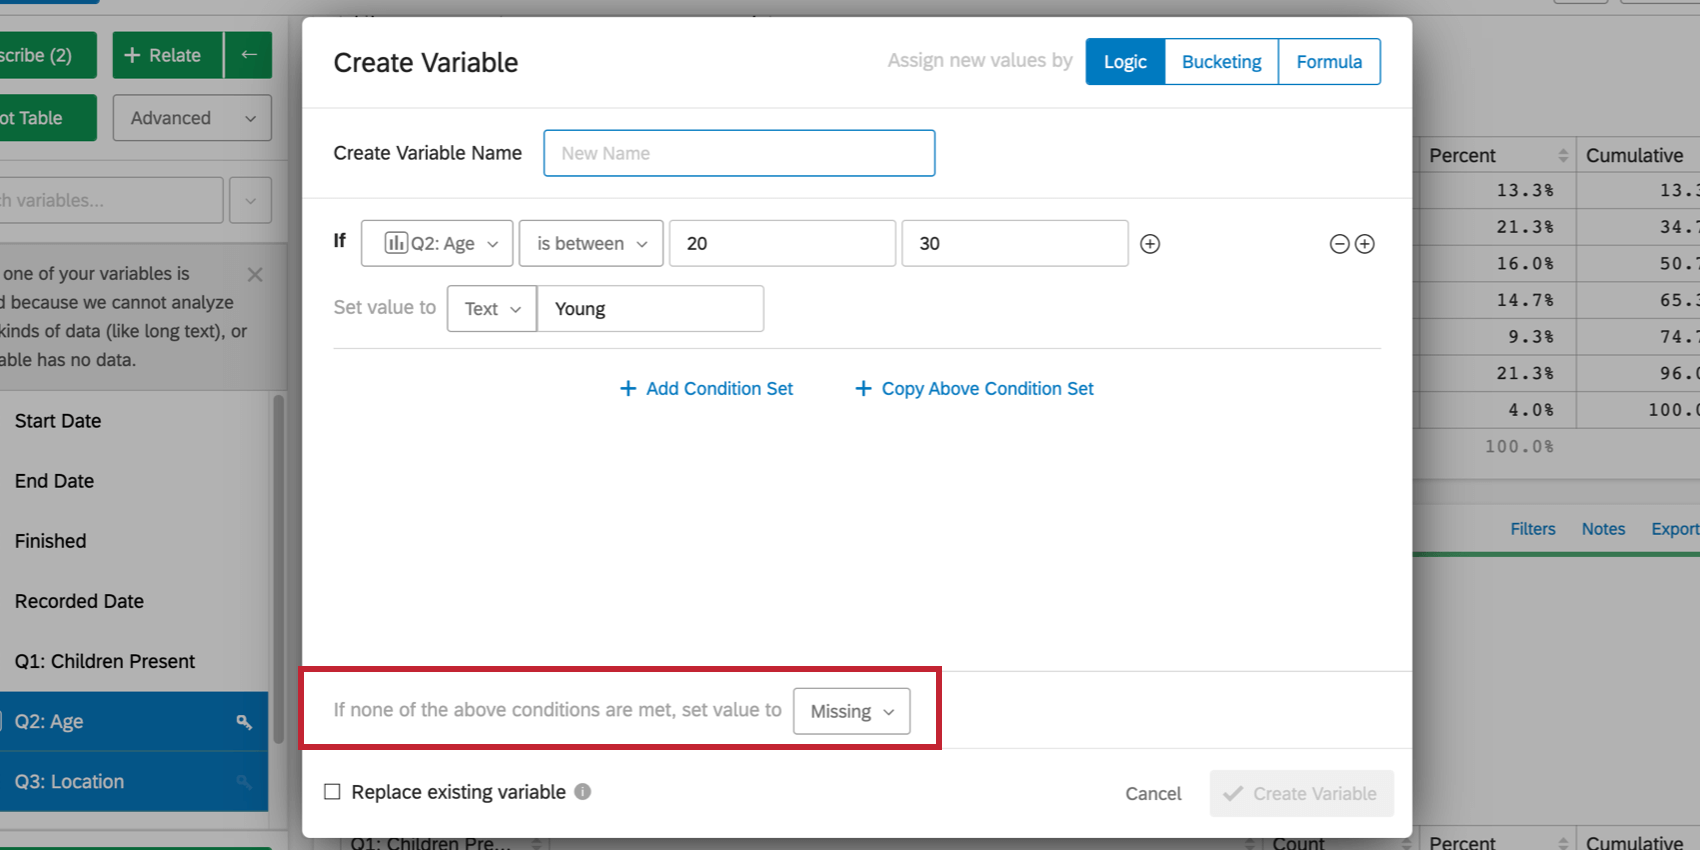
If you think that there will be cases where responses do not fall under one of the specified logic conditions, you can set a specific value for these cases by selecting an option next to If none of the above, set value to at the bottom of the menu. Like the other values for the variable, this value can be set manually or from an existing variable. By default, this is set to Missing, meaning that responses that do not fall under one of the logic conditions will be left blank for this variable.

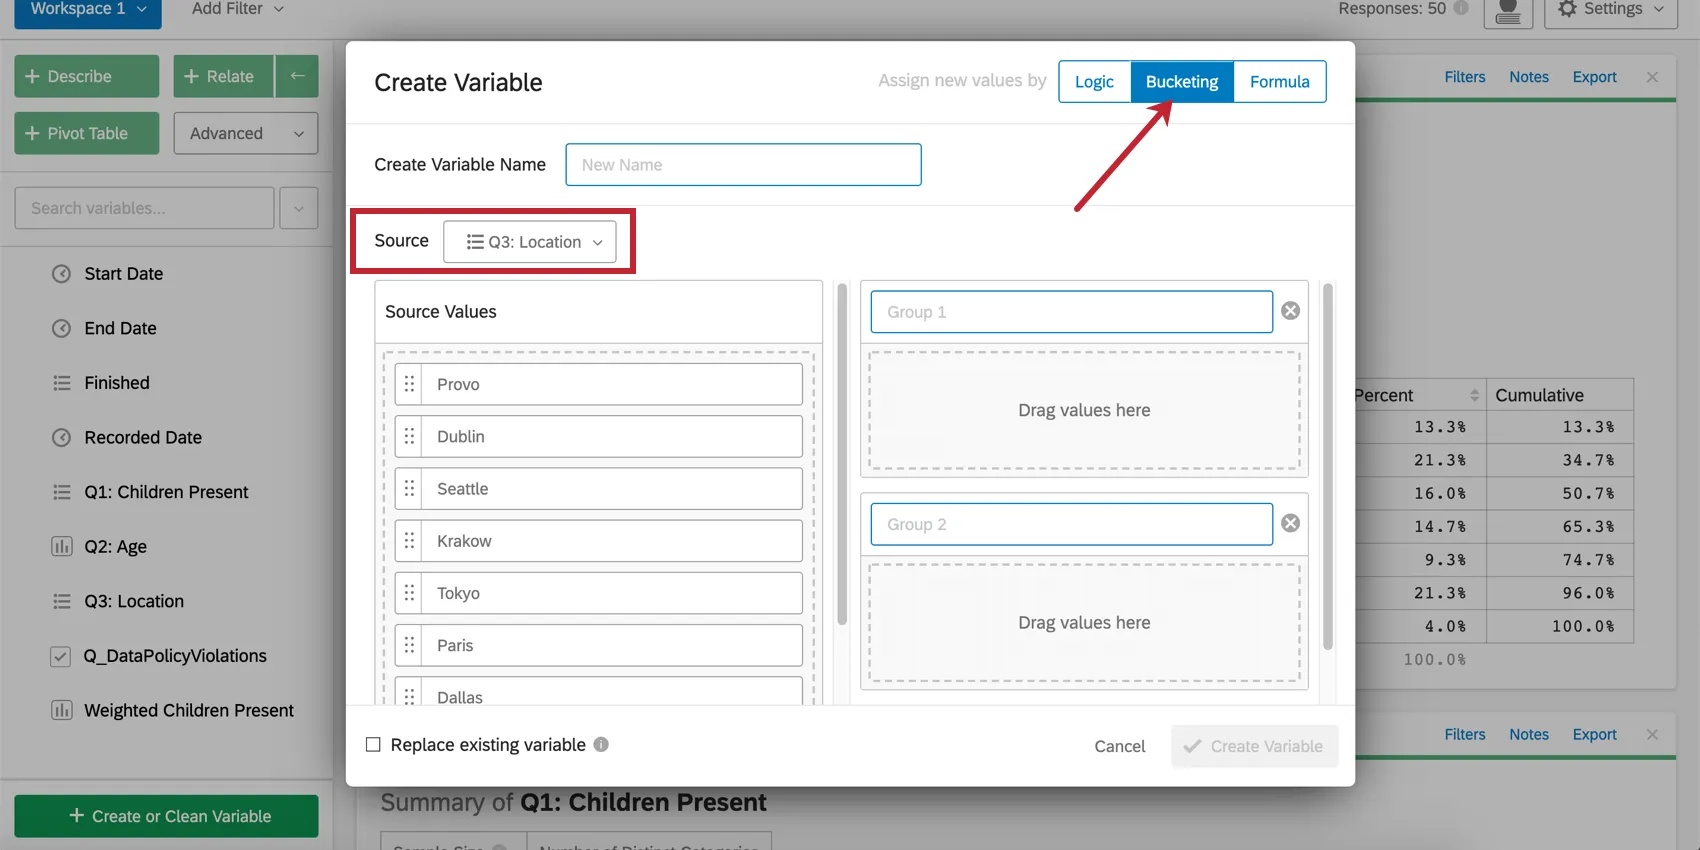
Bucketing
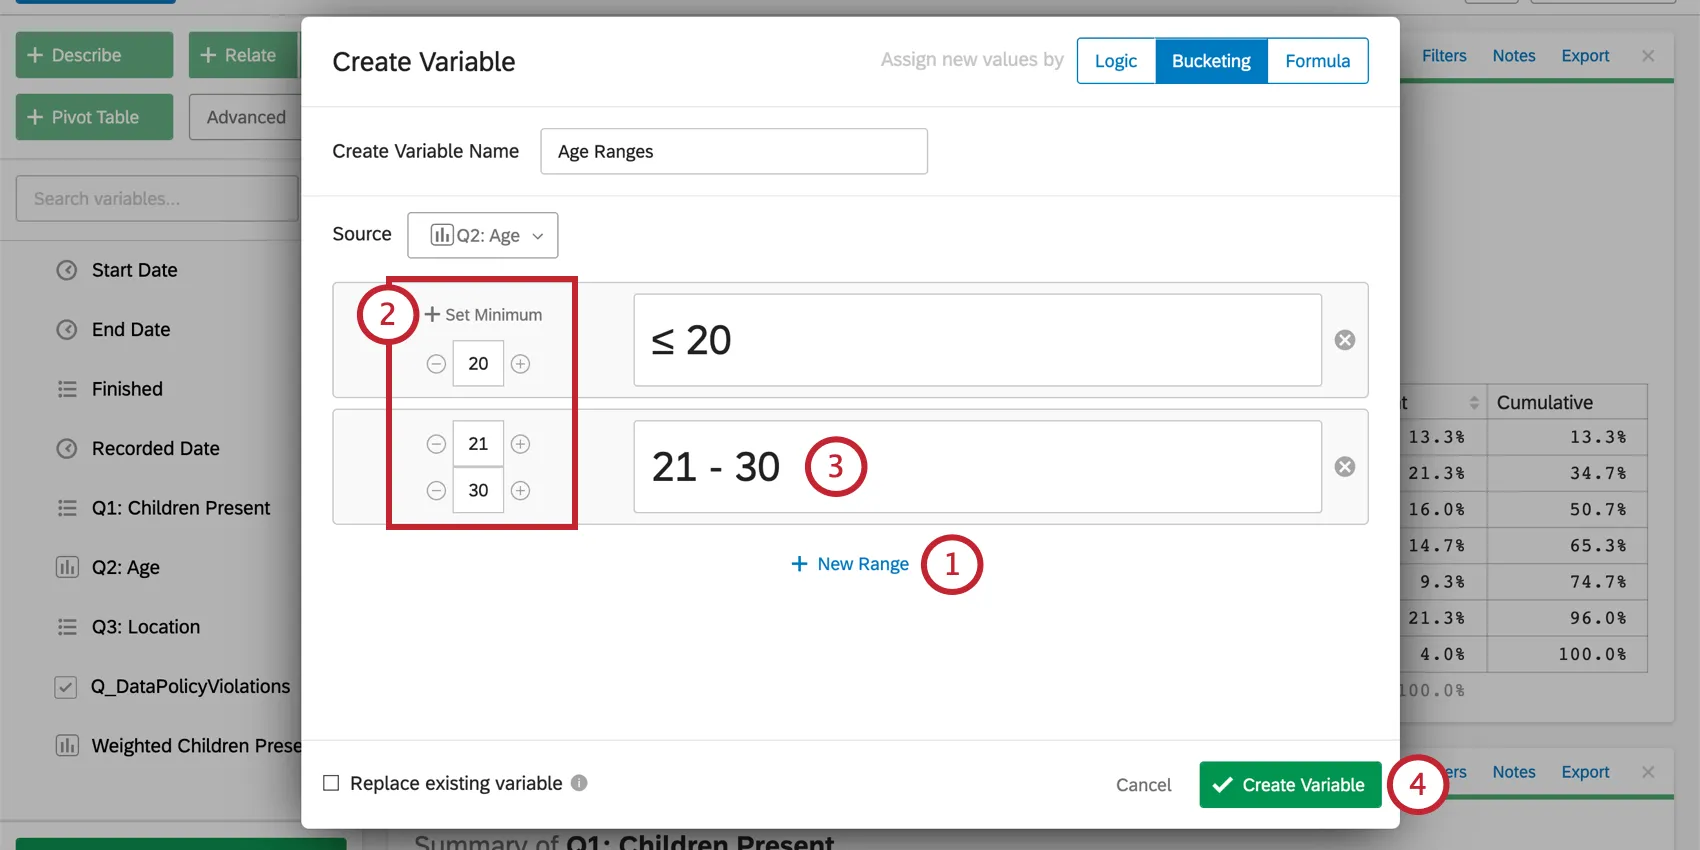
Creating a variable using the bucketing option allows you to group values from an existing variable together. For example, you may wish to group specific age ranges into categories, such as 1-18 = Underage, 18-25 = Young, etc. A new variable will be created that contains these new groups.
To bucket a variable, select Bucketing in the menu. Select the variable you would like to bucket from the Source dropdown.
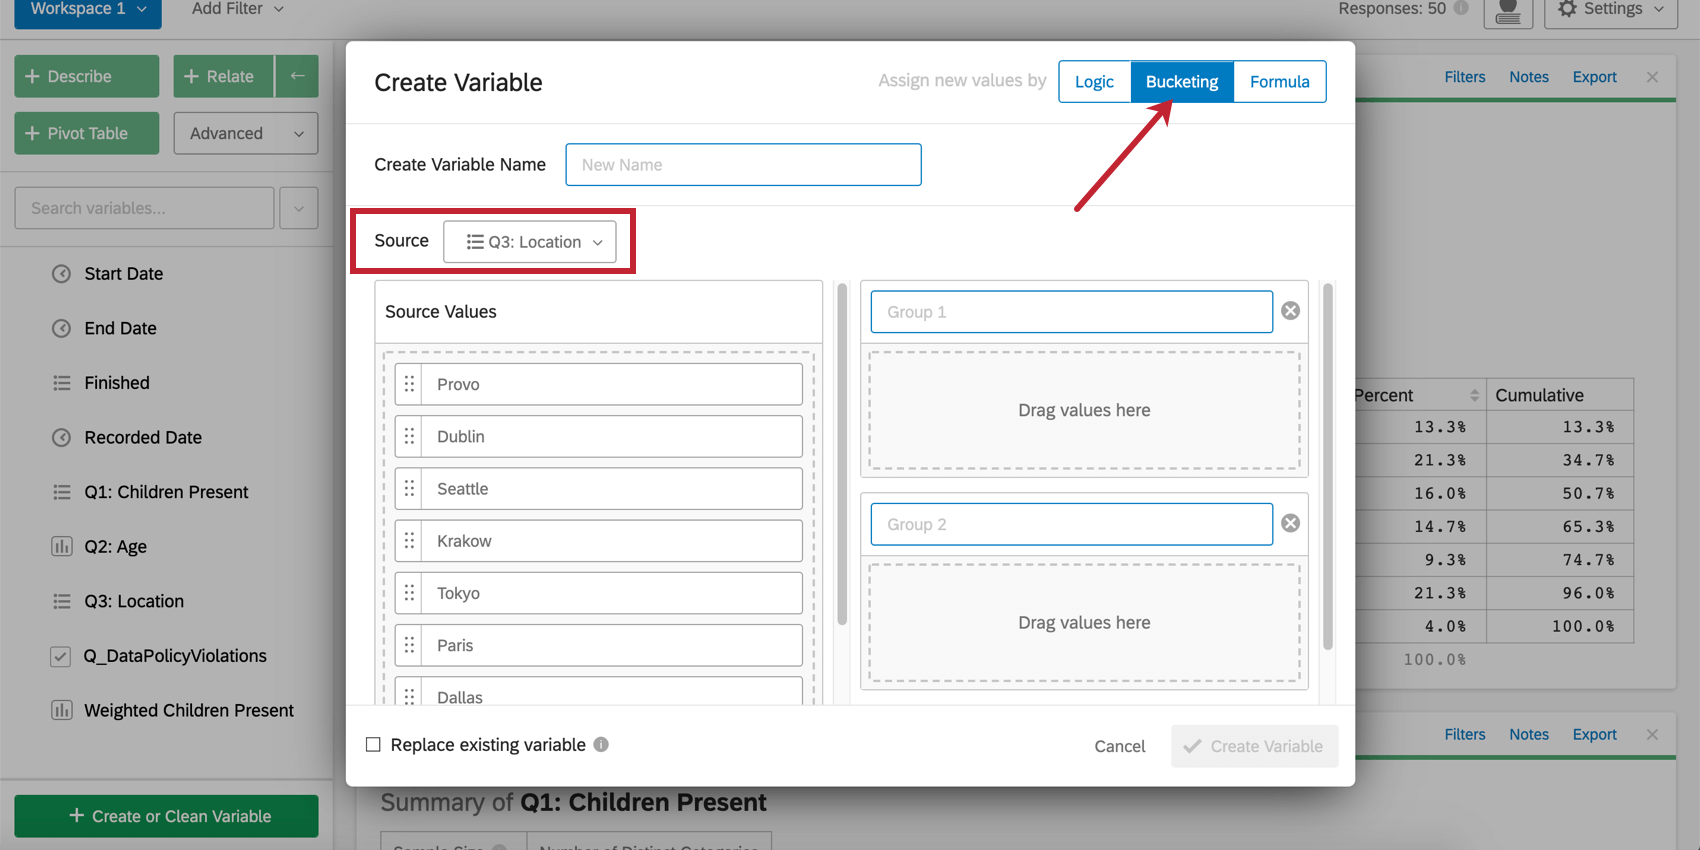
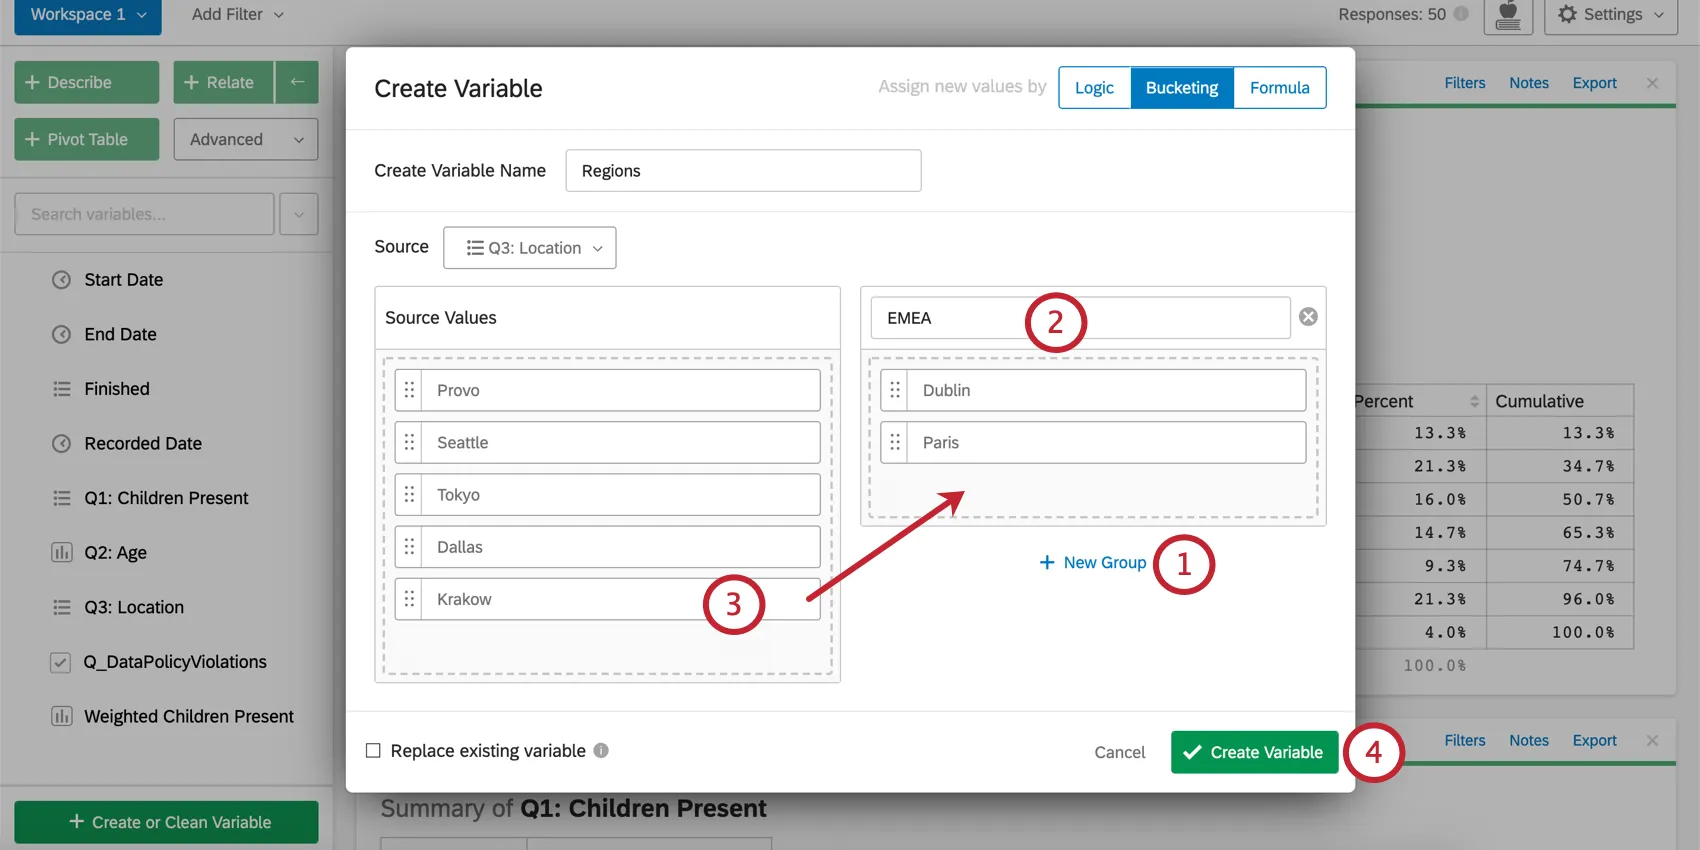
For category variables:
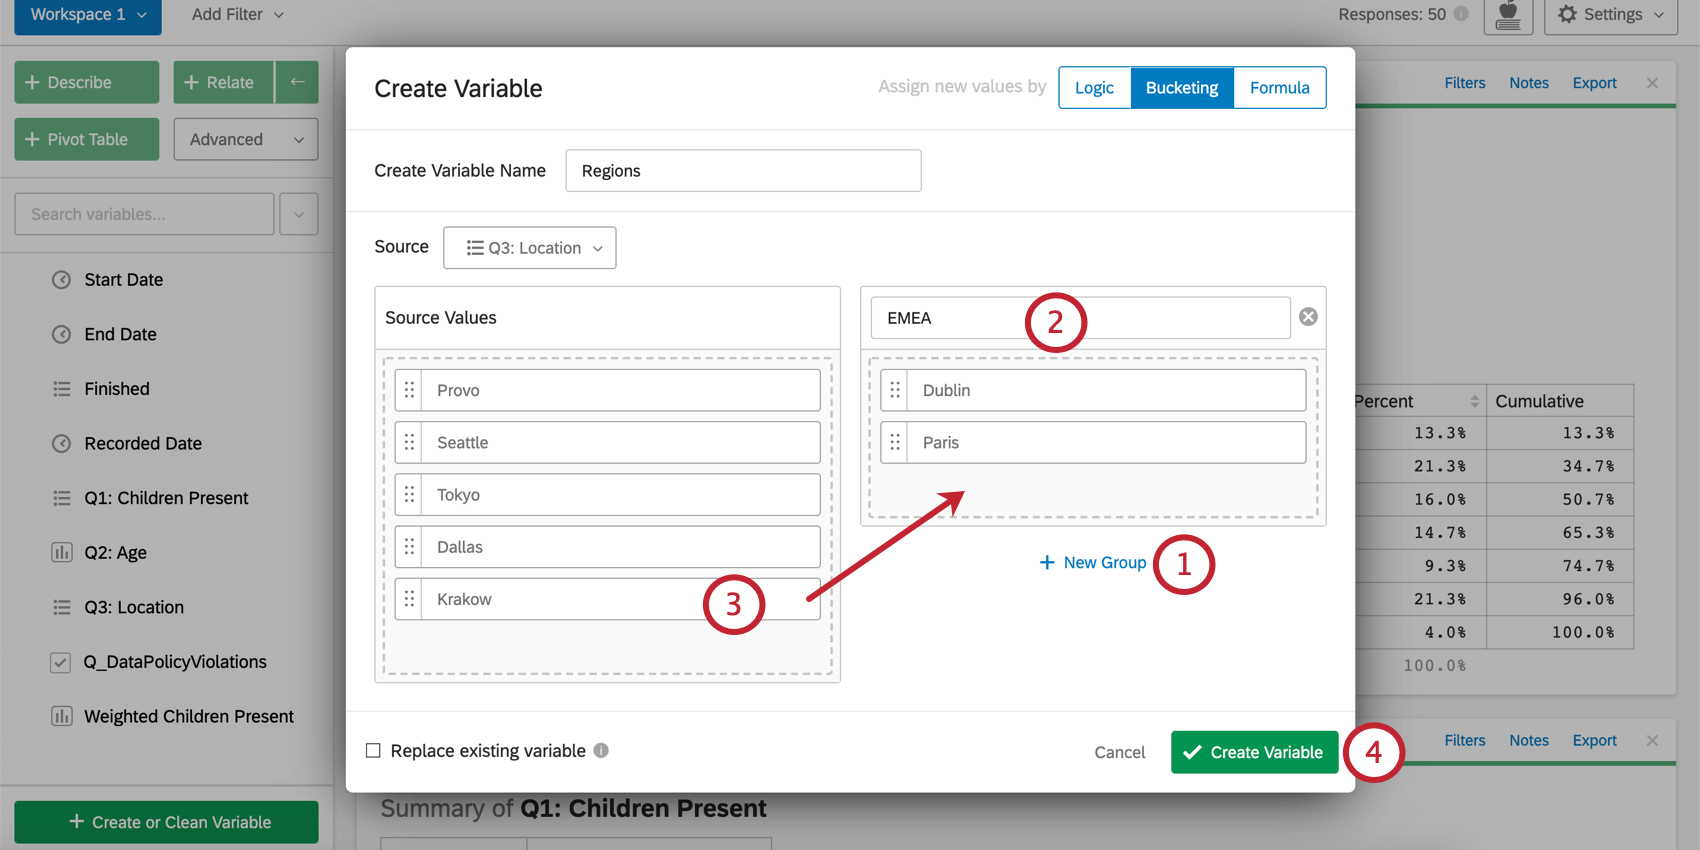
Attention: This feature can also allow you to view the Top or Bottom Box of a variable. For more information, see Variable Creation.
For number variables:
Formula
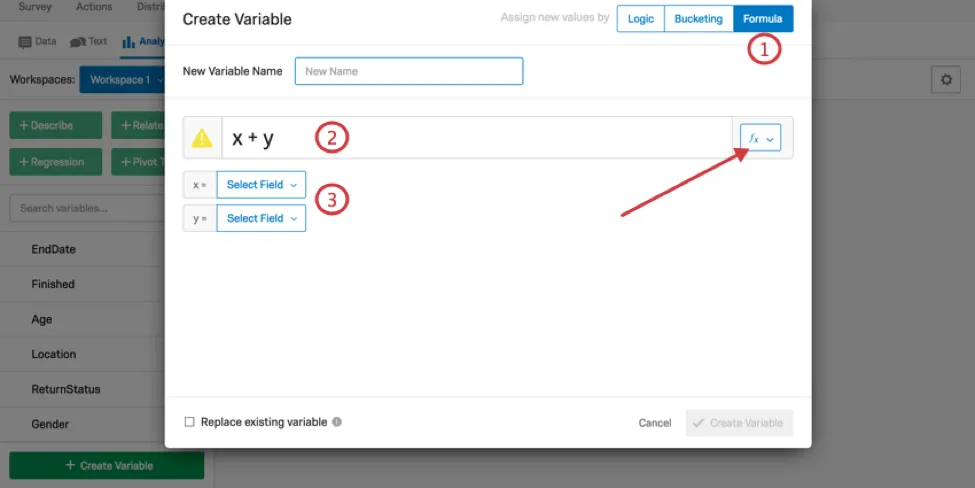
Selecting the Formula option in the Create Variable menu allows you to create or update variables based on a mathematical formula. For example, if you collected a survey participant’s weight and height, a formula could be used to calculate their BMI (Body Mass Index).
To create a new variable based on a formula:
More details on the specific functions available in Stats iQ can be found in the next section.
Details on Formulas in Stats iQ
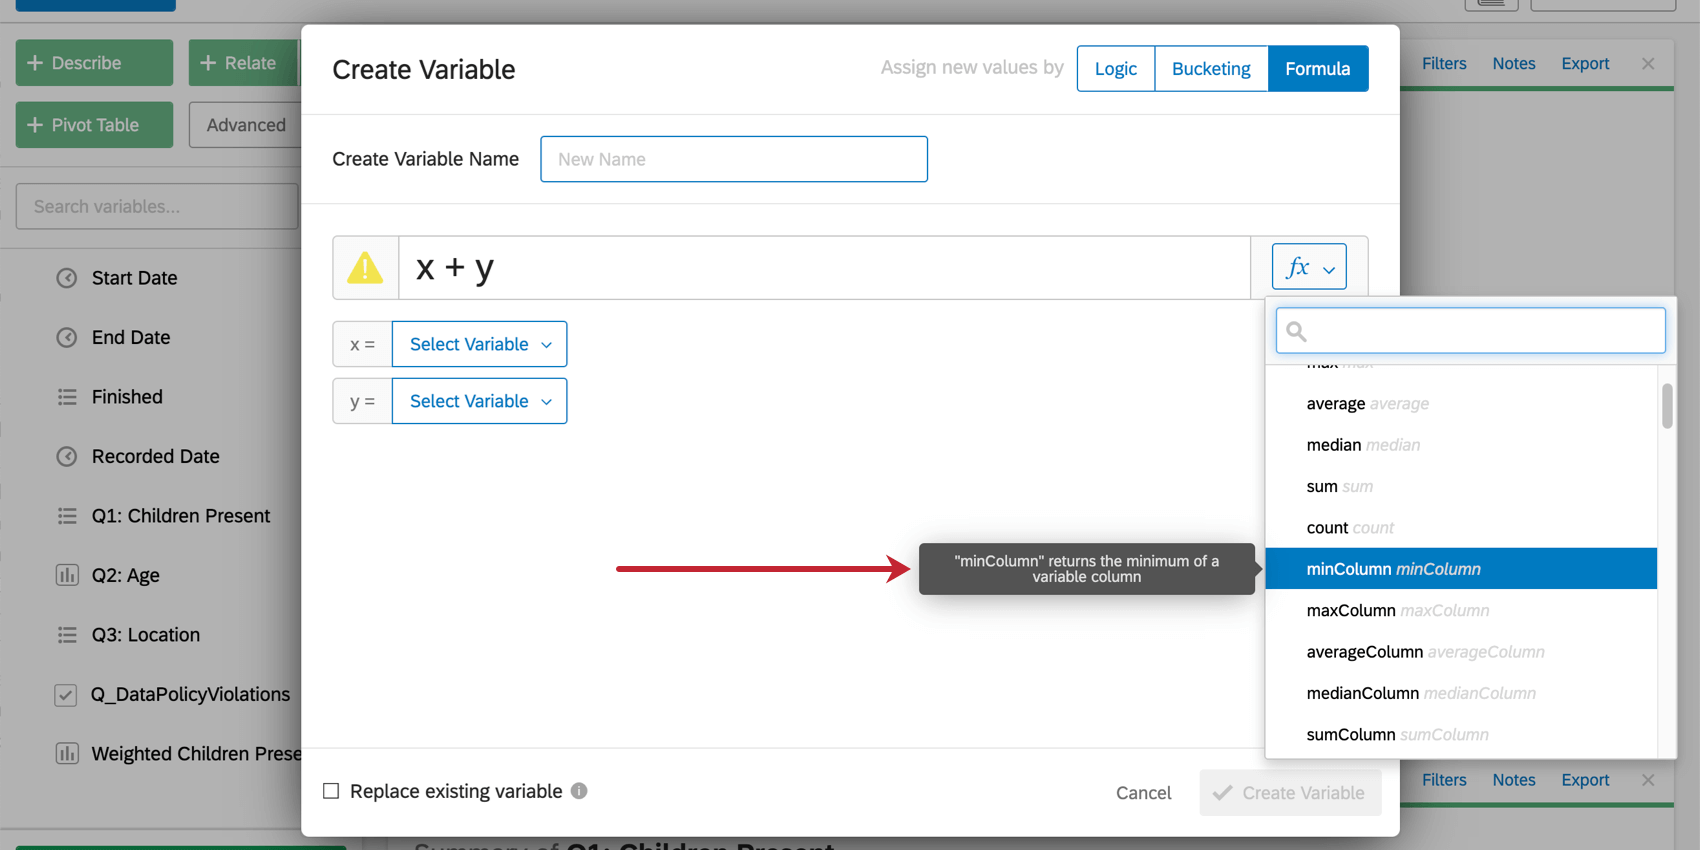
In addition to basic statistical and mathematical functions available in the Formula tab of the Create Variable window, Stats iQ includes a range of other specialty functions to help extract specific data from variables. This section is a reference that lists and briefly describes how some of the more advanced functions operate on the data.
- extract: This function extracts a whole number from the beginning of the variable, e.g. “1-Low” would become “1” when this function is applied.
- extractInner: This function extracts a whole number from the inside of a variable, e.g. “Detractor 5 – Cleanliness” would become “5” when this function is applied.
- extractContinuous: This function extracts a continuous number from the beginning of a variable, e.g “1.53 – Good” becomes “1.53” when this function is applied.
- extractGreedy: This function extracts a whole number from anywhere in a variable, e.g. “prefix 1 suffix” becomes “1” when this function is applied.
- parseDuration: This function parses the duration in seconds from an HH:MM:SS timestamp, e.g. “48:55:33” becomes “176,133 seconds” when this function is applied.
- fill: This function returns the specified variable where blank values are replaced with a specified value, e.g. fill(x,1) will replace blank values in x with 1. Values from other variables can also be used by creating a new identifier, e.g. fill(x,y) will replace blank values in variable x with values from variable y.
Qtip: When you hover over a function, it’ll explain how that function works.

FAQs
How do I create a new Stats iQ variable?
How do I create a new Stats iQ variable?
How can I "recode" values in Stats iQ?
How can I "recode" values in Stats iQ?
For variables that can't be directly recoded, you can recode values for in the Create or Clean Variable menu. In the Create Variable window, use the Logic method to assign numerical values to each existing value for the variable. You can either create a new variable or select Replace Existing Variable in the lower-left corner to update the variable with the new numeric values.
For more information on the Logic method for variable creation, please visit the support page on Variable Creation.
What are the options for analyzing my data in Stats iQ?
What are the options for analyzing my data in Stats iQ?
- Describe: Selecting a variable from the list and then clicking Describe will give you a visualization of the data contained in that variable. Use this when you would like to see how the data for a certain variable is distributed.
- Relate: Selecting two variables and then clicking Relate will run a statistical analysis of the relation between the two variables. Use this when you would like to know how strongly two variables are correlated.
- Pivot Table: Selecting two or more variables and clicking Pivot Table will create a table that displays the values of the variables as rows and columns. The cells can be set to display a variety of different information including column and row percentage, Sum, and Variance. Use this when you would like to compare the overlap between specific values of a set of variables.
- Regression: Selecting two variables and clicking Regression will give the mathematical relationship between the variables. Use this when you would like to predict values for one variable based off of the values of another.
- Cluster: Selecting two to ten demographic variables and clicking Cluster will display groupings of traits most likely to occur together, thus revealing the population segments captured in your data.
What do the different variable types mean in Stats iQ?
What do the different variable types mean in Stats iQ?
I don't know what this statistical term means. Can you tell me?
I don't know what this statistical term means. Can you tell me?
- Statistical tests: ANOVA, T-test, and Chi-squared are all statistical test that Stats iQ performs to test whether or not the relationship between two variables is significant. These tests are used to generate a P-Value.
- P-Value: This value represents the probability that the observed results would be seen if no correlation between the variables exists. A lower P-Value means more correlated data.
- Effect Size: The effect size is a measure of how large the correlation between two variables is. This is measured in different ways depending on the type of the statistical test performed. Examples are Cohen’s d, Pearson’s r, and Cramer’s v. The larger the effect size value, the more correlated the variables are.
How do I filter the data that appears in Stats iQ?
How do I filter the data that appears in Stats iQ?
How do I get my new responses to show up in Stats iQ?
How do I get my new responses to show up in Stats iQ?
What’s Stats iQ? / Where’s Statwing?
What’s Stats iQ? / Where’s Statwing?
How do I create a Progress variable?
How do I create a Progress variable?
What do I do if my data isn't loading properly?
What do I do if my data isn't loading properly?
That's great! Thank you for your feedback!
Thank you for your feedback!