
Transactional Joins
What's on this page
About Transactional Joins
The same survey can be distributed to the same person multiple times with transaction data. Transaction data serves as a history of all of the times a given contact interacted with your company.
When thinking about the customer’s journey with our brand, it’s important to get a holistic view of every touchpoint they’ve had with us. With Qualtrics, you can get transactional data into the same dashboard as your customer survey data, allowing you to combine qualitative and quantitative data into a more insightful analysis.
Example: Create a comprehensive dashboard for your support representatives that shows the customer’s contact profile data, historical transactions, and all relevant ticket data. Put everything from response rates to customer satisfaction scores front-and-center.
In the solution we describe on this page, you’ll join a customer’s transactional data with the corresponding survey data.
Attention: The dataset size has a limit of 20 million transactions.
Step 1: Preparing Transactions
Before you use this solution, you need to already have transaction data saved in XM Directory. For more details, see Transactions.
You also need to make sure that the correct settings are enabled in your directory.
Qtip: You only need to complete this step once per account. Once the data is published and you have access, you can build as many dashboard datasets with transactions as you need.
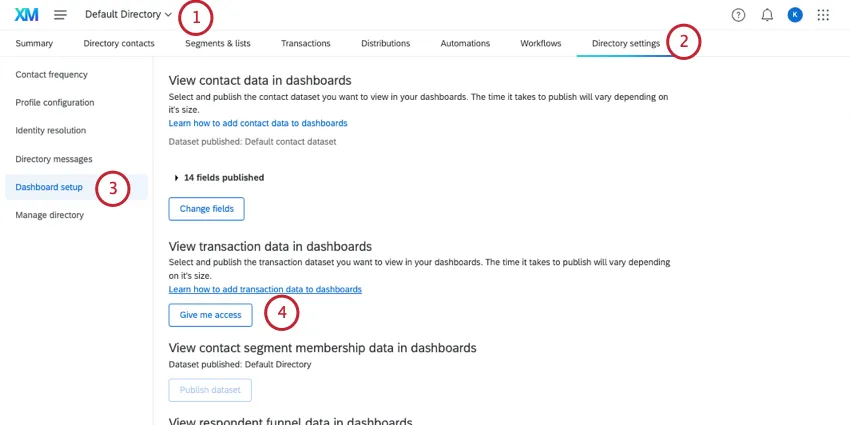
Qtip: If you want to report on transactions from multiple directories, you’ll need to repeat these steps for each directory.
Qtip: If someone if your directory has already published this data, this button will say Give me access. Click this button.
Once the dataset is published, you can edit the transaction fields users with access can report on. This works the same as it does for contact datasets. For steps, see Editing the Contact Dataset.
Step 2: Preparing Survey Data
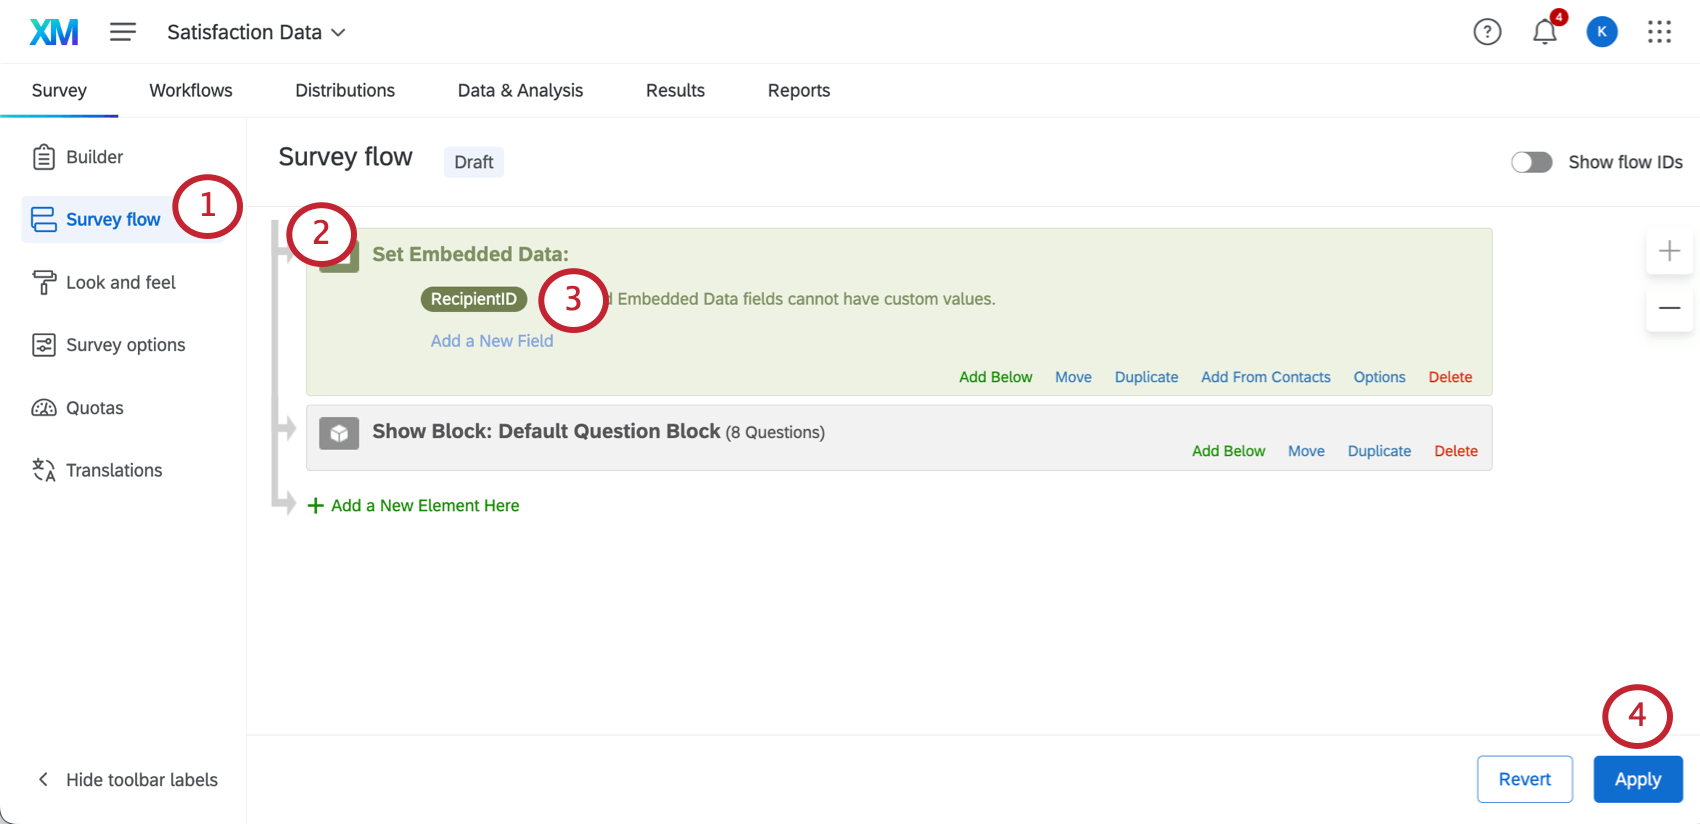
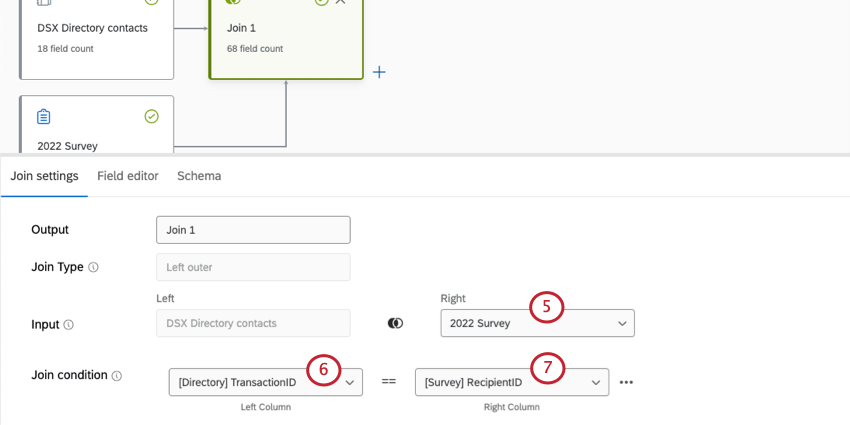
When joining data, it’s important to keep in mind how records are identified so they can be combined together. In other words, how do you know how to connect a person’s directory information with their survey response? This is done by using 1 field that both the survey and directory data have in common, which acts as a unique identifier.
To join transactional data and survey data, you must match the contact’s TransactionID to the survey’s Recipient ID. For this to work, we need to make sure the Recipient ID is saved in the survey.
Attention: Make sure you’re using a survey that was distributed with a contact list, otherwise these steps won’t work. This setup works with surveys distributed through email, SMS, and authenticators, so long as you used a contact list, and your emails and SMS were not sent using anonymous links.
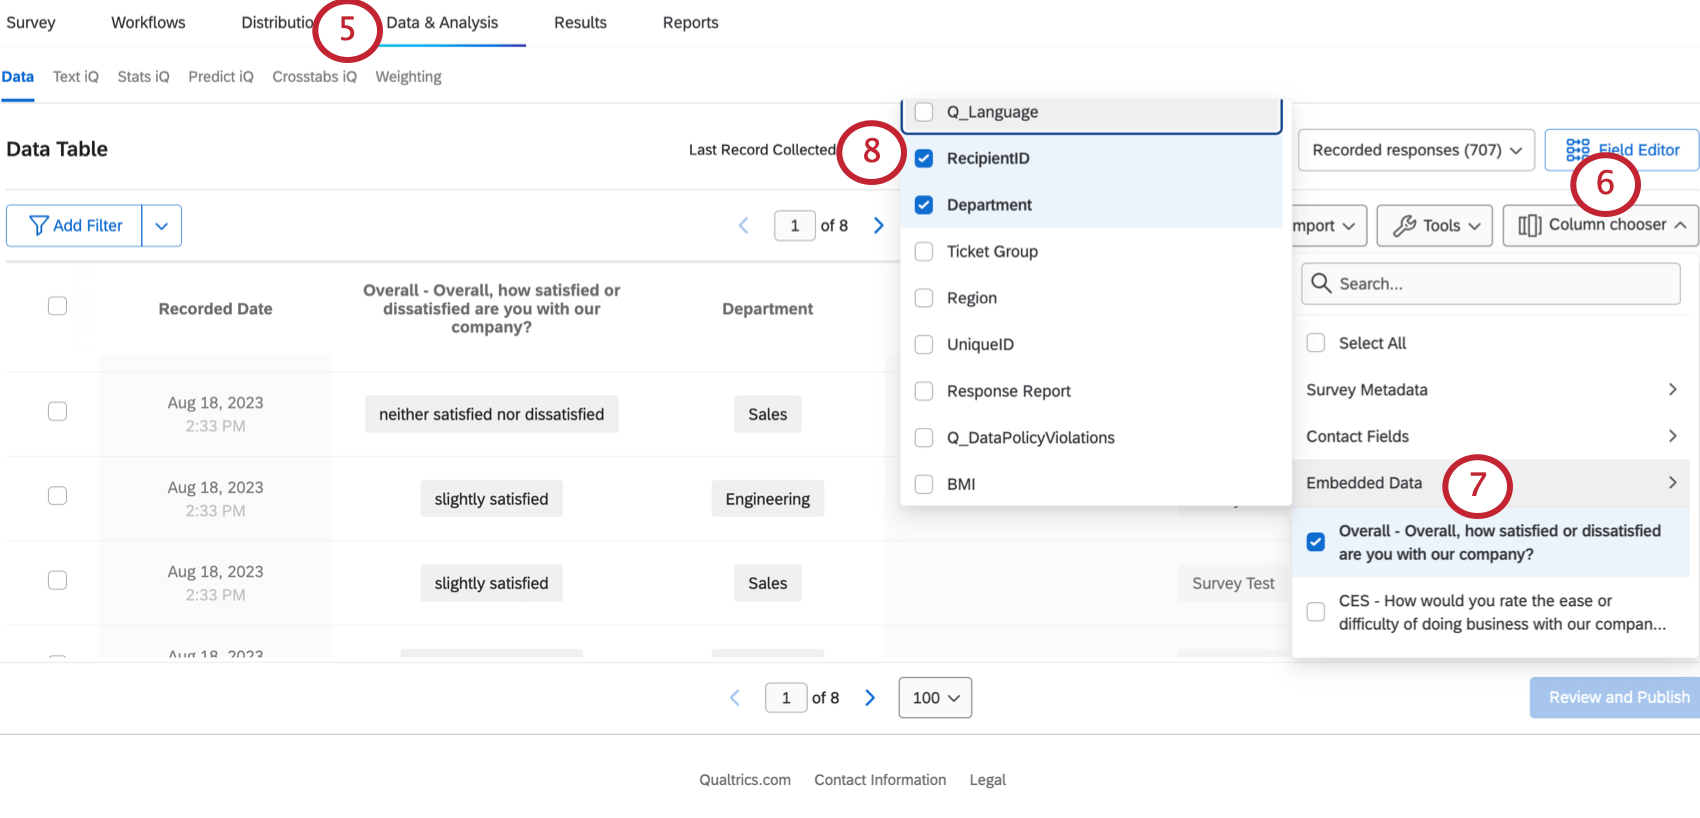
Step 3: Enabling Contact Data
In order to use directory data in CX Dashboards, you need to make it available as a source.
See Using Contact Data as a CX Dashboard Source for detailed steps.
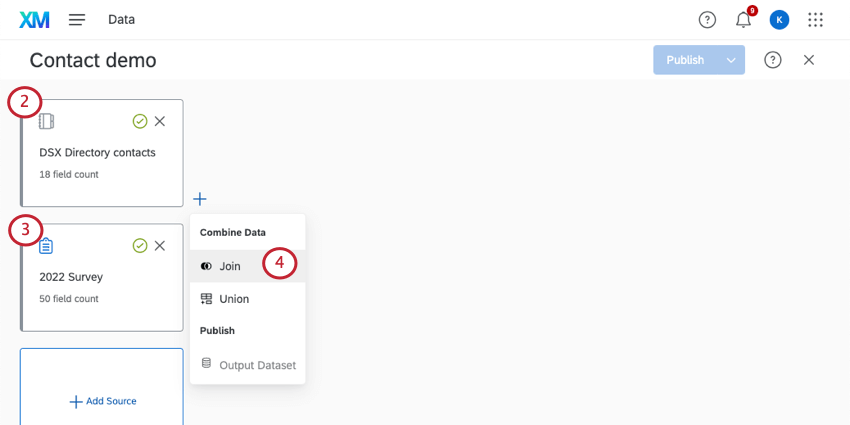
Step 4: Creating the Dashboard Dataset
Qtip: For more information, see Joins (CX) and Creating a Data Model (CX).
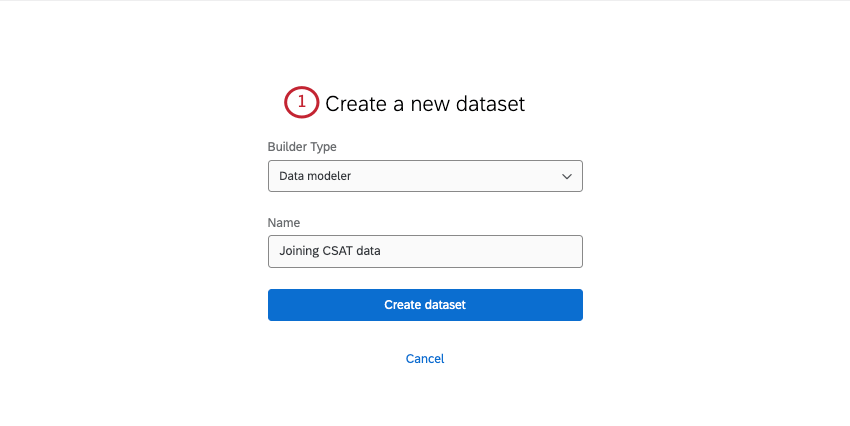
Qtip: Be thoughtful about the fields you include from your contact data source. If there are sensitive fields you don’t want shown to users, consider excluding them completely from the dashboard data or adding them to a separate dataset with limited access.
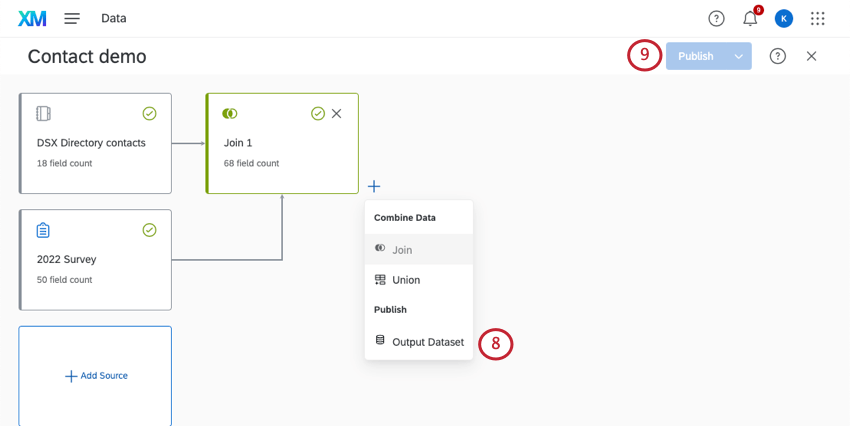
Step 5: Building Dashboards
Once you’ve created your data model and join, you can use it to make a dashboard. See Creating Your Project and Adding a Dashboard (CX).
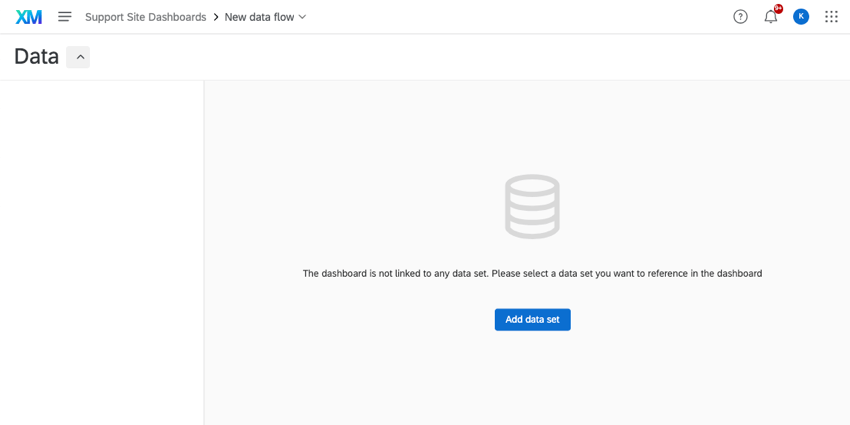

All the data you’ve mapped can appear together on regular dashboard pages. This means you’re free to start building widgets and filters as you normally would, with a mix of both transactional and survey data available for you to work with.
Qtip: If you make an update to your transactional dataset you may not see those changes reflected in your dashboard. In that case, we recommend the following:
That's great! Thank you for your feedback!
Thank you for your feedback!