
What is a survey?
A survey is a method of gathering information using relevant questions from a sample of people with the aim of understanding populations as a whole. Surveys provide a critical source of data and insights for everyone engaged in the information economy, from businesses to media, to government and academics.
What types of surveys are there?
There are four modes of surveys that are commonly used.
- Face-to-face surveys
- Telephone surveys
- Self-administered paper and pencil surveys
- Self-administered computer surveys (typically online)
While surveys vary widely in how they’re conducted, there are a number of common components. Many of these features have been studied in extensive detail by survey methodologists, psychologists, statisticians, and in many other fields of research.
In this article, we’ll go through the fundamentals — from the benefits of online surveys to how to use your results.
Learn about Qualtrics survey software
The benefits of online surveys
Millions of surveys are sent out each year. Online survey software has been the most popular way of conducting survey research for over a decade, and because getting faster insights is imperative to business success, more companies are migrating to digital solutions.
There are several benefits to online surveys over more traditional methods, such as paper surveys, and not just because of the money you can save.
Here are a few of the key benefits you should consider:
More responses, faster
Unlike paper surveys that require you to wait for responses to be posted back, answers from an online survey can be gathered automatically. Survey respondents are likely to respond faster to your online survey too, because they can be completed with a few clicks.
They’re cheaper to run
Online questionnaires are significantly cheaper than traditional surveys. You don’t have to spend money on postage. And you don’t need the same resources and time to input responses on paper questionnaires into your database.
Online surveys are more accurate
Paper surveys have a higher margin for error because answers given via paper forms need to be input manually into your system to be analyzed. With an online survey maker, answers are entered directly into your system.
Results on tap
Survey data collection is much faster online because you don’t have to spend time manually re-entering responses from paper forms into your system, meaning you get real-time analysis of your data that can be broken down and interpreted much quicker.
Reach new audiences
Online surveys can be accessed by anyone, anywhere. This removes the limitations associated with paper surveys that need to be distributed by hand or post. Suddenly, you can conduct more comprehensive research at scale, getting a better understanding of your chosen topic or study globally.
Why create surveys using a survey tool?
It’s easy to create a follow-up or new survey with digital software. Qualtrics offers free survey templates you can download and use immediately. Digital software can save your organization time and money thanks to lower setup and administrative costs. It’s more convenient for the customer or respondent because they can take the survey on whichever digital device is most convenient for them (tablet, computer, mobile device, etc). It’s also more convenient for you, as you just need to send the survey link via email and you’ll have the data in your survey management software as soon as responses come in.
Digital surveys scale, too. You can send a survey to thousands of people and even translate it into multiple languages so a survey respondent can reply with ease (increasing the chance of gaining a reply).
How to create a survey
SURVEY DESIGNERS SHOULD OPERATE WITH TWO GOALS:
- Make completing the response process as easy as possible for all respondents
- Avoid making it easy for respondents to shortcut this process when they are answering questions
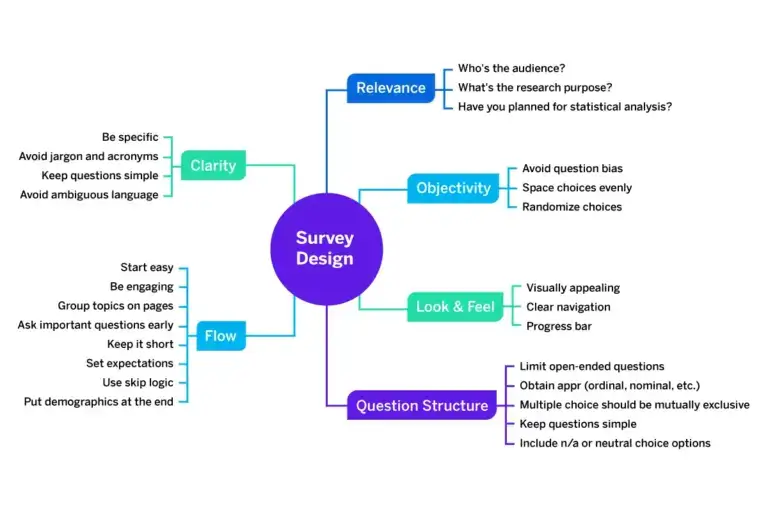
A good survey is only as good as its design, so it’s important to be thorough at every stage from your initial idea to final data analysis. By taking the time to plan out your research question and distribution model, you’ll be in the best position to get quality data.
Define your research question and goals
Defining the research question first is important to the success of a survey research project. What are you trying to find out? Do you want to understand what customers think of your latest product or your brand overall? Are you looking at what benefits your employees want, or if your employees are engaged at work through employee engagement surveys?
Without establishing a research question and the metrics you want to measure, a survey will only provide data, not the insights you need to make changes to your processes, product, or services.
Identify who you’ll be surveying
Who should answer your survey questions? Customers, employees, consumers who aren’t using your product? To run a good survey, you must identify this information and understand the best way to reach them (social media, email, your website, etc).
Design and pre-test surveys
Designing the questionnaire and pre-testing it is crucial to getting valid and reliable data. For example, careful survey design and pre-testing can help bring clarity and reduce the chance that respondents may interpret the meaning of survey questions differently.
Select a sample to survey
Selecting a sample is important for collecting valid and reliable data about the population as a whole.
If you’re sampling a large database of customer email addresses and only want one response per household, you should cross-check email addresses against mailing addresses and remove duplicates. Then you should draw a random sample from the remaining email addresses. Use our sample size calculator to determine how many responses you need to be confident in your data.
Another consideration in sampling is that your customers will not be an unbiased population for all types of research. If you’re launching a product for a new segment, your existing market may not be representative of potential buyers so any data gathered from them won’t be beneficial.
Send out your survey
When you send out your survey, it’s important to get responses from everyone in the sample, as this will determine the response rate of the survey. Create a plan to get a great response rate for your survey before you begin distribution so you can hit your target.
You can distribute your survey online using an email survey tool or an email management system (for example, using mail merge with Microsoft Outlook or Google forms).
Analyze the data
It’s often necessary to code and adjust the data before analyzing, particularly if open-ended questions were asked. Qualtrics IQ easily analyses data from open-text responses, giving you actionable insights. Your entire data set can then be analyzed, and you can make a plan for improvements. There are a variety of statistical analysis types that are well suited for survey data. We’ll cover them later in this article.
For more information on how to get started on your survey creation visit our complete guide on creating a survey.
Produce results using the right survey questions
There are more than 100 ways to ask a question. Question types have a direct impact on the survey results. For instance, text-entry questions are most reliable, but also lead to respondent fatigue faster, so you should limit their number.)
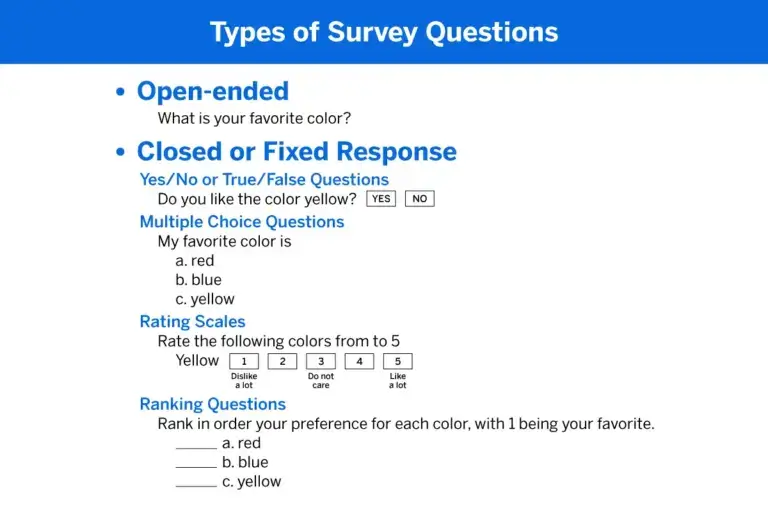
Simple questions are best, but you can pick and choose questions based on what you want to achieve. Here is a list of the most common question types, with example question text:
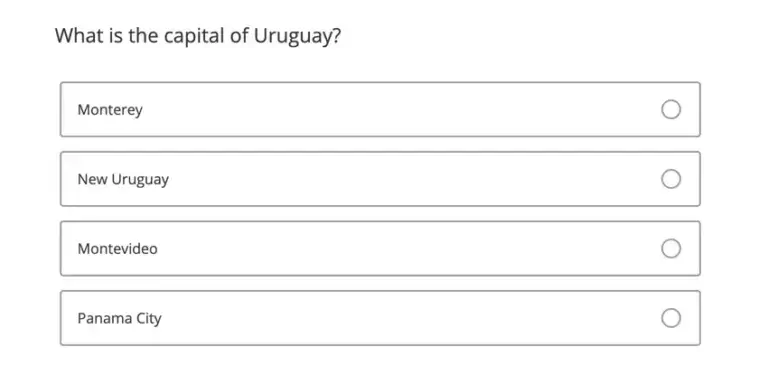
- Multiple choice: Multiple choice questions form the basis of most research. They can be displayed as a traditional list of choices or as a dropdown menu, select box, etc.
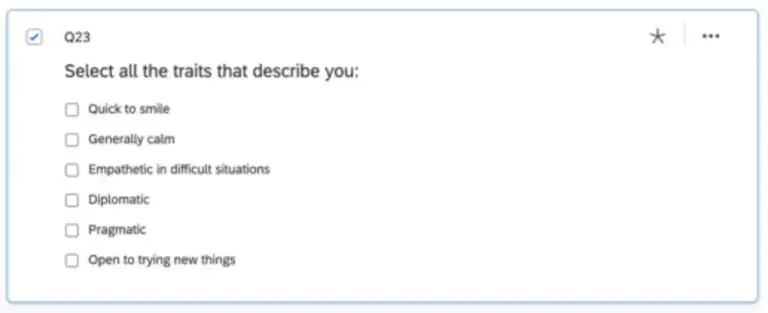
- Multi-select: Multi-select is used when you want participants to select more than one answer from a list.
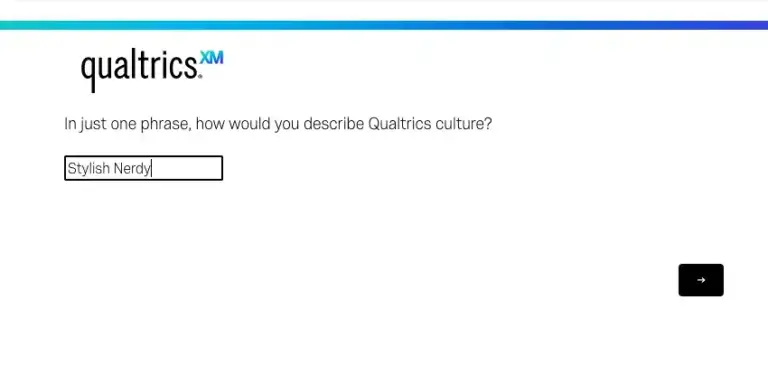
- Text entry: Text entry, also known as open-field, is used to gather open-ended responses. These survey responses can be lengthy essays, standard form information such as name, email address, or anything in between.
- Ranking order: Rank order is used to determine the order of preference for a list of items. This question type is best used when you want to measure your respondents’ attitudes toward something.
- Rating order: Rating questions ask respondents to indicate their personal levels for aspects such as agreement, satisfaction, or frequency. An example is a Likert scale.

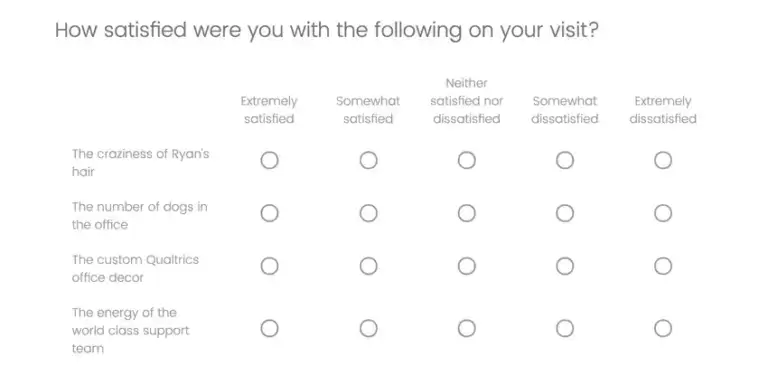
- Matrix table: Matrix questions are used to collect multiple pieces of information in one question. This type provides an effective way to condense your survey or to group similar items into one question.
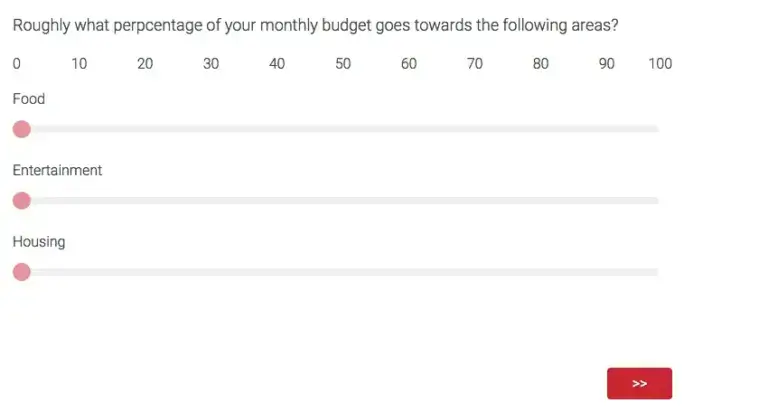
- Slider: Sliders let respondents indicate their level of preference with a draggable bar rather than a traditional button or checkbox.
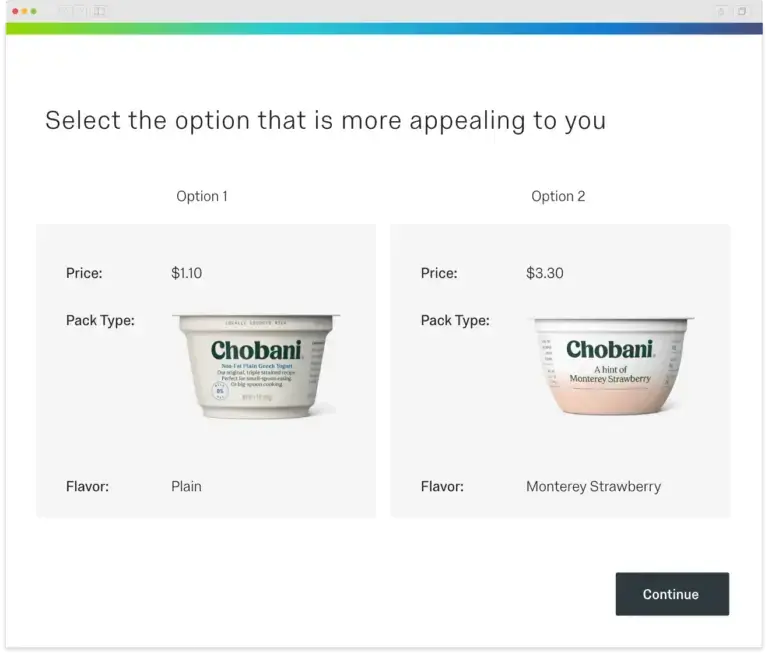
- Side-by-side: Side-by-side questions let you ask multiple questions in one condensed table and provide an effective way of shortening your survey while gathering the same amount of data.
The conventional wisdom—which has been supported by most empirical research on the topic over the years—suggests that, in general, questions should be worded to:
- Be simple, direct, comprehensible
- Not use jargon
- Be specific and concrete (rather than general and abstract)
- Avoid ambiguous words
- Avoid double-barreled questions
- Avoid negations
- Avoid leading questions
- Include filter questions
- Read smoothly out loud
- Avoid emotionally charged words
- Allow for all possible responses
If you’re curious about which question types can go together, you can review our sample survey templates that you can use for free to help you get started:
- Employee satisfaction survey template
- Employee exit survey template
- Customer satisfaction (CSAT) survey template
- Ad testing survey template
- Brand awareness survey template
- Product pricing survey template
- Product research survey template
- Employee engagement survey template
- Customer service survey template
- NPS survey template (Net Promoter Score
- Product package testing survey template
- Product features prioritization survey template
For more information on how to create a survey with the best mixture of questions, view the Qualtrics Handbook of Question Design
Ways to improve your survey creation
At first glance, a good survey looks easy to construct. You just ask the questions you want to be answered, right? In reality, the way you ask the question can determine the survey responses, so your questions should be unbiased, direct, and mutually exclusive. Well, there are best practices to ensure you get the best results, all of which we’ll outline in this section.
Design the survey for your brand
Regardless of who sends your online survey, ensure it’s consistent with your company’s branding.
When you create a survey, it’s still important that the customer recognizes it’s from you so they know it’s legitimate and not fraud. This also preserves overall brand consistency.
Quality check your survey data
All data should be checked and double-checked to ensure accuracy.
Before you send the online survey, take the survey yourself and make sure there are no errors. Complete the survey on multiple devices and make sure everything functions as it should. After you’ve gathered your data, review the results output and make sure everything is accurate.
Avoid asking for personal info you don’t need or already have
Respondents want to give their opinions, not personal details. If you already have a respondent’s information, don’t ask for it again. If you’re collecting sensitive data, make sure you’re complying with internal policies, local laws, and GDPR (if applicable). You’ll also want to ensure your servers that house the data are secure and carry out periodic penetration checks to patch any vulnerabilities.
Distribute your survey through the right channels
Your survey can be distributed through multiple channels – web, email, social media, etc. To make sure the maximum number of people complete it, distribute it through the channel your target audience is most likely to be on. This might even mean distributing it through social media for millennials and email for Generation X.
How to use your survey results
Knowing how to implement a survey is only half the story. If you don’t then make changes based on what you’ve learned, the time spent creating the survey will be wasted. Create an internal and external distribution plan before you even get the data. You can even create a mock presentation with fake data and a mock distribution plan, so you know exactly what you need to do once you’ve analyzed the data.
Trigger automatic actions
Automatic triggers save you time and help you scale your experience management programs. Use the findings from your surveys to trigger data integration with other tools like CRMs Salesforce, Hubspot, or Microsoft Dynamics. Create service tickets directly with a closed-loop ticketing follow-up add-on or with integrations to your service desk software such as Zendesk, ServiceNow, or FreshDesk. If a customer is at risk of churning, have an alert pop-up when that customer interacts with your customer service agent. There are endless possibilities to use automatic triggers once you have your data analyzed.
Format insights into a user-friendly format
There are many things you can do with your survey results, but it’s most important to get them into the hands of the decision-makers in an easily understandable format. From creating interactive PDF reports to exporting to Excel, SPSS, or Google sheets, you can present the information in multiple ways to help make sure it’s well-received by your stakeholders.
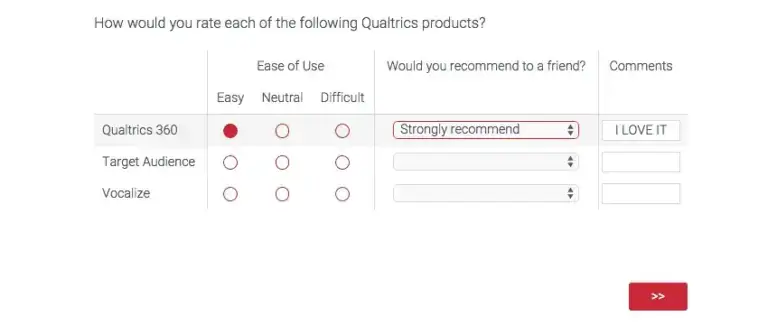
Formatting the analysis of your survey into a user-friendly format can help take it from this (which provides little overall insight when you have to view every question)
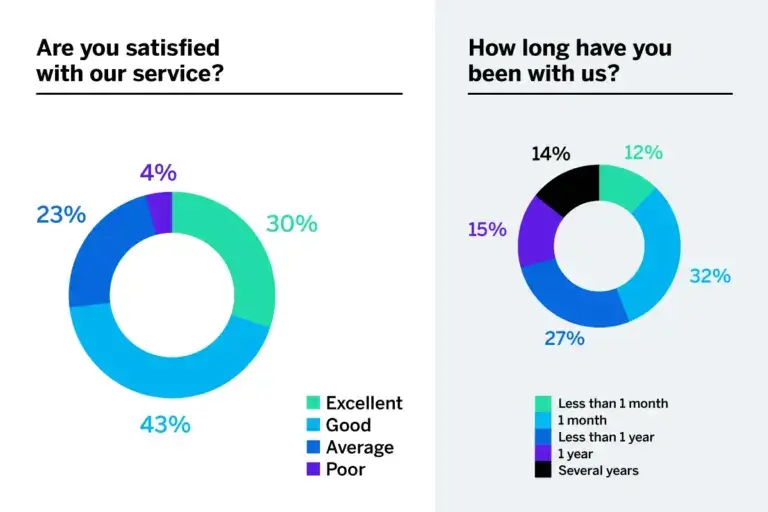
To this (where insights are instant and conclusions can be drawn instantly:
Use advanced statistical analysis
Advanced statistical analysis can help you answer research questions in more depth. These are methods that are typically used by a trained research professional or high-tech statistical software like Qualtrics iQ.
- Regression analysis – Measures the degree of influence of independent variables on a dependent variable (the relationship between two variables).
- Analysis of Variance (ANOVA) test – Commonly used with a regression study to find out what effect independent variables have on the dependent variable. It can compare multiple groups simultaneously to see if there is a relationship between them.
- Conjoint analysis – Asks people to make trade-offs when making decisions then analyses the results to give the most popular outcome. Helps you understand why people make the complex choices they do.
- T-Test – Helps you compare whether two data groups have different mean values and allows the user to interpret whether differences are meaningful or merely coincidental.
- Crosstab analysis – Used in quantitative market research to analyze categorical data – that is, variables that are different and mutually exclusive, and allows you to compare the relationship between two variables in contingency tables.