
Designing rating scale questions can be tricky to use, but they’re used because they provide an immense wealth of information on the target audience’s attitudes, behavior and responses to your product or service. We explore how you can make this survey question work for you.
What is a rating scale?
A rating scale is a type of survey question that uses closed questions, when gaining information from a respondent. The closed questions provide answers in the form of a range of choices from one theme. These themes can include:
- Satisfaction level
- The extent to which you agree with a statement
- How easy you found something to complete
- How far you would recommend a service
Why use a rating scale?
A rating scale is used when trying to get a rating value, to quantify intangible or abstract concepts. It is similar to a multiple-choice question, but it constrains answers to a single, logical value set (e.g. 1-5, 1-10, very satisfied to not at all satisfied).
These scales are used as the questions are easy to understand, provide insights across language barriers (as is the case with graphical scales) and can give approximate answers without diving deeper into detail.
Results gathered for an individual will show their own assessment of value. When results are collected at scale, the answers will form a comparative dataset to examine for trends.
Exploring different types of rating scales
For rating scales, there are two main groups:
- Ordinal scales - These scales have answer sets that occur in a logical and systematic order, which have a relational link. It provides qualitative data. For example, a Net Promoter Score scale asked the respondent to answer this question ‘how likely they are to refer a company/product/service to a friend’ using a scale of 1-10, where 9-10 denotes that the respondent would be a ‘promoter’.
- Interval scales - These scales have answer sets where each interval within it tells you about a deeper meaning, rather than just an ordered grouping. It provides quantitative data. For example, 1-5 is an ordered list of numbers that occur one after the other. 1 represents a value (e.g. ‘Least likely’) at one end of the spectrum, while 5 represents a different value (‘Most likely’) on the other end of the spectrum.
Here are some of our favorite rating scale question types:
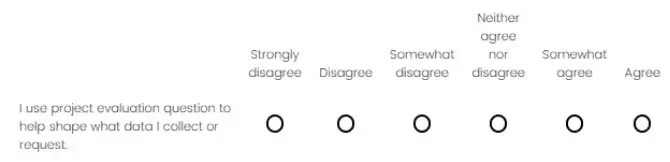
Likert scale questions
What is a Likert scale? This is a scale for finding the person’s level of agreement or disagreement about a given statement. The question ‘how much do you agree with a statement?’ is provided alongside a 1-5 scale, where 1 is strongly disagree, while 5 is strongly agree.
There may be a number of statements listed in a matrix table, with the 1-5 rating along the top, though each statement should always be considered against the question in its own right. Alternatively, other amounts of number ranges may be used (including scales of 1-10 and 1-6 as below)
Frequency scale questions
This is a scale to find out the frequency of an event, or how often an event occurs. This can help you understand a customer’s behaviour towards a product or service. Using the question ‘When [performing action], how often do you [end result]?’ The answer set can run on a scale from ‘Very often’ to ‘Sometimes’ to ‘Not at all’, or ‘More than X’ to ‘Not at all’.
The respondent will need to consider their own usage behaviour and assign it to an interval value that they believe is the closest. This can lead to differences in interpretation - for example, how much does ‘sometimes’ refer to?
Comparative scale
This is a scale to find out about the preference from a comparison. A respondent chooses an answer based on a choice of two compared measures (for example, one answer ‘compared with’ or ‘compared to’ another).
This can have a non-relational link. For example, you could ask respondents ‘which feature do you like most?’ and supply two features to pick from. However, it’s most useful when the elements are closely linked, like two versions of the same product, to see which your target respondent likes best.
Semantic Differential Scale
This is a scale that looks at a respondent's beliefs. Participants answer by indicating where a product or item lies on a scale, where each end of the scale represents two polar opposite adjectives used to describe the item. For example, ‘hot’ that goes to ‘cold’, ‘good’ that can turn to ‘bad.
It’s useful to understand how a customer sees a product or service’s value, when it’s compared to its polar opposite. However, this only works if the adjective values are truly opposing. This scale has been criticised for not giving clarity on what the mid-points would signify between the two adjectives.
Graphic scale questions
This is a scale to allow respondents to pick a value based on a graphical representation of what the answers are. This could be a scale of faces, showing a happy face through to a sad face. This could also be represented by a set of stars from 1-5.

This can be especially helpful for surveys across geographical areas, which could help understanding.
Slider scale
This scale is for providing freedom of interpretation to the respondent, for them to answer to whatever point they would like, to best represent their view between two points of measurement. While the two points could represent concrete intervals (like 1-5, or ‘Happy’ and ‘Sad’).
This can be tricky for people for you to interpret afterwards, so consider when to use these slides carefully.
How do I set up a rating scale question correctly?
If you incorrectly set up a rating scale question, this could confuse your respondents, muddy your data results and waste your time. There are several things to note when setting up your rating scale question:
1. Identify your scale points
The scale’s points should map as closely as possible to the underlying idea (construct) of the scale. Also, the scale should give enough points to differentiate respondents from one another as much as validly possible
It should be easy to interpret the meaning of each scale point - i.e. the meaning of scale points should be interpreted identically by all respondents.
2. Using the right rating scale
The breakdown of each rating scale type above should give you an idea of how you can incorporate these into your survey (see the bolded text for a quick reference).
However, if you’re not sure about using one type over another, consider using them both in a test first. If your results show you what you were hoping to collect, then you know which test you should.
In numerical scales, ‘1’ must always represent the lowest scale end, and ‘5’ must always represent the highest. This is because your scale will run from left to right on a horizontal axis, so as you move to the right, the numbers should get bigger.
3. Gain more information with an extra field
When you include a rating scale, you may want to include a free-text answer box underneath to ask your respondent to expand on their earlier answer. This can give you the reasons why a person answered in the way they did, which could be compared with other similar results for verification.
In addition, you can add on another field to the scale, for people who are genuinely not sure - for example, a ‘Not applicable’, ‘Other’ or ‘Don’t know’ tickbox.
Usually, software will keep this separate from the scale points, to make sure it doesn’t confuse the respondent. This will also prevent a respondent from picking a random answer, and affecting your data results, from the pressure of not having an alternative action.
Common questions on using scale questions
How many scale points should I include in my question?
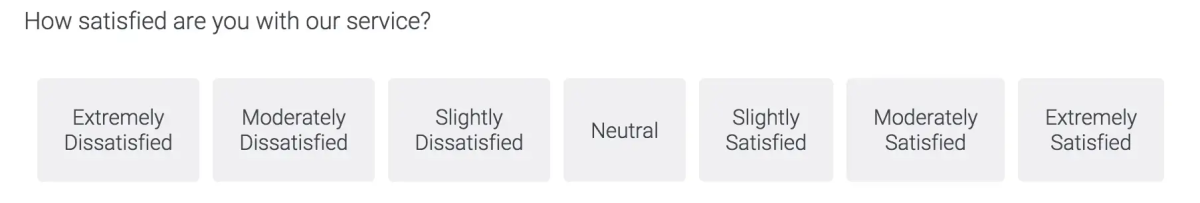
The number of scale points depends on what sort of question you’re asking. If you’re dealing with an idea or construct that ranges from positive to negative – think satisfaction levels – (these are known as bi-polar constructs) then you’re going to want a 1-7 point scale that includes a middle or neutral point. In practice, this means the response options for a satisfaction question your Likert scale labels should look like this:
If you’re dealing with an idea or construct that ranges from zero to positive – think effectiveness – (these are known as unipolar constructs) then you’ll go with a 1-5 point scale.
Since it doesn’t make sense to measure negative effectiveness, this kind of 5-point scale is the best practice.
Tip: Always measure bipolar constructs with bipolar scales and unipolar constructs with unipolar scales.
In short, the goal is to make sure respondents can answer in a way that allows them to differentiate themselves as much as is validly possible without providing so many points that the measure becomes noisy or unreliable. Even on an 11-point (0-10) scale respondents start to have difficulty reliably placing themselves, lowering the rating scale quality.
This is because 3 isn’t so different from 4 and 6 isn’t so different from 7 and having this many more levels of contentment beyond the basic 5 or 7 makes survey measures more confusing.
Do I want to give a middle response option?
Many researchers complain that including middle alternatives basically allows respondents to avoid taking a position. Some even mistakenly assume that midpoint responses are disguised “Don’t know” or that respondents are satisfied when they provide midpoint responses.
However, research suggests that midpoint responses don’t necessarily mean that respondents don’t know or are avoiding making a choice. In fact, research indicates that if respondents that select the midpoint were forced to choose a side, they would not necessarily answer the question in the same way as other respondents that opted to choose a side.
This suggests that middle alternatives should be provided and that they may be validly and reliably chosen by respondents. Forcing respondents to take a side may introduce unwanted variance or bias to the data.
How should I label the response options?
Some people prefer to only label the end-points. Others will also label the midpoint. Some people label with words and others label numerically. What’s right? The most accurate surveys will have a clear and specific label that indicates exactly what each point means.
Going back to the goals of survey rating scale points and their labels, we want all respondents to easily interpret the meaning of each scale point and for there to be no room for different interpretations between respondents. Labels are key to avoiding ambiguity and respondent confusion.
This means that partially labeled scales may not perform as well as a fully labeled scale and that numbers should only be used for scales collecting numeric data (not rating scales). Fully labeled scales have been shown to produce more reliable and valid data.