

Migrating to Results Dashboards
What's on this page
About Migrating to Results Dashboards
Qualtrics has released a new version of Results-Reports called Results Dashboards. This page is a guide to learn about new Results Dashboards functionality, to help you recreate features from your Legacy Results-Reports. For more in-depth information about each feature described here, visit the linked pages.
Qtip: If you’re looking for an introduction to each reporting platform, read these support pages:

Accessing Results
To access Results:

Qtip: If you’ve previously clicked this, you can return to Legacy Results-Reports by clicking Settings, then going to the Themes tab and clicking Revert dashboard.

Creating a Report
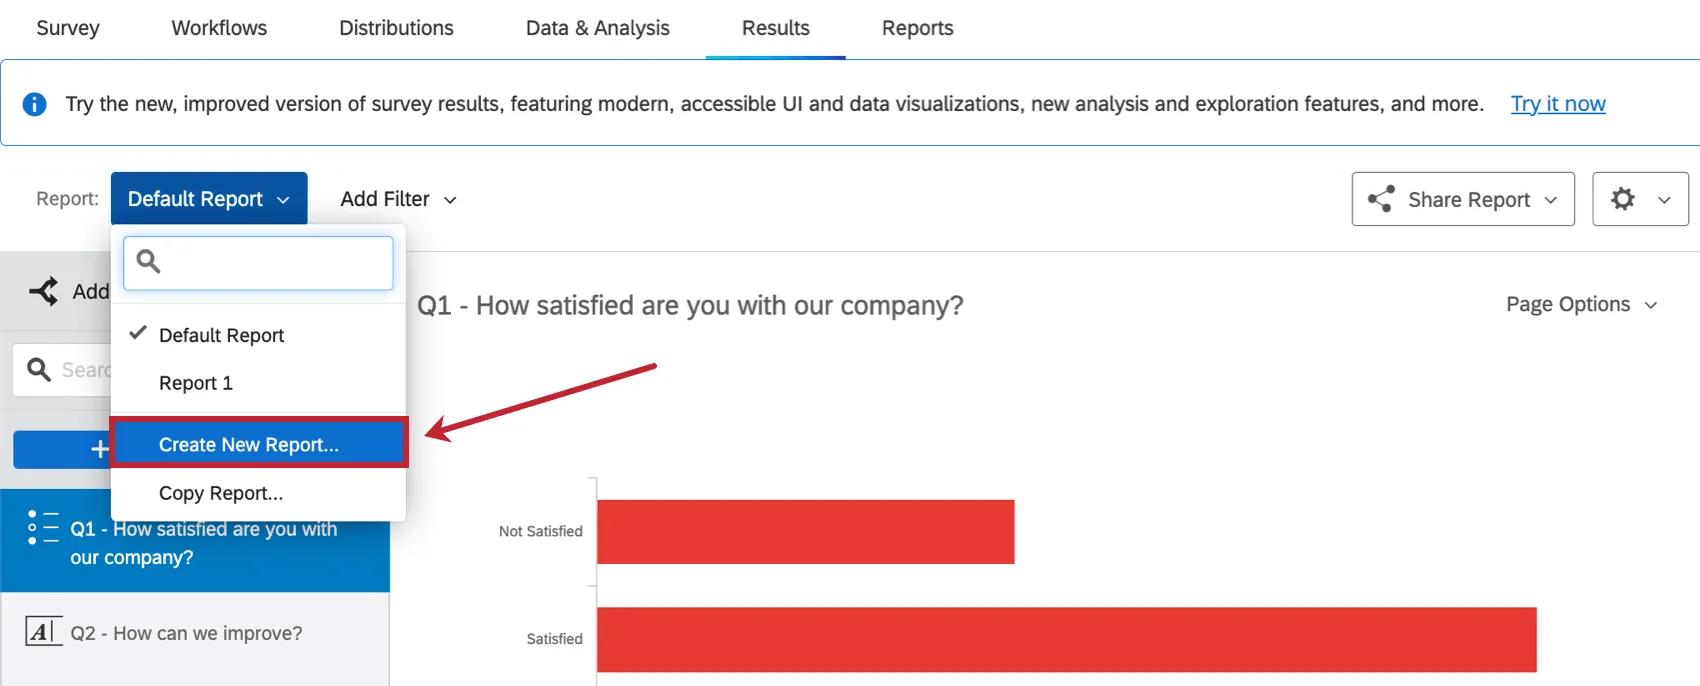
In Legacy Results-Reports, a default report would be created automatically, with a separate page for each survey question. A new report could be created by clicking Default Report and selecting Create New Report.
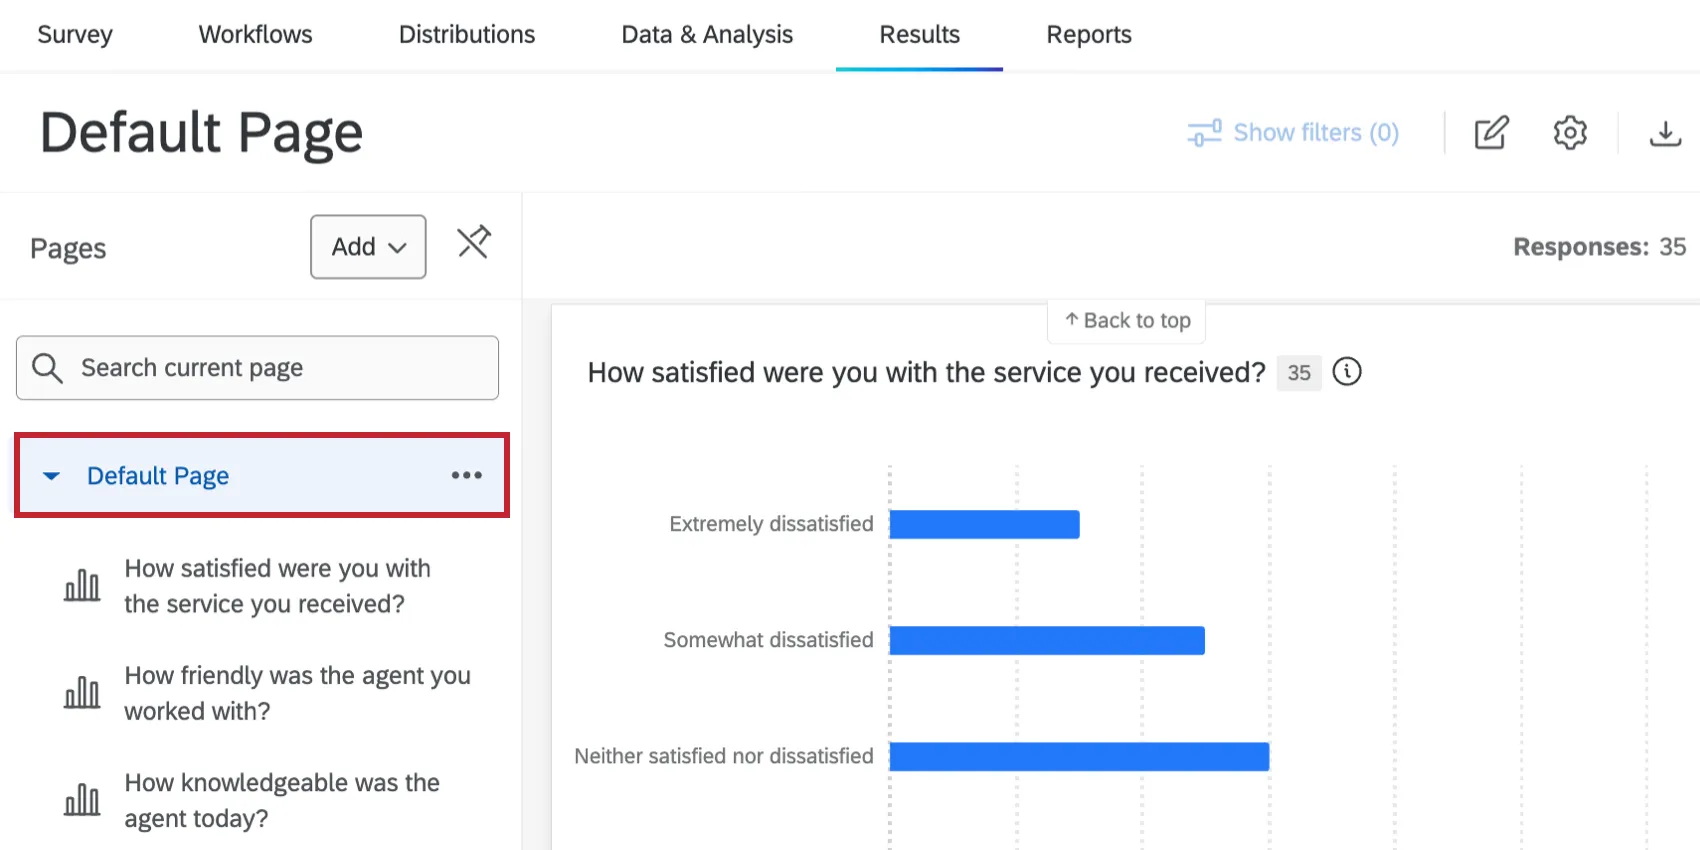
In Results Dashboards, a dashboard will be created automatically with 1 default page. While you can add pages to this dashboard, there can only be 1 dashboard in a survey project.
Editing Reports
In Legacy Results-Reports, you could start making edits as soon as you entered the Results tab.
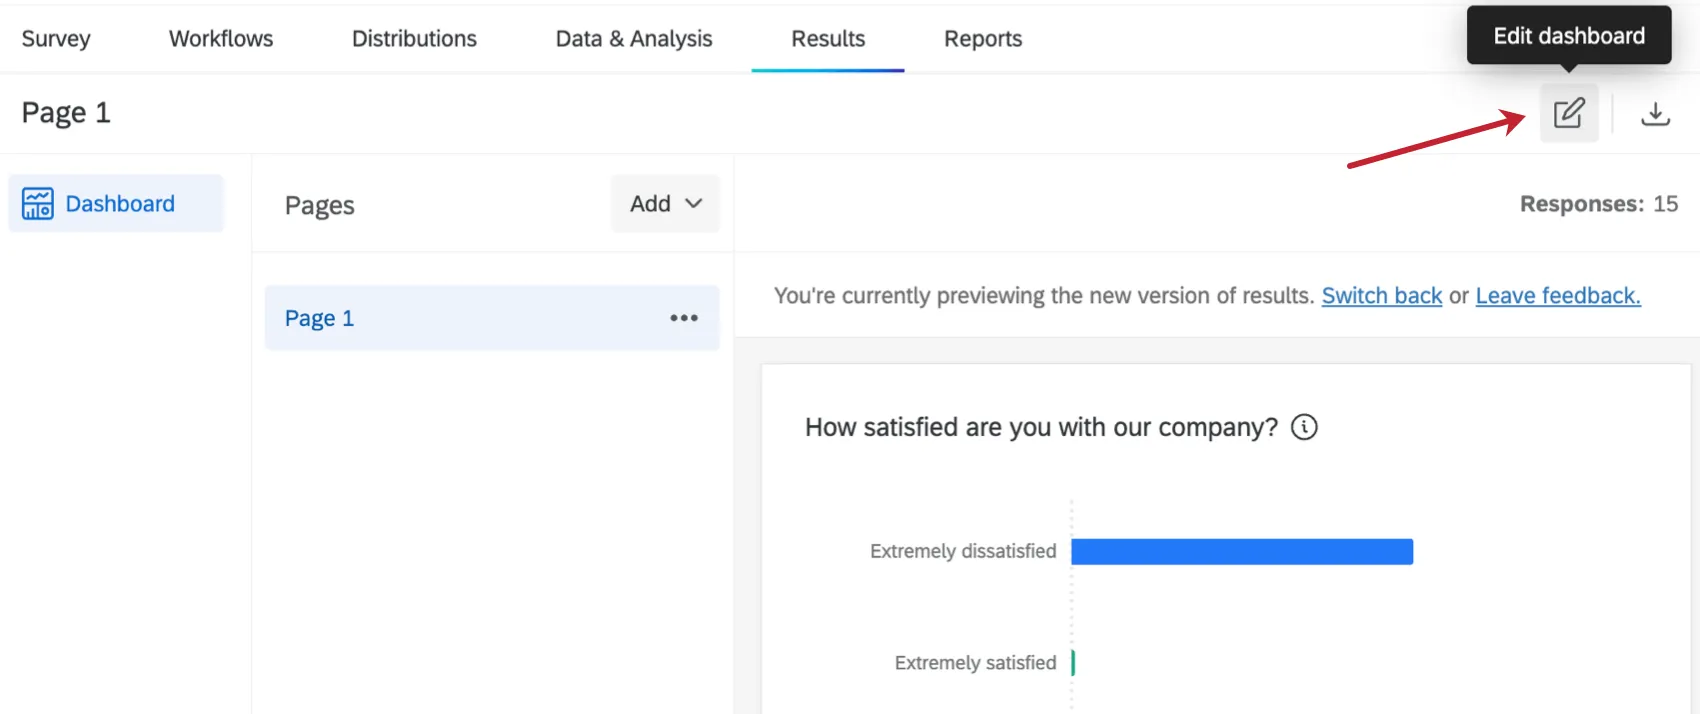
In Results Dashboards, click the edit icon first. This lets you start making many types of edits, from adding pages, to adding visualizations, to editing dashboard settings.
Adding Pages
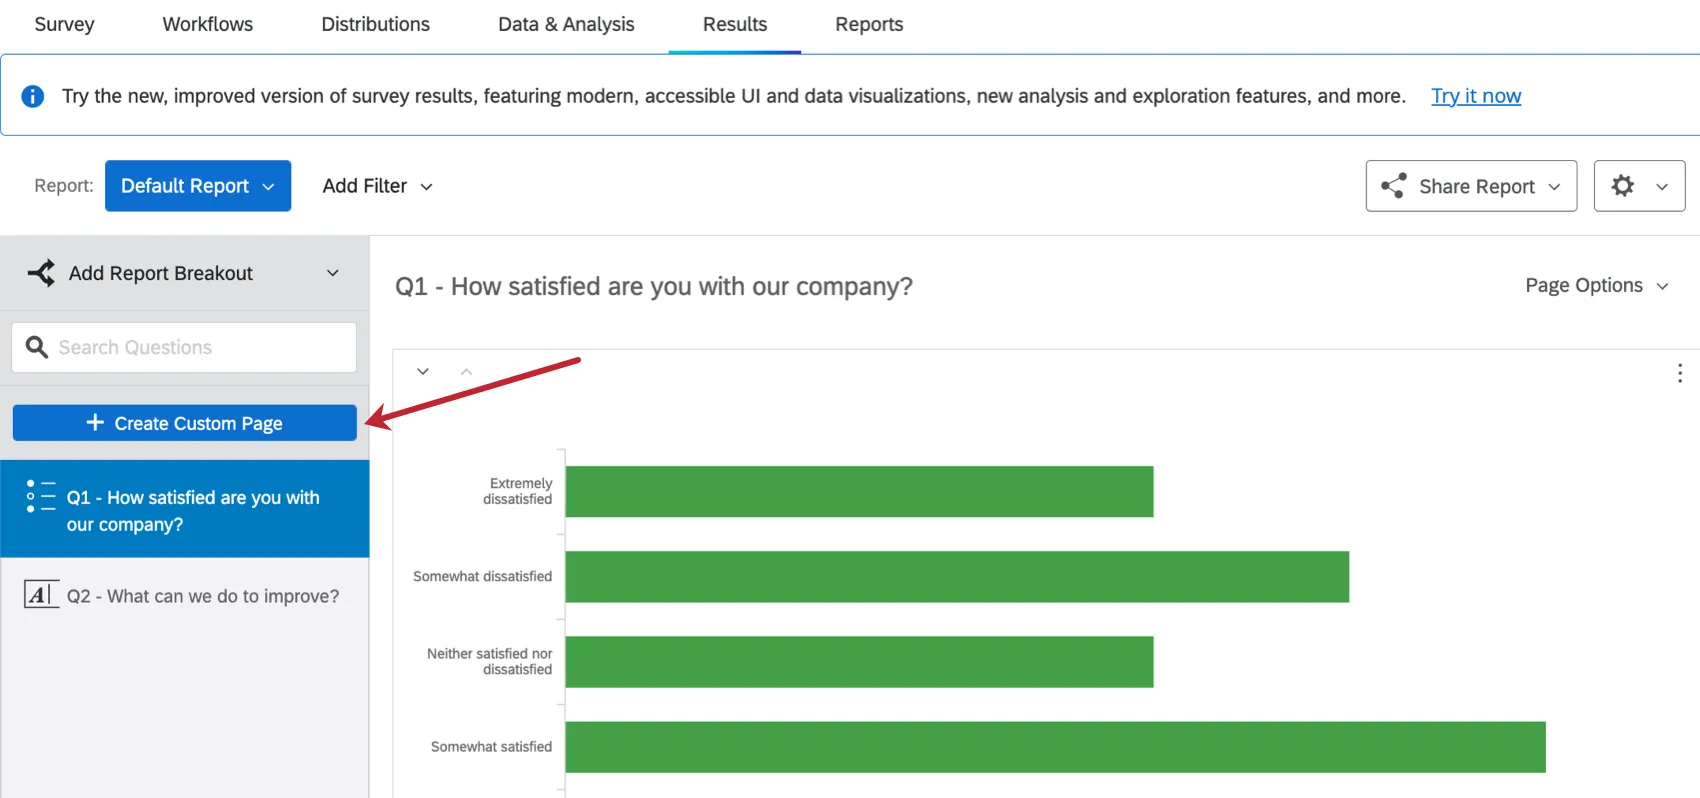
In Legacy Results-Reports, each report would have a separate page created for each question in your survey. You could also click Create Custom Page to add a custom page to your report.
In Results Dashboards, a default page will be created with a visualization for each survey question. This page is called a report page. Click Add to add a blank page, private page, or report page to your dashboard.
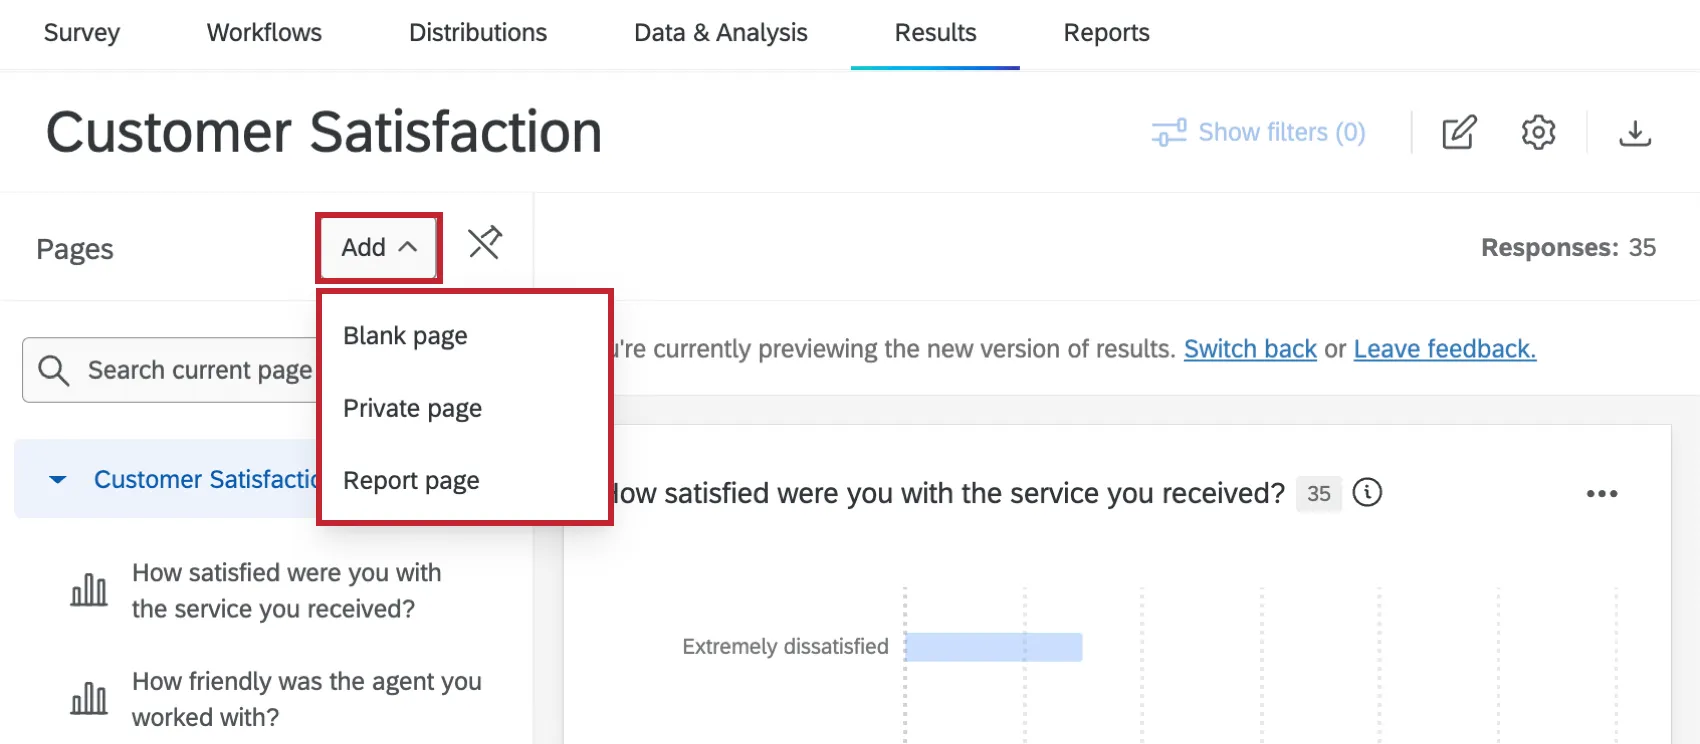
We recommend starting with a Report page. Instead of having to build from scratch, widgets are generated for you that show data for the corresponding question, similar to how the Legacy experience behaved. In addition, you can make edits to the report template, changing the default metrics, theme settings, charts, and more.
See Results Dashboards Pages for more information.
Question Page vs. Custom Page Migration
Qtip: Qualtrics may, in its sole discretion and without liability, change the timing of any product feature rollout, change the functionality for any in preview or in development product feature, or choose not to release a product feature or functionality for any reason or for no reason.
On April 1, 2027, question pages of Legacy Results-Reports that haven't been edited from their default setup will be automatically migrated to Results Dashboards. This requires no action on your part.
However, custom pages and edited question pages of Legacy Results-Reports will not be migrated. Before March 31, 2027, you will need to migrate custom pages manually or save them. We recommend becoming comfortable with Results Dashboards as soon as possible.
Question Pages (Migration May Be Required)
Warning: If a question page is customized with page filters or breakouts, or the visualizations are modified from their defaults, that question page will not be transferred automatically to a Results Dashboard. You will need to migrate custom pages manually or save them by March 31, 2027.

Question pages are default pages of the report that Legacy Results generate for you. The visualizations on a question page can only show data for the corresponding question.
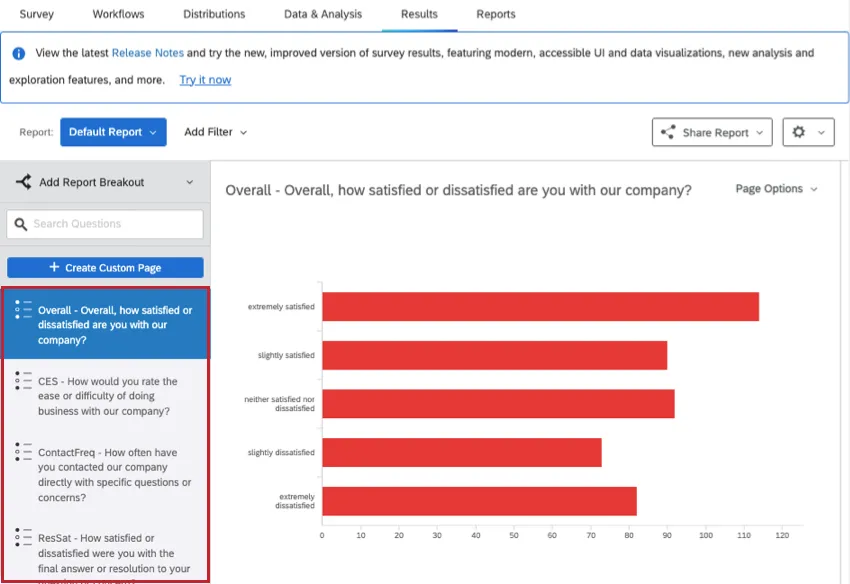
Here are some ways to tell if a page is a Question Page:
- The page is named after a question / field, and cannot be renamed.
- Under Page Options, you can’t delete the page.
- The visualizations' sources can’t be changed to different questions or fields.
Extra visualizations or different themes and color schemes are not necessarily evidence of a custom page.
Custom Pages (Migration Required)
Custom pages include any page created by clicking Create Custom Page.
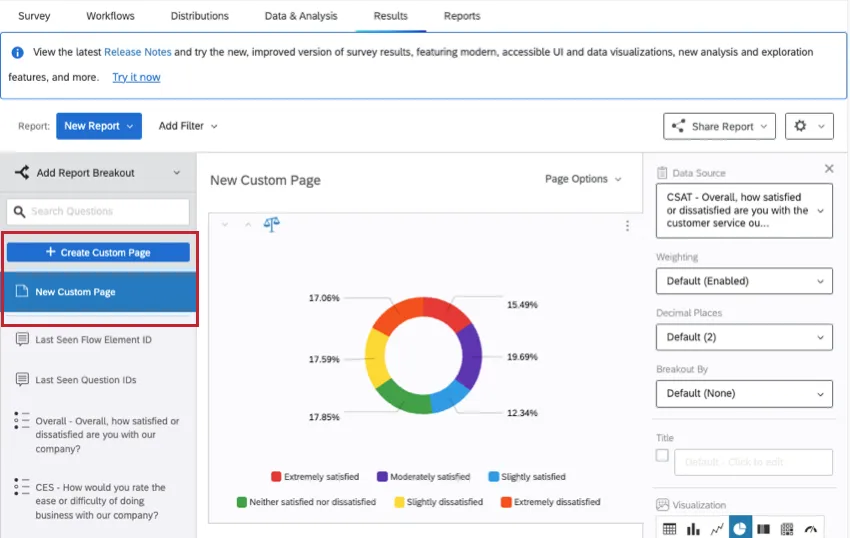
Here’s how to tell if a page is a Custom Page:
- You can name the page whatever you want.
- Under Page Options, you can delete the page.
- There is data from different questions on the same page.
- In the list of pages, the Custom Pages are listed above Question Pages, with a dividing line between them.
If you’d like to save your Custom Pages, you can download individual pages or download the entire report. Make sure to download content before March 17, 2027, when editing is disabled.
To rebuild Custom Pages in Results-Dashboards, read the rest of this support article.
Adding and Editing Visualizations
Adding Visualizations
In Legacy Results-Reports, visualizations were automatically created for every question in your survey. You could click Add Visualization at the bottom of a page to create a new visualization.
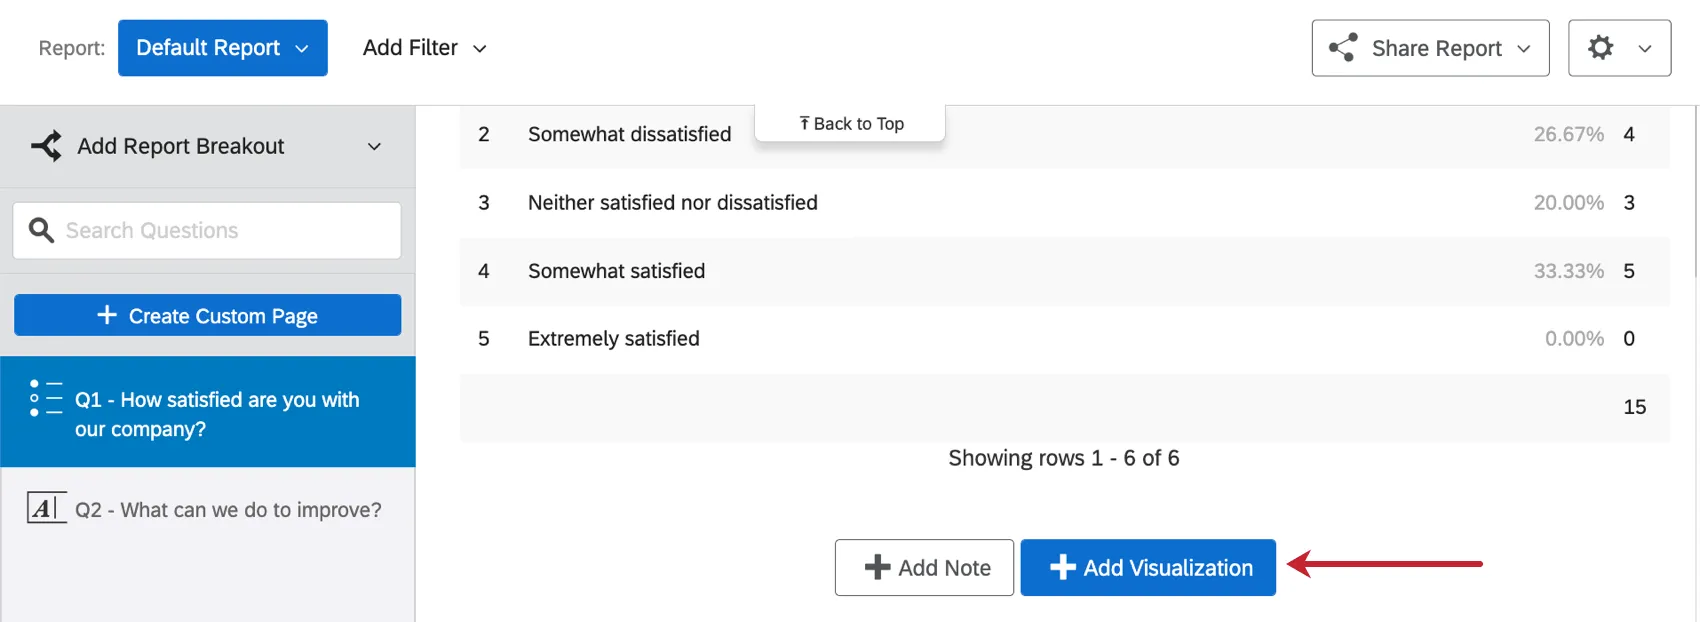
In Results Dashboards, widgets are also already created for every question in your survey. Once you are in editing mode, click Add Widget at the bottom of the page to add a new widget.
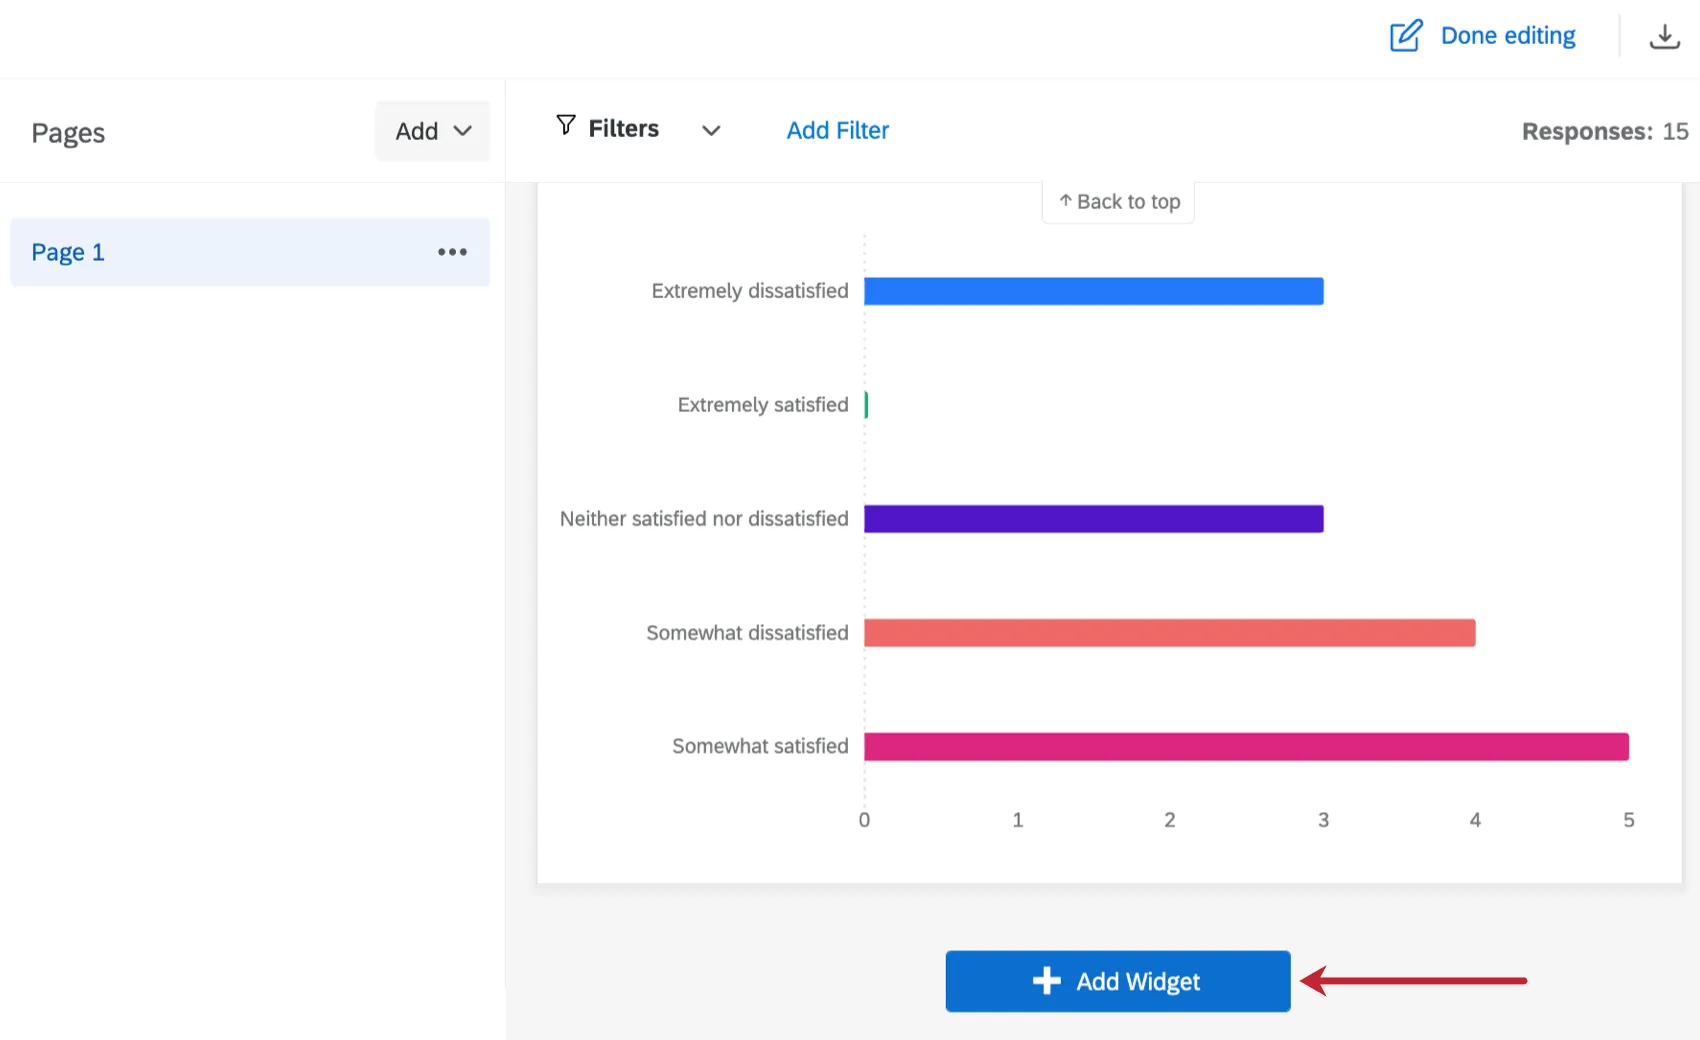
Qtip: New widgets are added at the bottom of the current page. After creation, they can be moved anywhere within the page.
Editing Visualizations
In Legacy Results-Reports, clicking on a visualization would open the editing panel. Here you could customize the visualization, change the visualization type, transpose the visualization, remove the visualization, and more. Visualizations on question pages of Legacy Results-Reports could not be moved, and no visualizations could be resized.
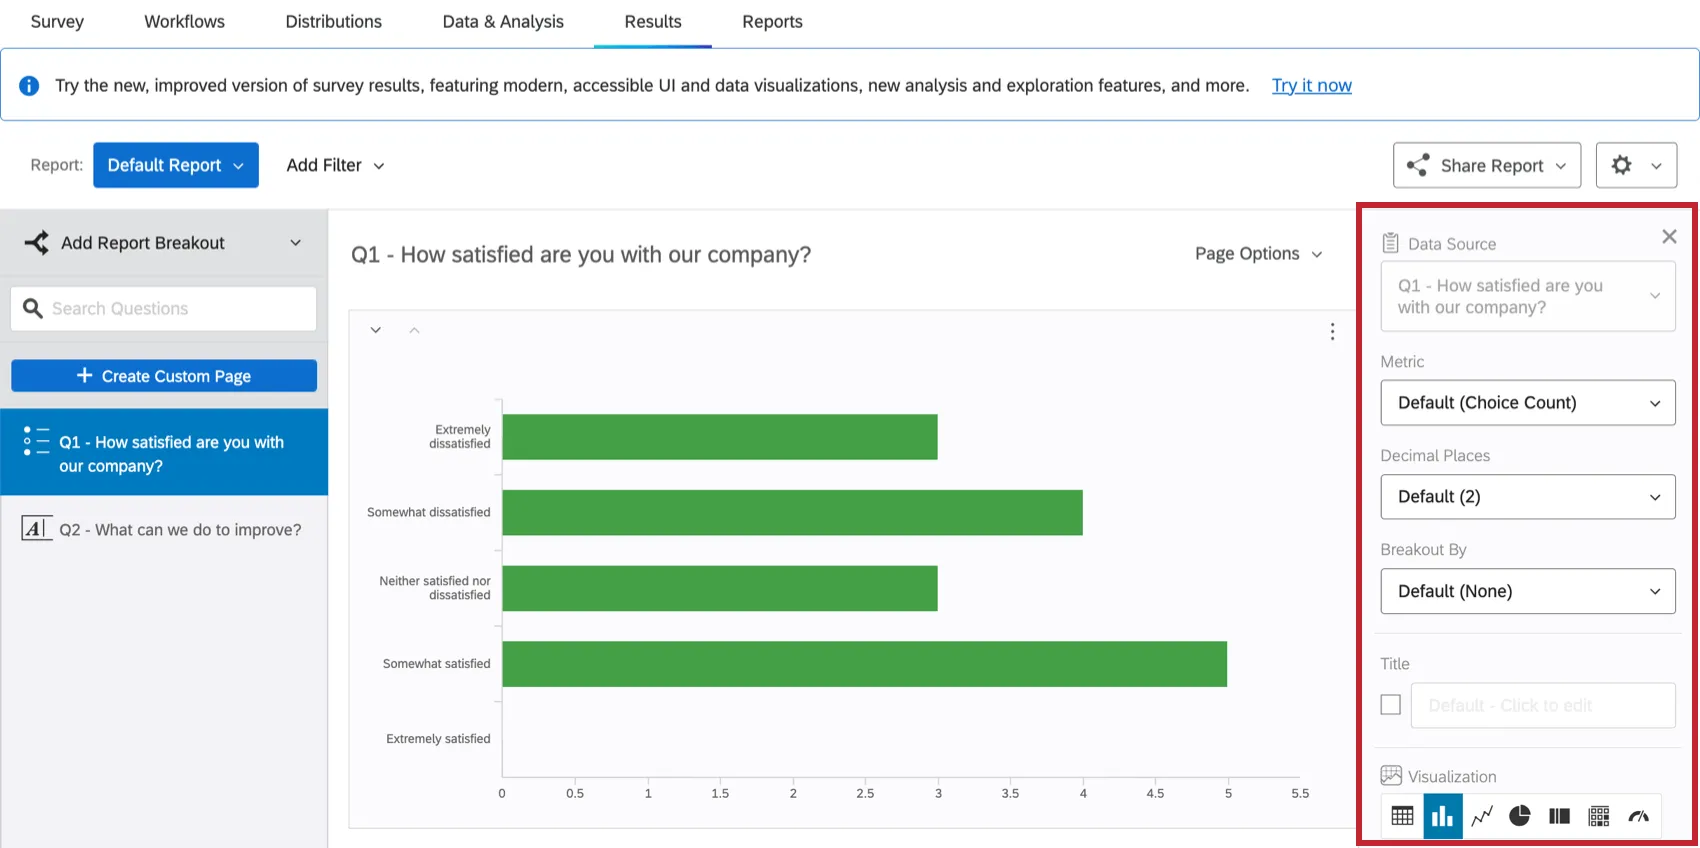
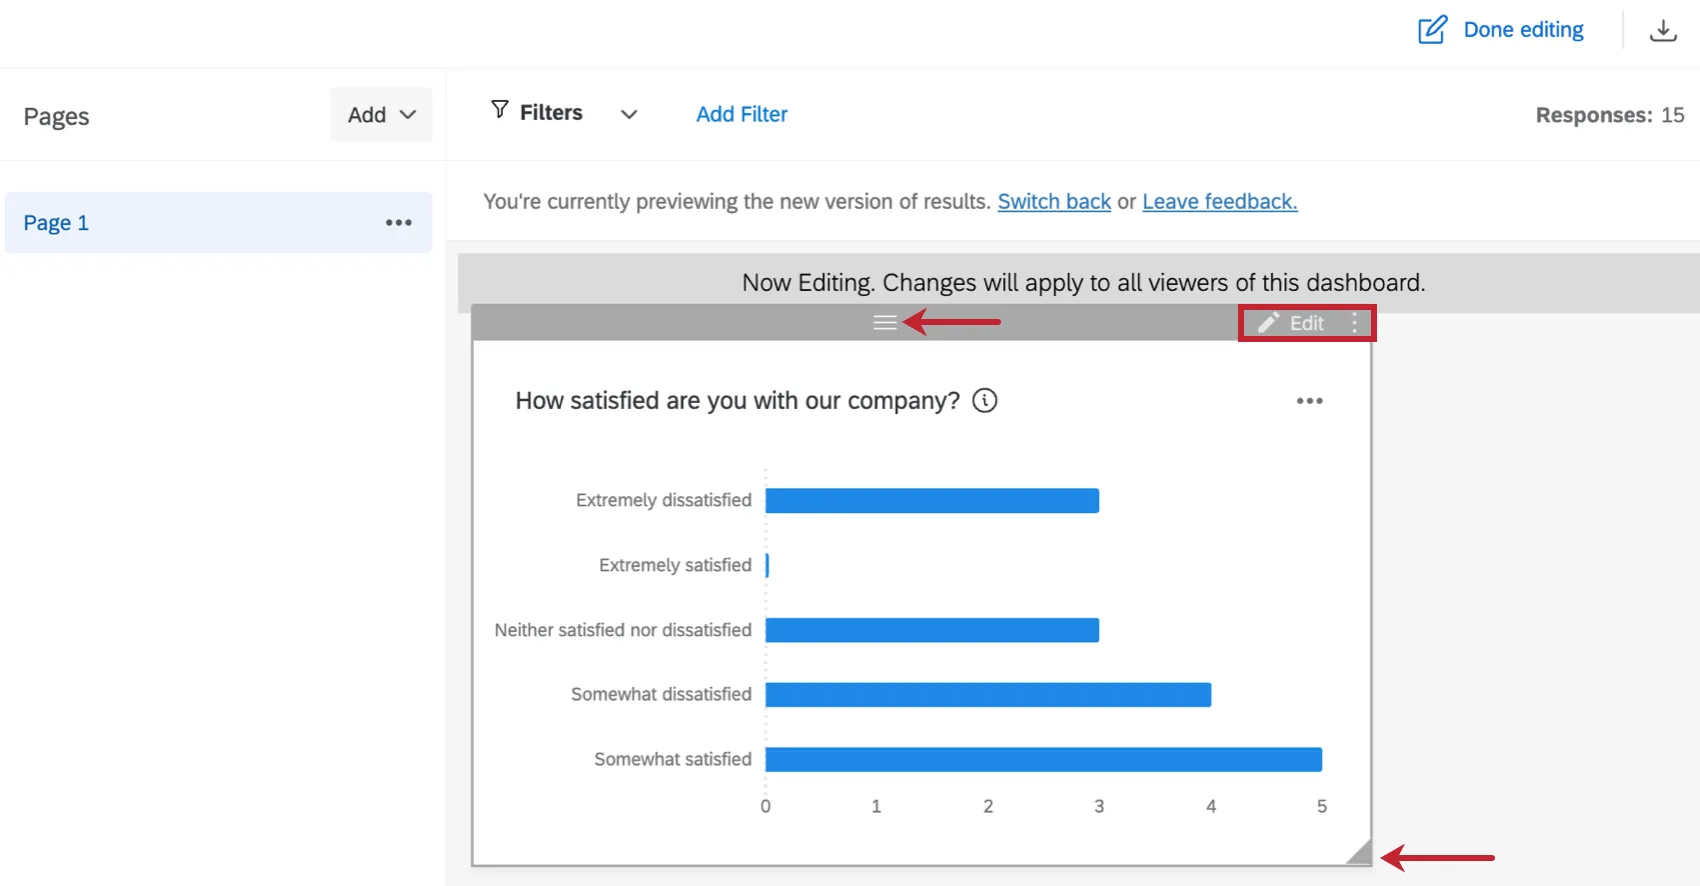
In Results Dashboards, once you are in editing mode, double-click on a widget or click Edit to open the editing panel. You can also drag the corner of a widget to resize it, or move the widget by clicking the 3 horizontal bars at the top and dragging it to your desired location. Click the 3 vertical dots to duplicate, remove, or move the widget to a different page.
Within the editing panel you can customize the widget, change the widget type, transpose the widget axes, remove the widget, and more. See Results Dashboards Widgets for more information.
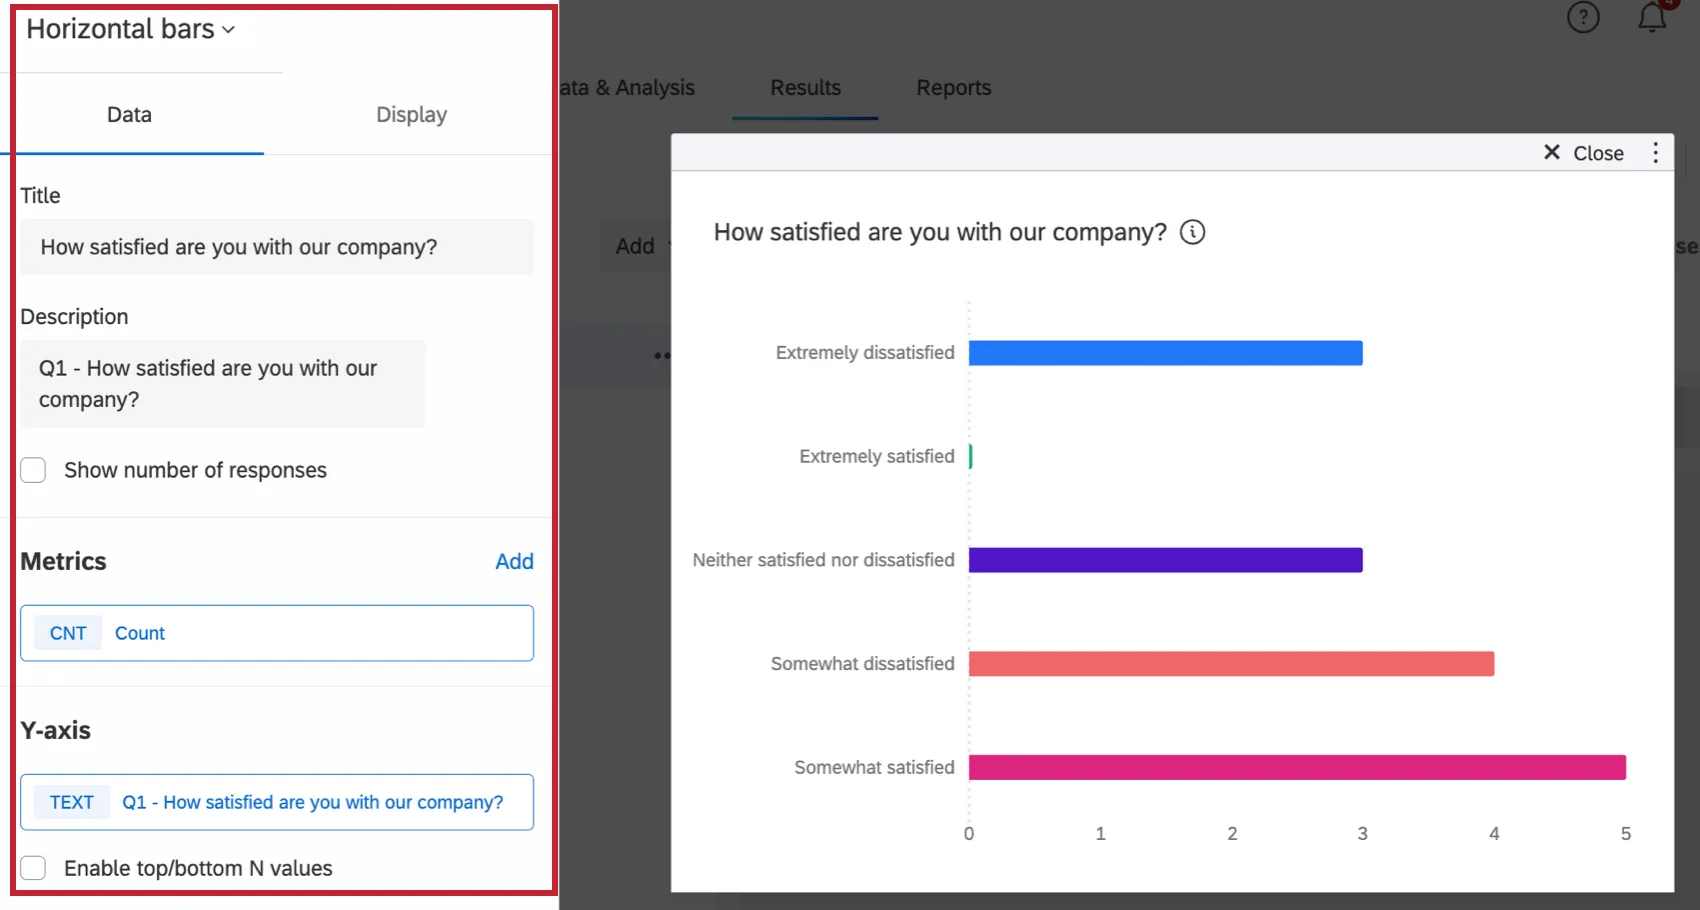
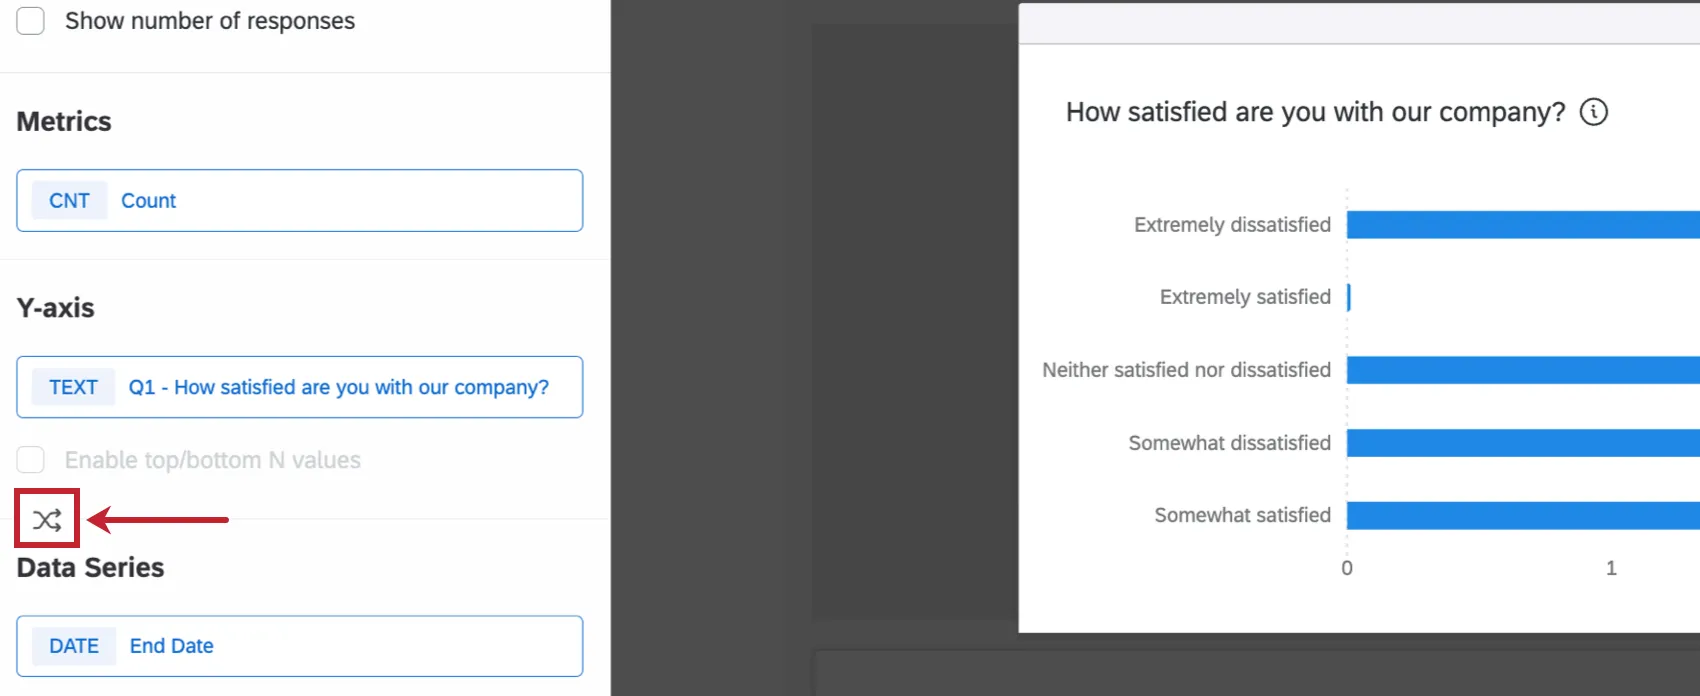
Qtip: Within Results-Dashboards, the transpose option will only appear when a Y-axis and Data Series are added to the widget. Click the transpose icon to switch the Y-axis and Data Series.
Adding Filters
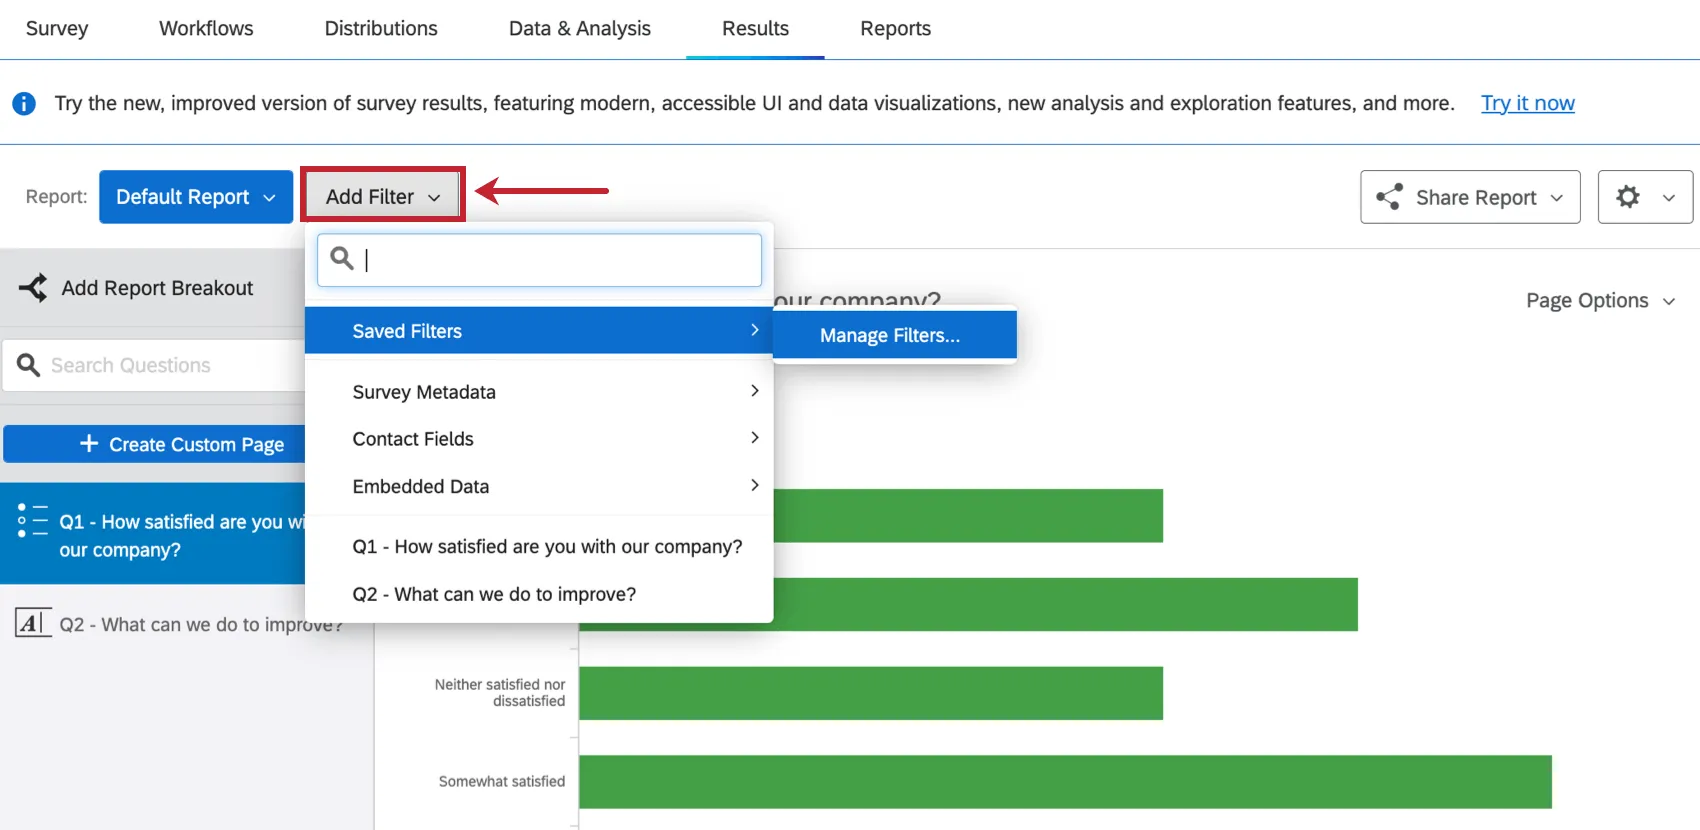
In Legacy Results-Reports, you could click Add Filter next to the report name to add a filter. You could also load saved filters, or click Manage Filter to view and edit previously saved filters. Filters applied to all visualizations within the report.
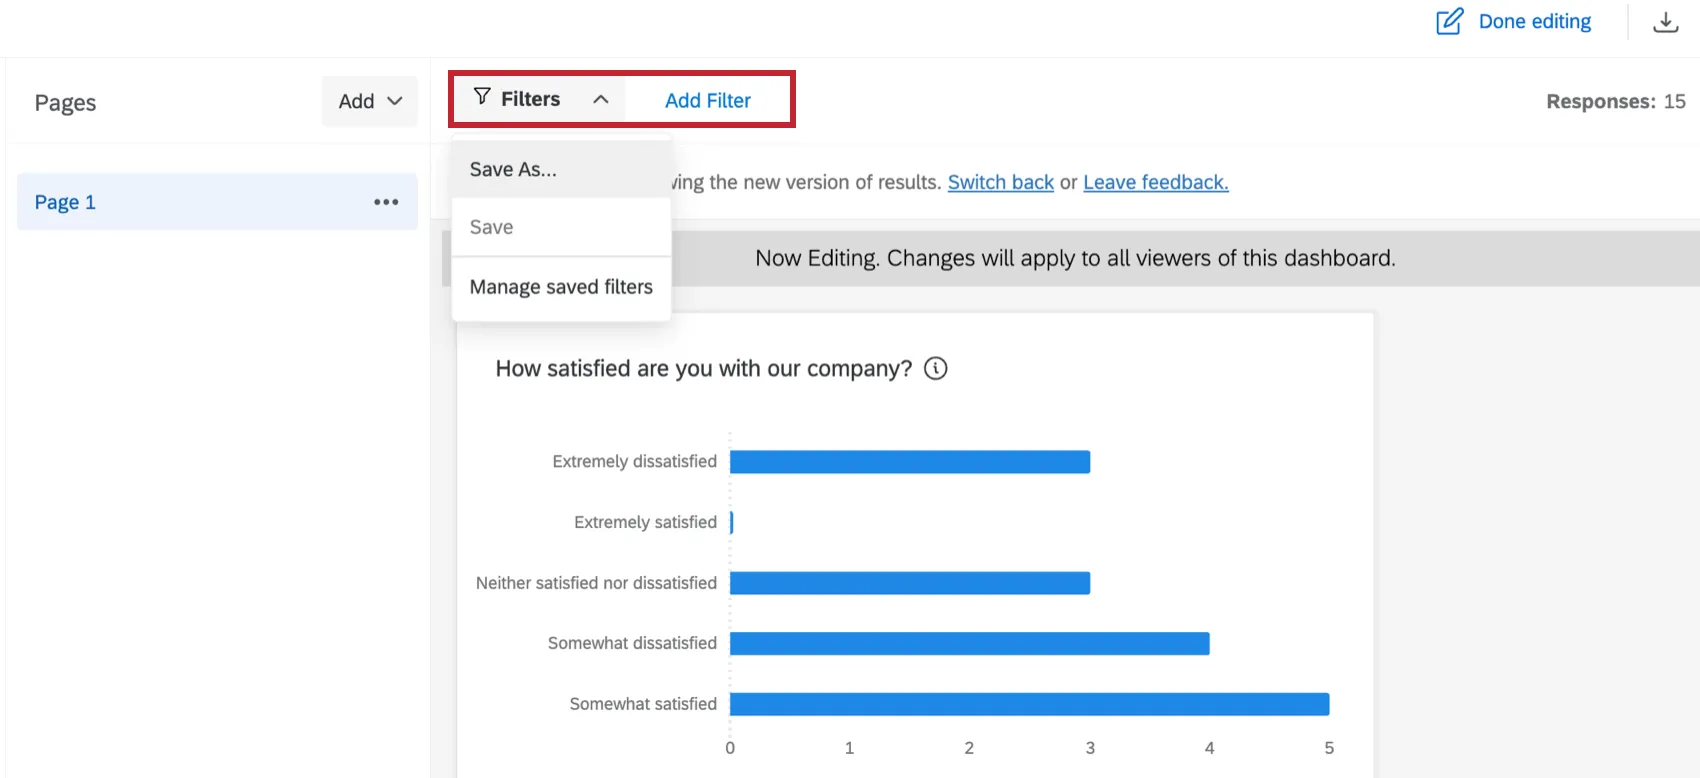
In Results Dashboards, click Add Filter when you are in editing mode to add a filter that will apply to all widgets on the page. Click Filters to save a filter or manage saved filters.
Filters can also be added to individual widgets. While editing a widget, click Add within the filters section to create a new filter.
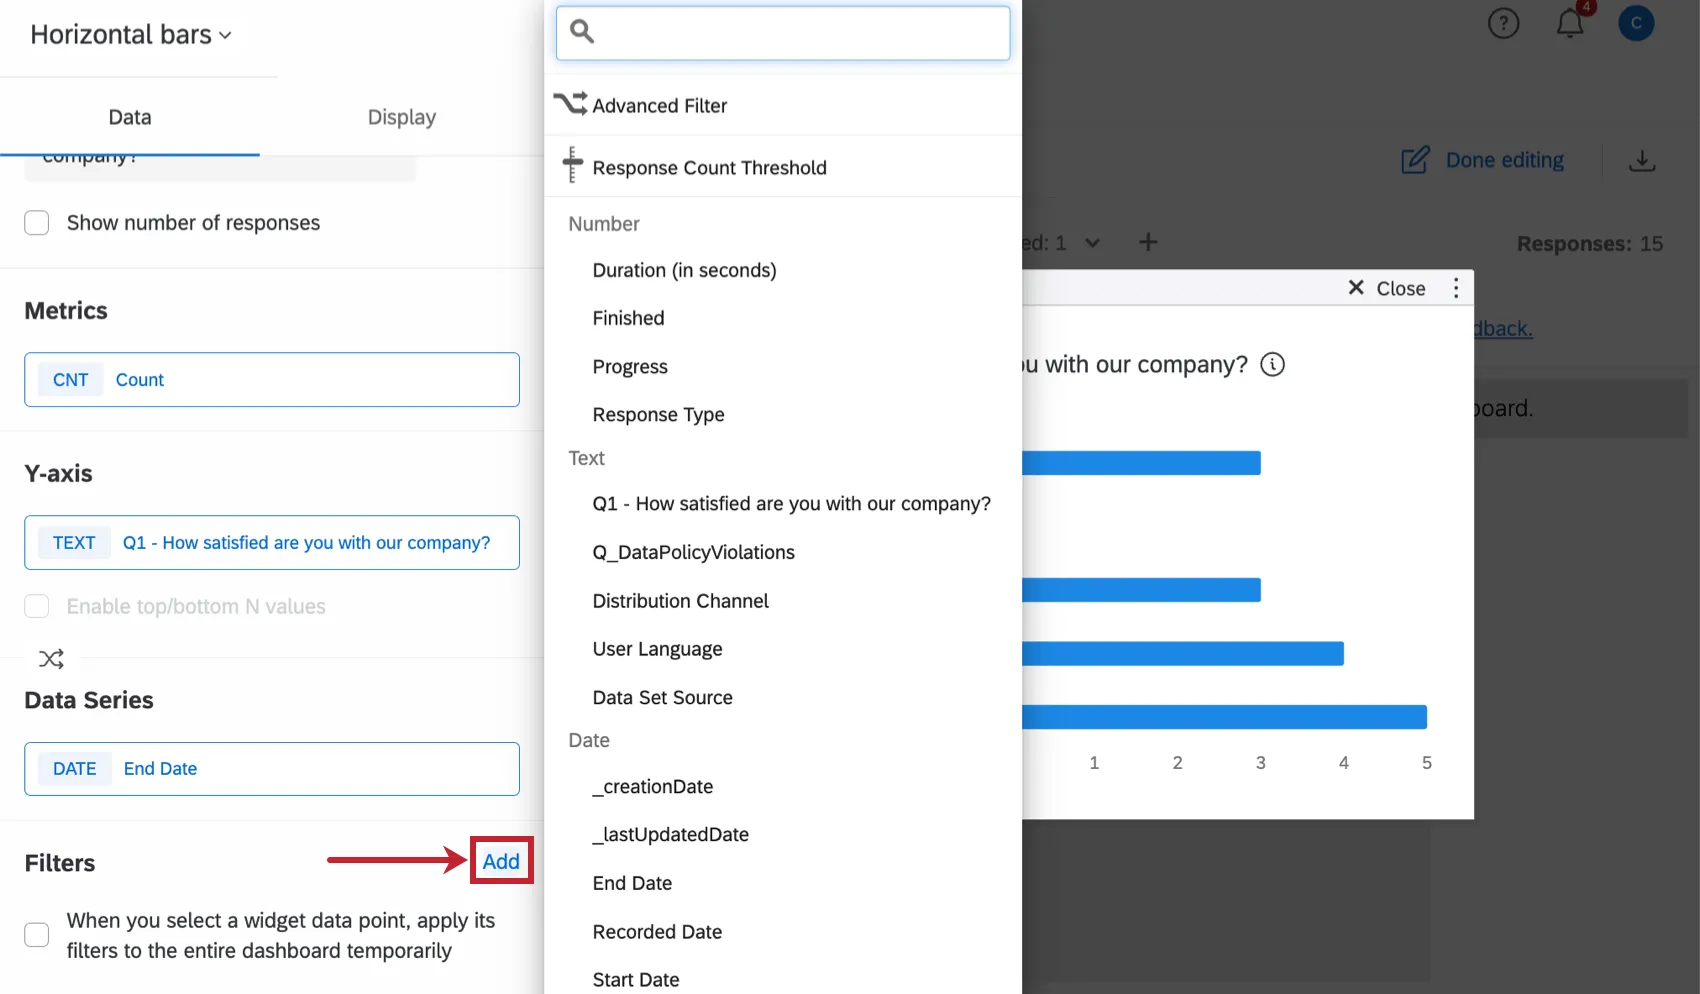
Qtip: Widget-level filters will override any page-level filters.
Sharing Results
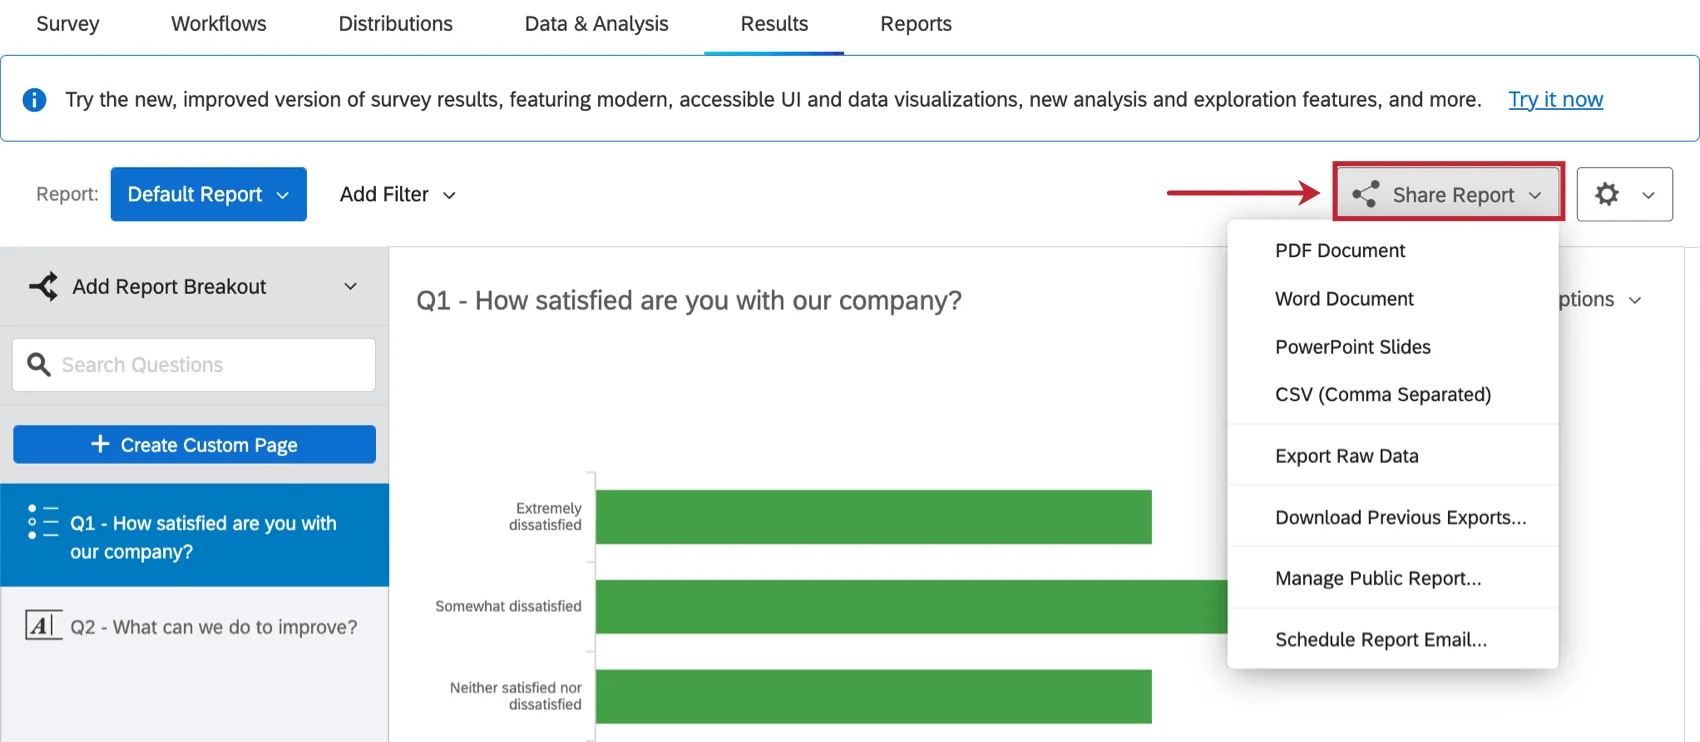
In Legacy Results-Reports, you could click Share Report to export your report or share it via a public report link or scheduled report email.
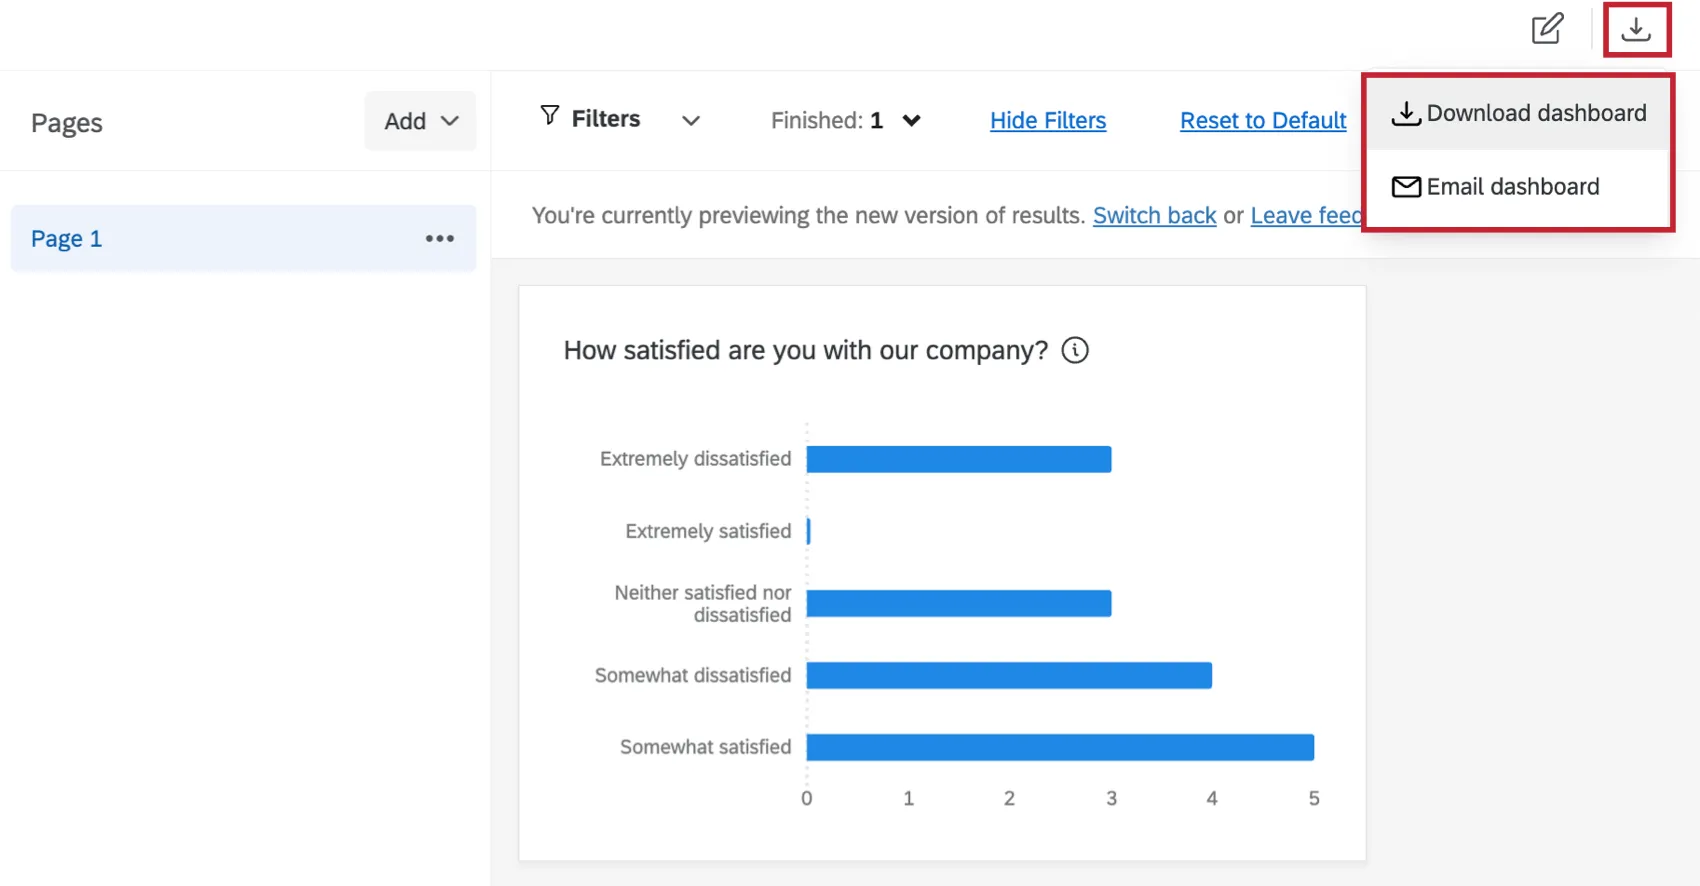
In Results Dashboards, click the download icon to download your dashboard or share it over email.
Qtip: State & Local Governments and Academic research products also have access to a public report link for Results Dashboards. However, this feature comes with important restrictions to consider. Read more on Manage Public Results Dashboards.
FAQs
Will reports I built in Results-Reports be automatically transferred to Results Dashboards?
Will reports I built in Results-Reports be automatically transferred to Results Dashboards?
Default Reports will automatically be transferred. Reports with any customization will not be transferred.
Will scheduled emails in Results-Reports transfer to Results Dashboards?
Will scheduled emails in Results-Reports transfer to Results Dashboards?
When will I lose access to Results-Reports?
When will I lose access to Results-Reports?
- November 1, 2026: You can no longer create new Legacy Results-Reports, for either existing or new survey projects. Existing Legacy Results-Reports will still be viewable and editable.
- March 17, 2027: You can no longer edit existing Legacy Results-Reports. Existing Legacy Results-Reports will still be viewable.
- April 1, 2027: Question pages automatically move to Results Dashboards. Legacy Results-Reports is completely removed from Qualtrics, and old reports are no longer accessible.
Qualtrics may, in its sole discretion and without liability, change the timing of any product feature rollout, change the functionality for any in preview or in development product feature, or choose not to release a product feature or functionality for any reason or for no reason.
Does copying a project also copy the Results Dashboard?
Does copying a project also copy the Results Dashboard?
Yes. Copying a survey project also copies the Results Dashboards created to visualize data. Note that private report pages will not be copied.
Does Results Dashboards have the same visualizations as Results-Reports?
Does Results Dashboards have the same visualizations as Results-Reports?
Yes, Results Dashboards supports all of the same visualizations, including Text Highlights and Heat Map Plots.
Can I create a Statistics Table widget within Results Dashboards?
Can I create a Statistics Table widget within Results Dashboards?
There is no Statistics Table widget in Results Dashboards. A similar widget can be created by making a Table widget and adding your desired statistics as metrics within the Metrics section.
How are tracked events stored?
How are tracked events stored?
That's great! Thank you for your feedback!
Thank you for your feedback!