
Report Template Toolbar (EX)
What's on this page
Qtip: This page describes functionality available to Engagement, Lifecycle, and Ad Hoc Employee Research projects. For more details on each, see Types of Employee Experience Projects.
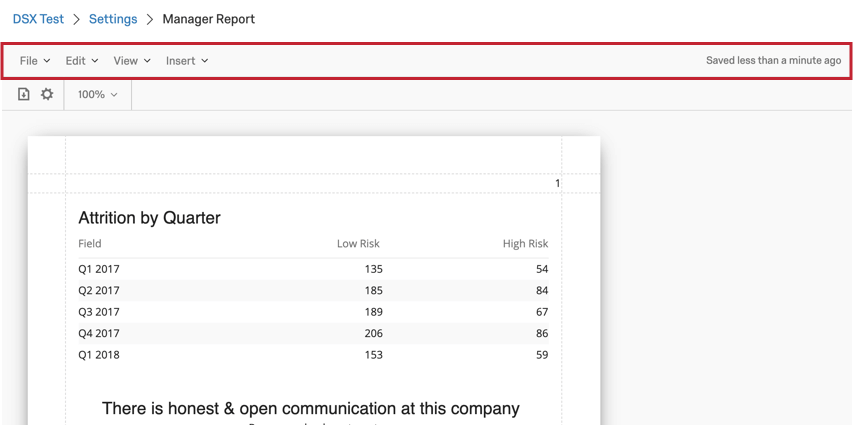
About the Report Template Toolbar
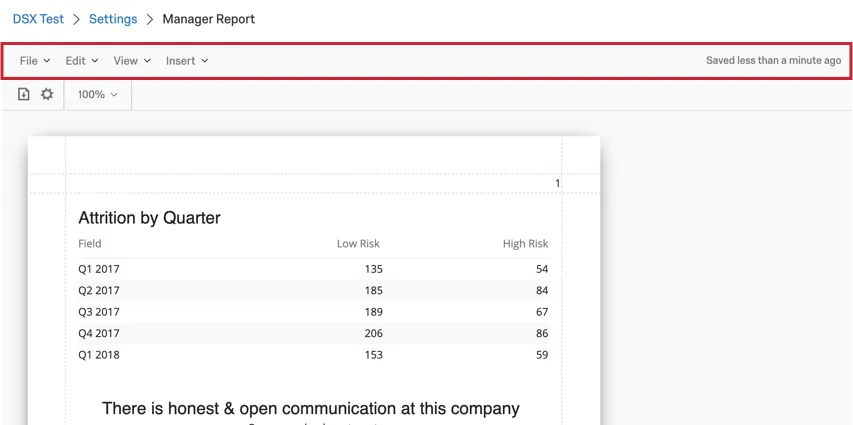
The toolbar on a report template can perform many actions to your report. Here, you can manage your report settings, edit visualizations, manage your report view, insert content into your report, and see when your report was last autosaved.
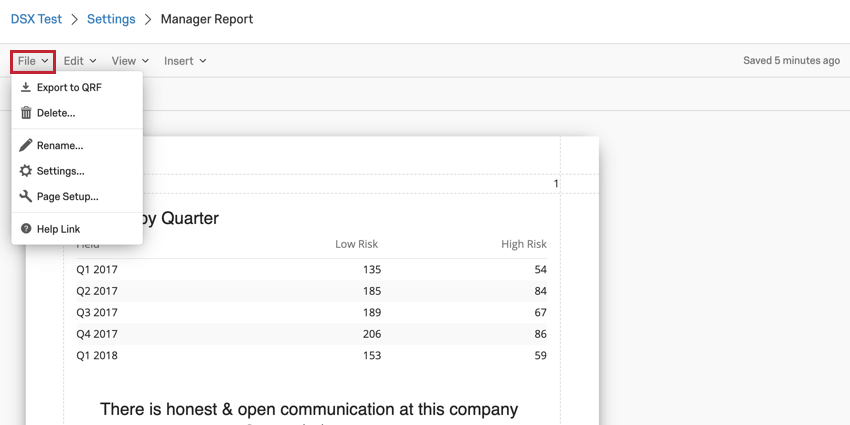
File Menu
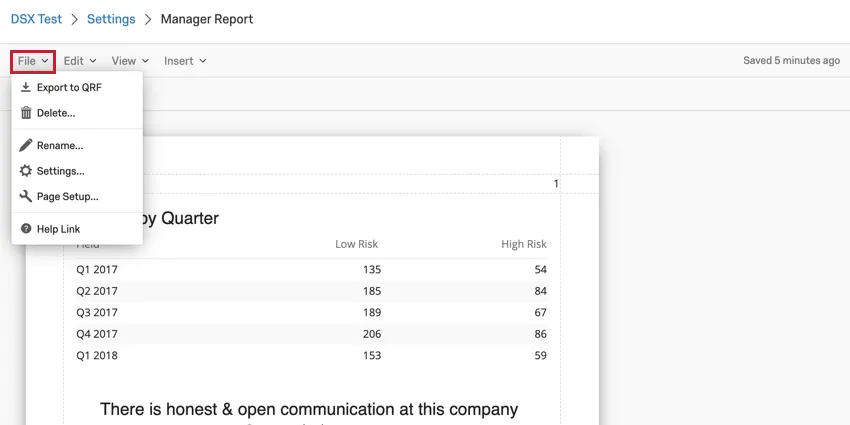
The File menu in your toolbar lets you perform various actions about your report’s global settings.
- Export to QRF: This option exports your report as a QRF file type. You can then import this file when creating a new report.
- Delete: This option will delete your current report template. Once a report template is deleted, it cannot be recovered!
- Rename: This option lets you rename your report template.
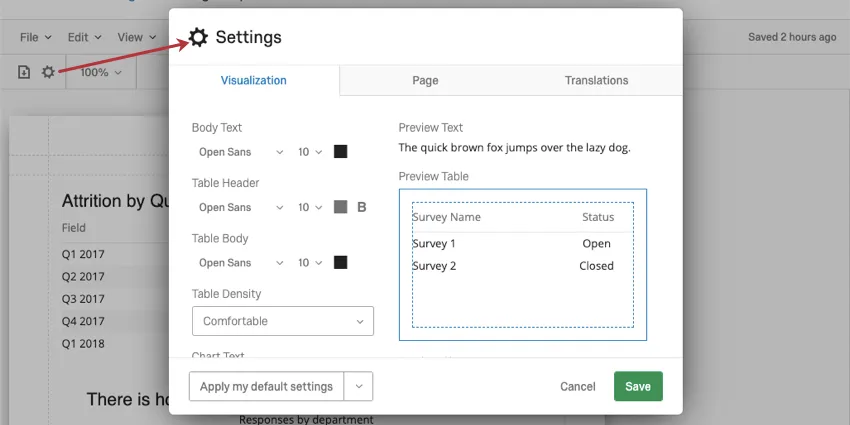
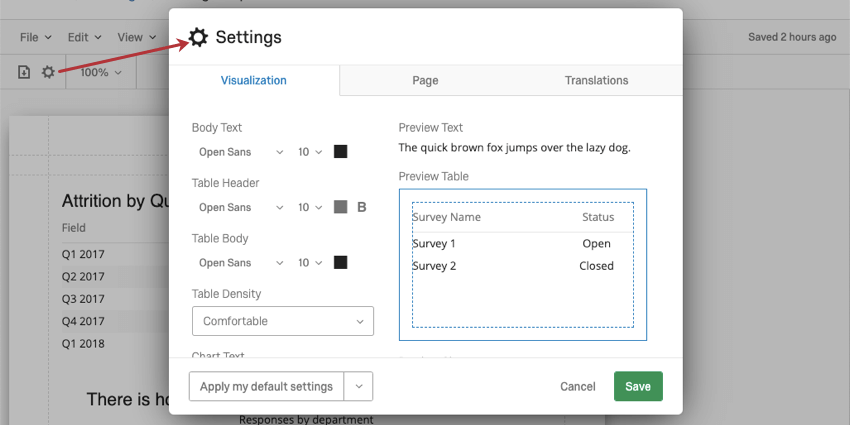
- Settings: This option allows you to configure your report’s global settings, such as report text, the report template color palette, and the visualization density. For more information about each option available in this menu, read our page on Global Report Settings.
- Page Setup: This option allows you to configure the size, orientation, and margins on your report. For more information on these settings, read this support page. Note that the linked page is for a similar feature in the Survey Platform and only the linked section is relevant.
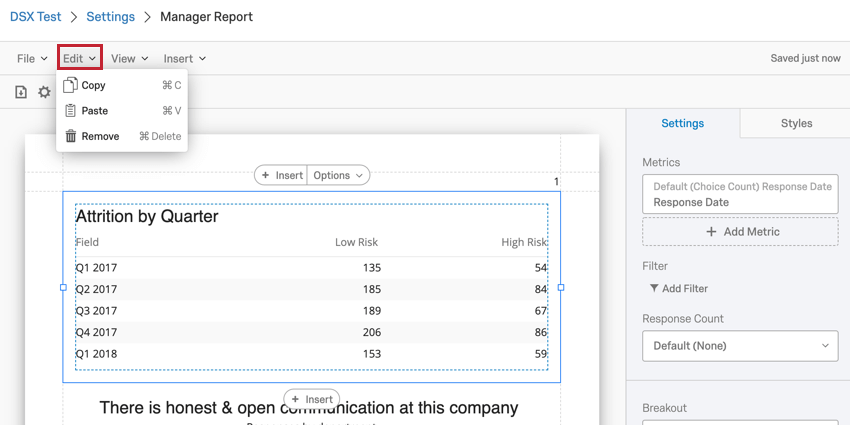
Edit Menu
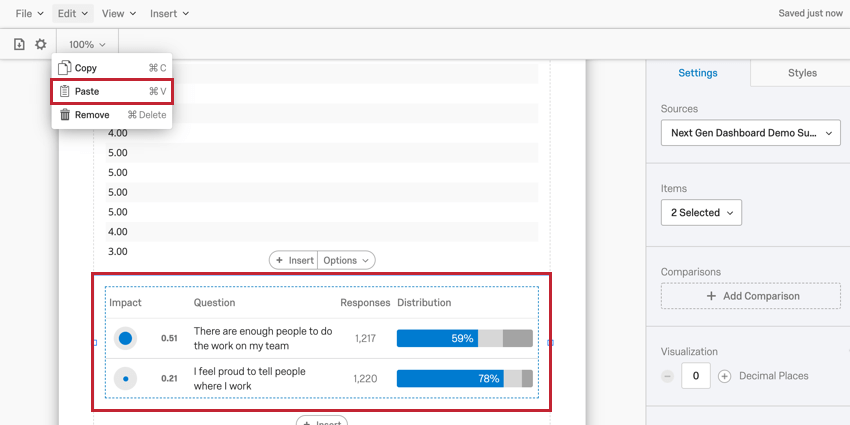
The Edit menu lets you copy, paste, and remove visualizations from your report.
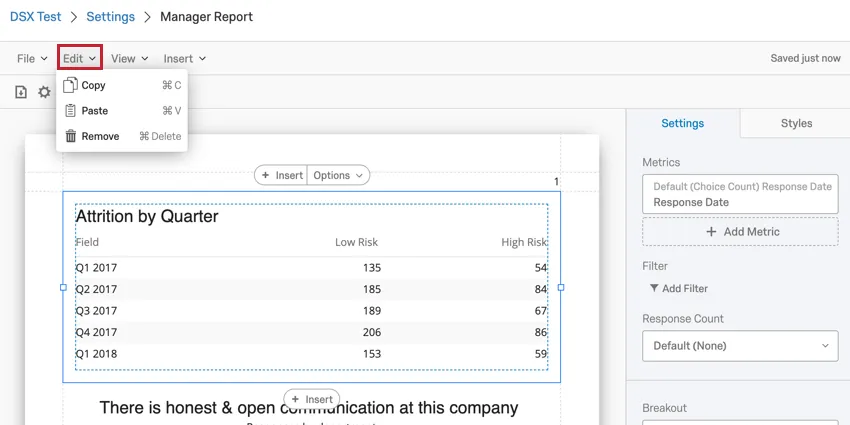
Qtip: To use the Edit menu, you need to select a report visualization by clicking on it. If the options in your Edit menu are grayed-out, that means you still need to select a visualization.
After selecting a visualization to edit, you can perform the following actions using the Edit menu:
- Copy: This action copies the currently selected visualization.
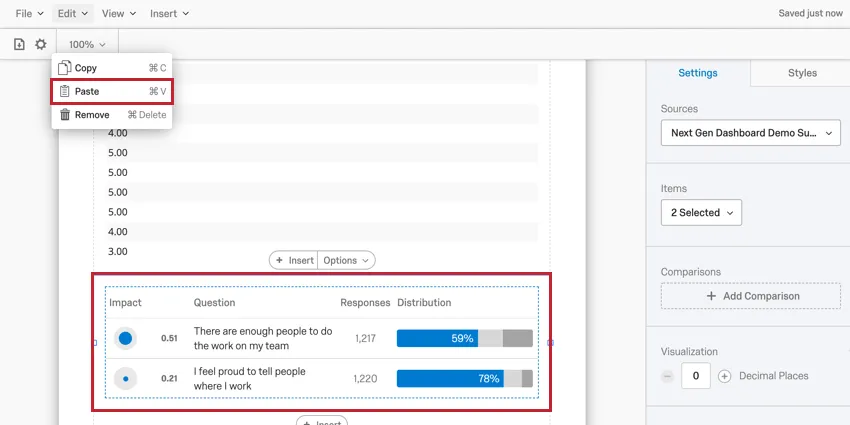
- Paste: This action pastes a copied visualization below the visualization you have selected. Example: I have a visualization copied that I’d like to insert below a Question List visualization. After clicking the Question List visualization, I can then click Edit and then Paste to insert the copied visualization below the Question List visualization.

- Remove: This action deletes the selected visualization. Deleted visualizations are unrecoverable once deleted.
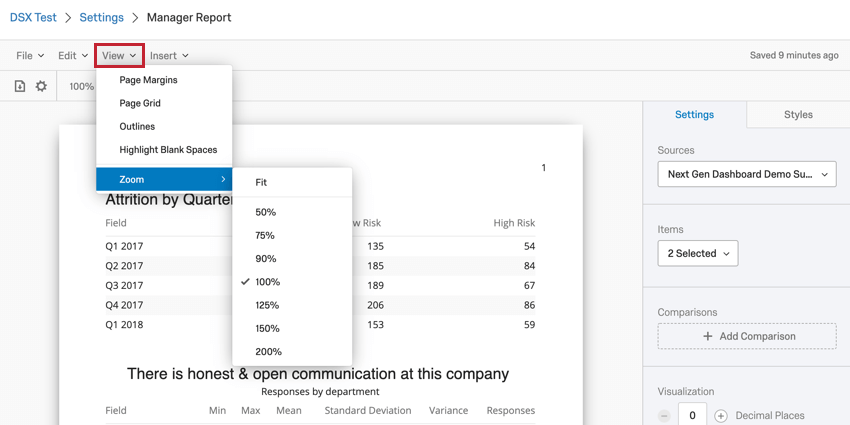
View Menu
The View menu allows you to add visual markers to your report template to help you format its layout. These markers are for helping you build your report template, and are not included when you export the report template.
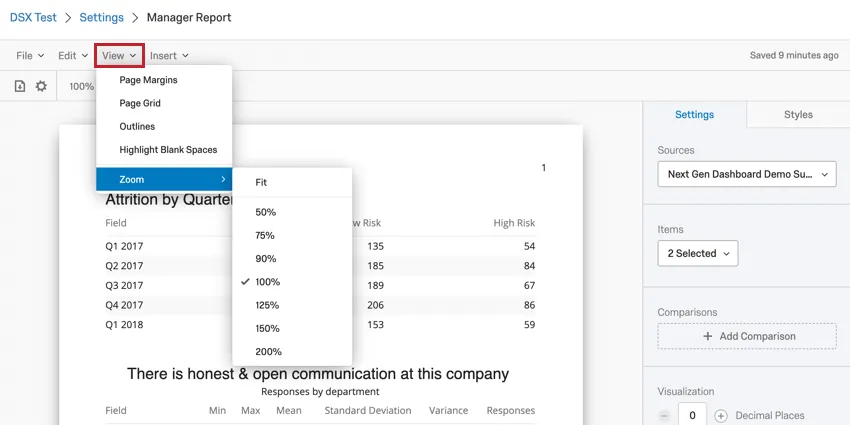
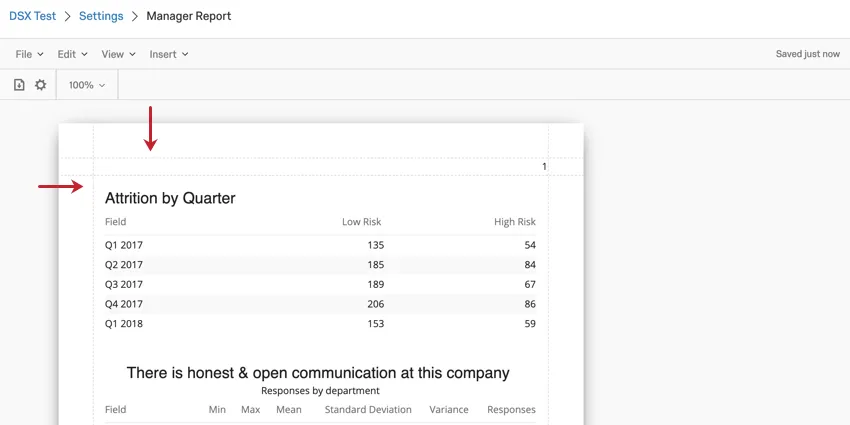
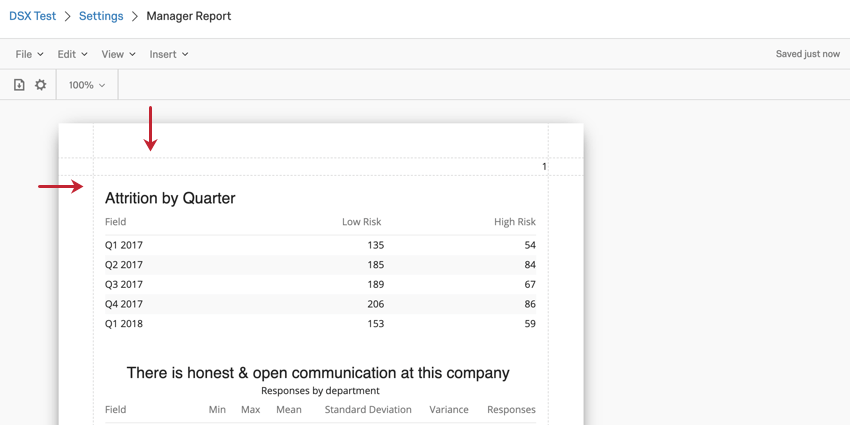
- Page Margins: When selected, this option adds lines to show the margins of your report template.
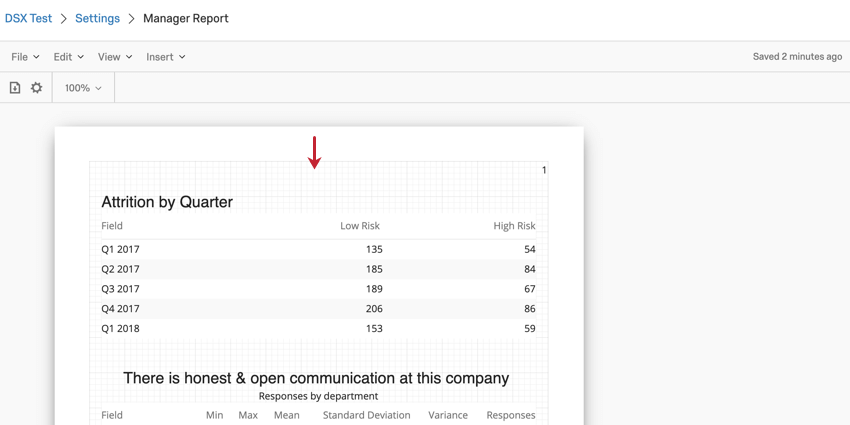
- Page Grid: When selected, this option adds a grid to your report template.

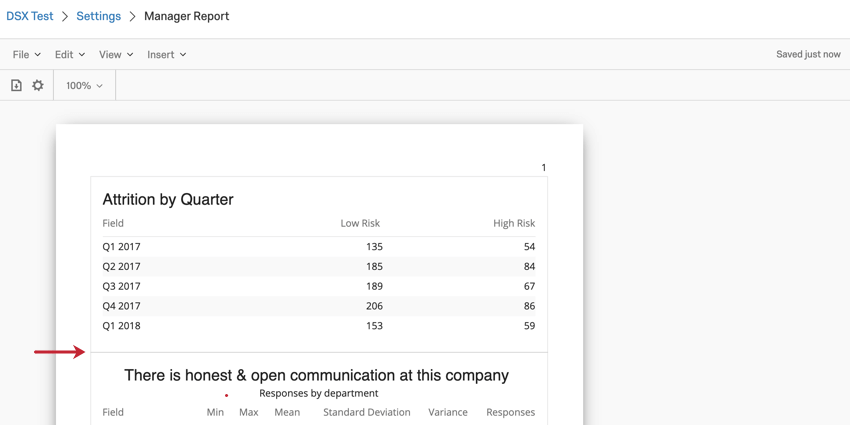
- Outlines: When selected, this option adds outlines to your data visualizations.
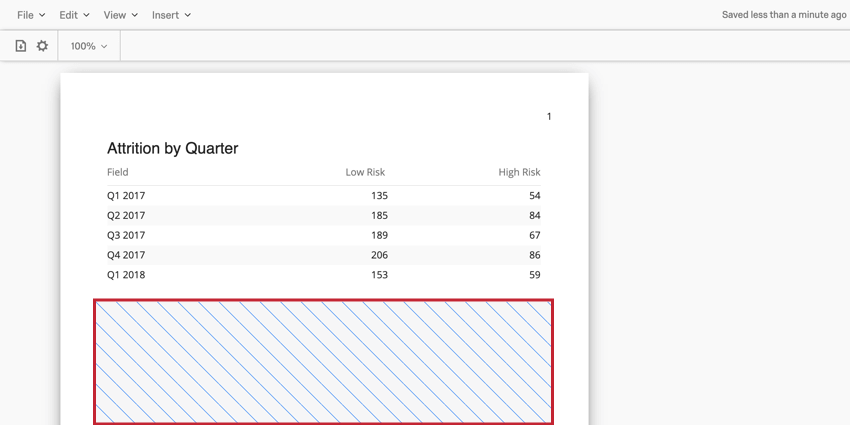
- Highlight Blank Spaces: When selected, this option highlights the blank spaces in your report template, making them easily identifiable.

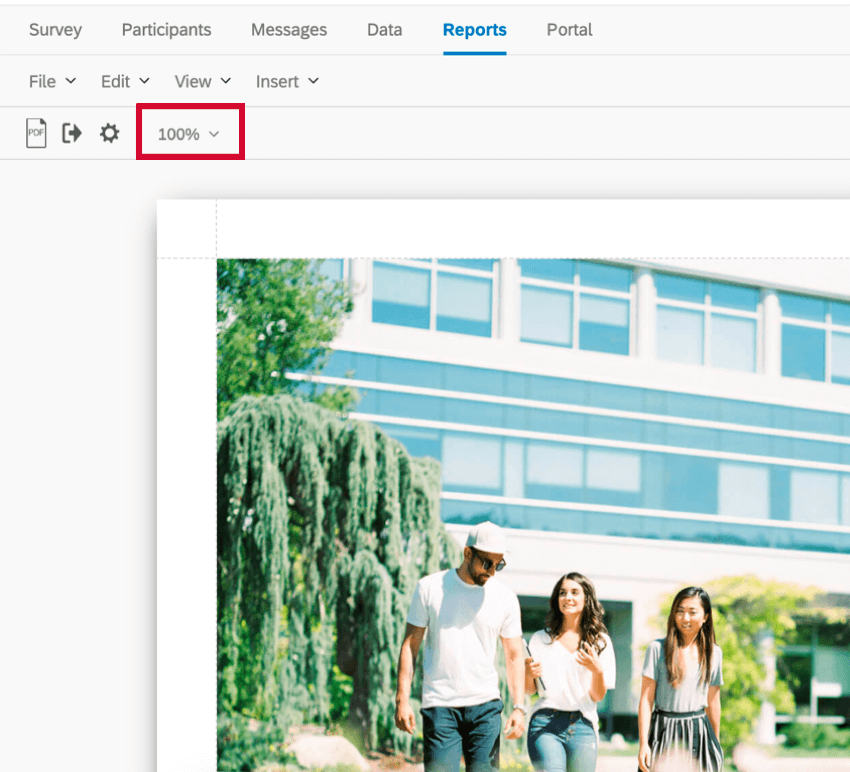
- Zoom: Zoom into and out of the report. The option Fit will fit the report to the page. Qtip: You can also adjust the zoom using the zoom dropdown, shown below.


Insert Menu
The Insert menu is used to insert content into your report. This includes data visualizations, page breaks, headers, and more!
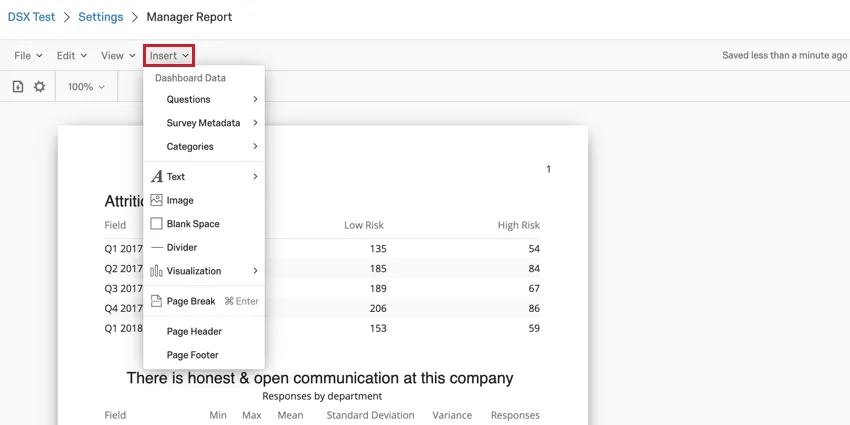
- Questions: After selecting Questions, you will be able to select a field from your mapped Dashboard Data to be inserted as a data visualization.
- Survey Metadata: Allows you to report on various survey metadata, such as Recorded Date, Survey Started Date, etc.
- Categories: Allows you to report on categories set up in the Categories section of your dashboard settings.
- Text: After clicking Text, you can choose to insert either a Text Area where you can type text for your report viewers to read or add a Filter Summary which will show you the dashboard filters that are applied when you export your report.
- Image: Inserts an image into your report template. You can choose an image from your Library or provide the URL of an image hosted online.
- Blank Space: Inserts a blank space into your report template.
- Divider: Inserts a horizontal or vertical line into your report template.
- Visualization: Inserts a data visualization into your report template. There are three different classes of visualizations: charts, tables, and other. See our List of Report Template Visualizations to learn more about these visualization types.
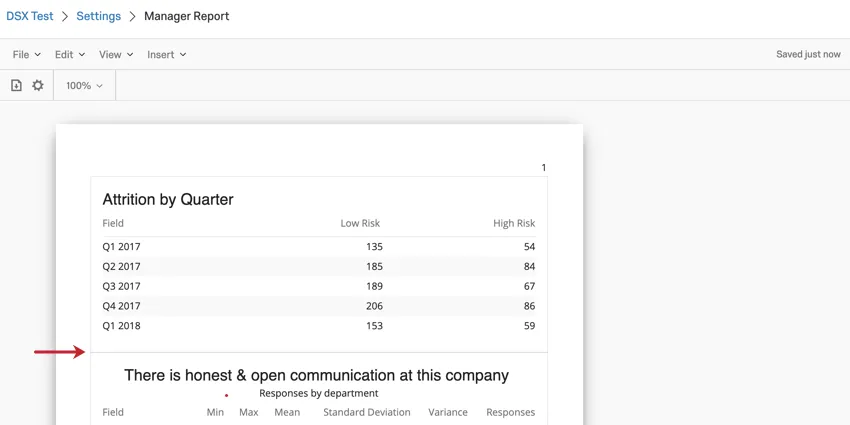
- Page Break: Inserts a page break into your report template.
- Page Header: Add a header to your report template.
- Page Footer: Add a footer to your report template.
For more information about inserting content into your report, read our page on Inserting Content.
Global Report Settings
You can configure global report settings so that you don’t have to edit fonts, margins, colors, and other visualizations one-by-one.
For most functionality, you can see the Global Settings support page for Advanced-Reports. Please note that the linked support page is for a similar feature in the Survey Platform, and only the linked section is relevant.
Attention: Global settings for decimal places do not work with EX-exclusive visualizations. This includes Question List, Scorecard, Engagement Summary, Response Rates, Participation Summary, and Heat Map.
However, there are a few settings that are different in report templates. Please read the following sections for more details.
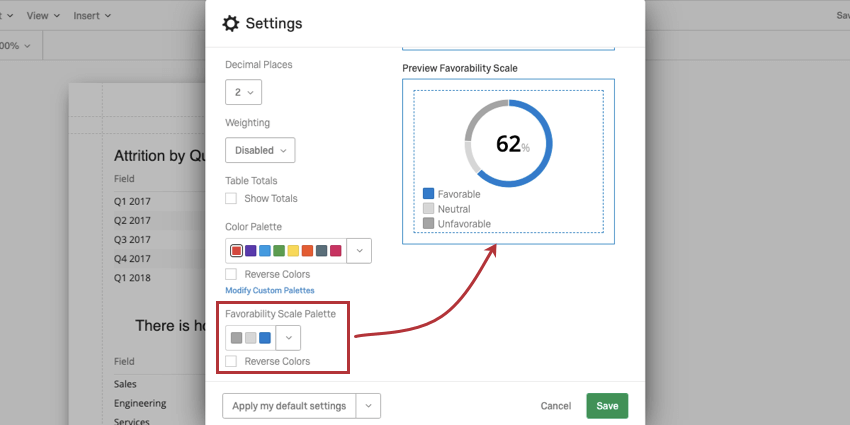
Favorability Scale Palette
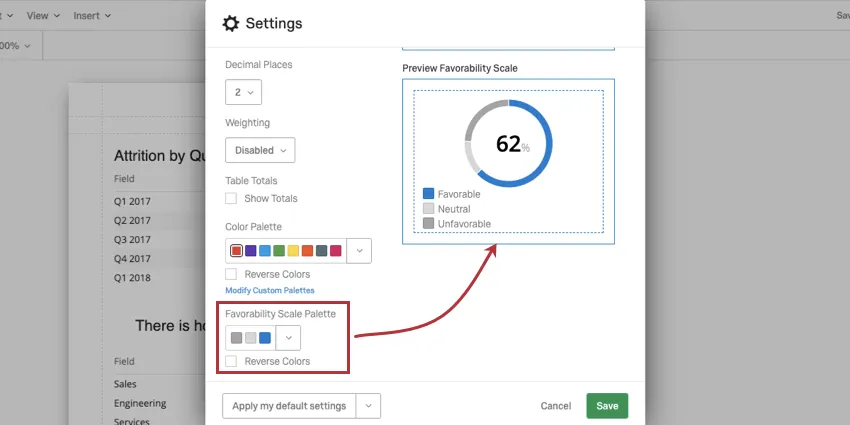
The favorability scale affects the colors of scales in your Engagement Summaries, Participation Summaries, Scorecards, and Question Lists, when they are included in the report.
Click the dropdown to select from a list of premade palettes, or to add a custom palette. When testing the different palettes, the widget to the right will give a preview of how colors would be assigned to a real chart.
Select Reverse Colors to reverse the order that the colors in the palette are assigned.
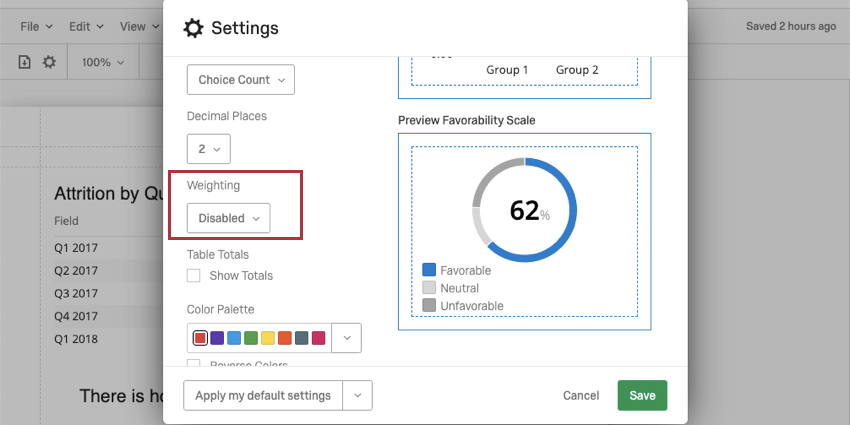
Weighting
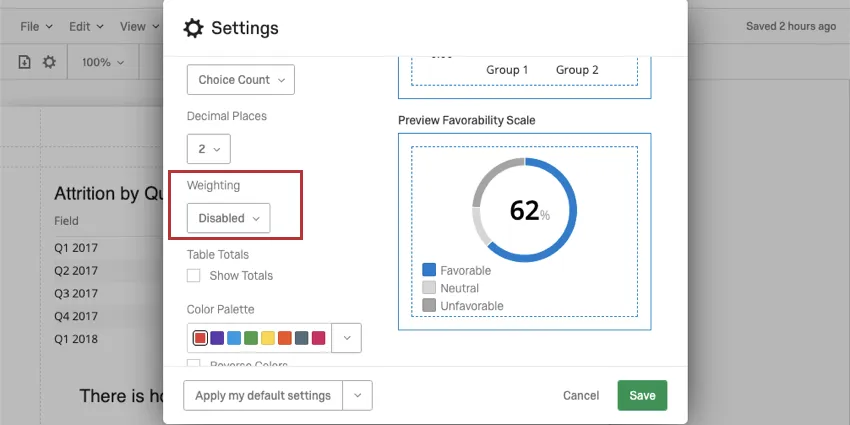
This setting is only useful in survey projects. Engagement, Lifecycle, and Ad Hoc Employee Research projects do not have weighting.
If you have set up Response Weighting, determine if you will use the weighted values in your report or if you will use the unweighted data.
Select Disabled to use unweighted data in the report. Select Enabled to use the weights.
Translating Report Templates
Report templates can be translated, allowing employees to view reports in their preferred language. There are 3 parts of the report template that can be translated:
Warning: Before translating your report, make sure that it’s completely built out. If you make edits to your report after translating it, you will need to repeat the translation process in order for those edits to be translated.
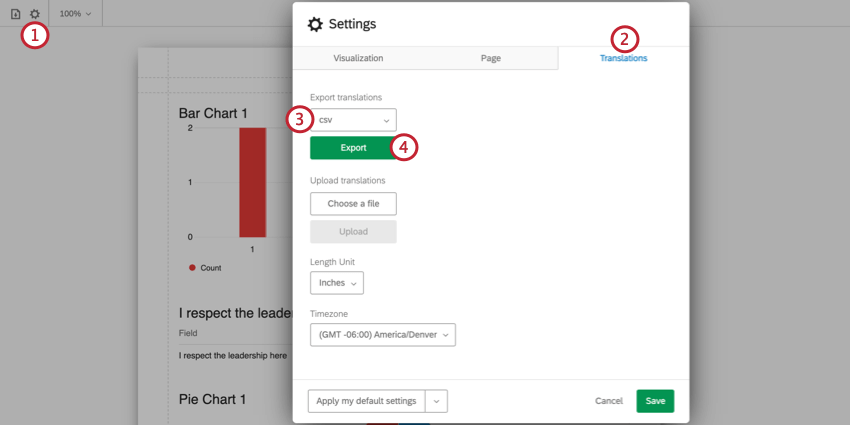
How to Translate a Report Template
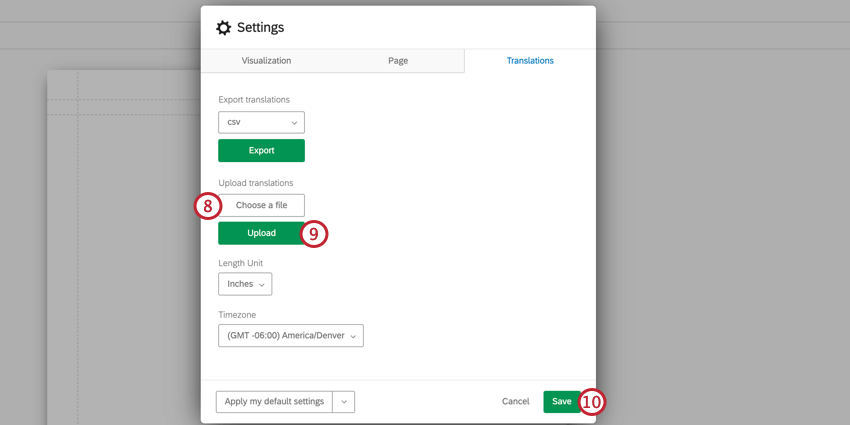
The process for translating a report template consists of exporting a translation file from Qualtrics, adding your desired translations, and then uploading the translation file back into Qualtrics.
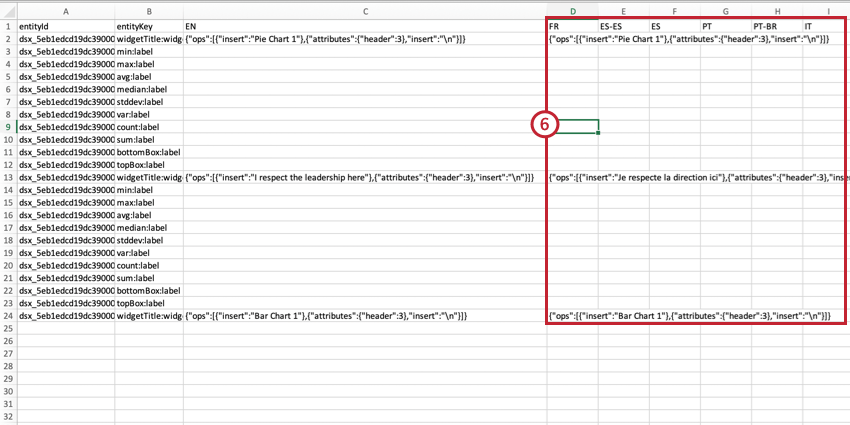
- See the List of Language Codes page for guidance about each language column.
- Follow the file’s exact formatting for creating your translations.
- Use the English column (EN) as a guide.
- Copy and paste to ensure formatting is correct. Do not delete or rearrange the columns, as this will cause the import to fail and translations to be lost.
- Please do not edit anything in the entityId or entityKey columns. Do not delete any strings of numbers and letters – these are internal IDs that identify the parts of the dashboard you are translating. Qtip: Make sure Excel formulas have been converted to plain text. To do this, you can highlight all the values in your sheet, copy them, then paste them without formatting / paste values only.
Partial Translations
You don’t have to upload the dashboard’s entire translation all at once. You can instead upload partial translations. This makes it easy to correct translations for small edits.
Here are some recommendations to ensure partial translations are uploaded properly:- Always keep the header (first) row of the exported file
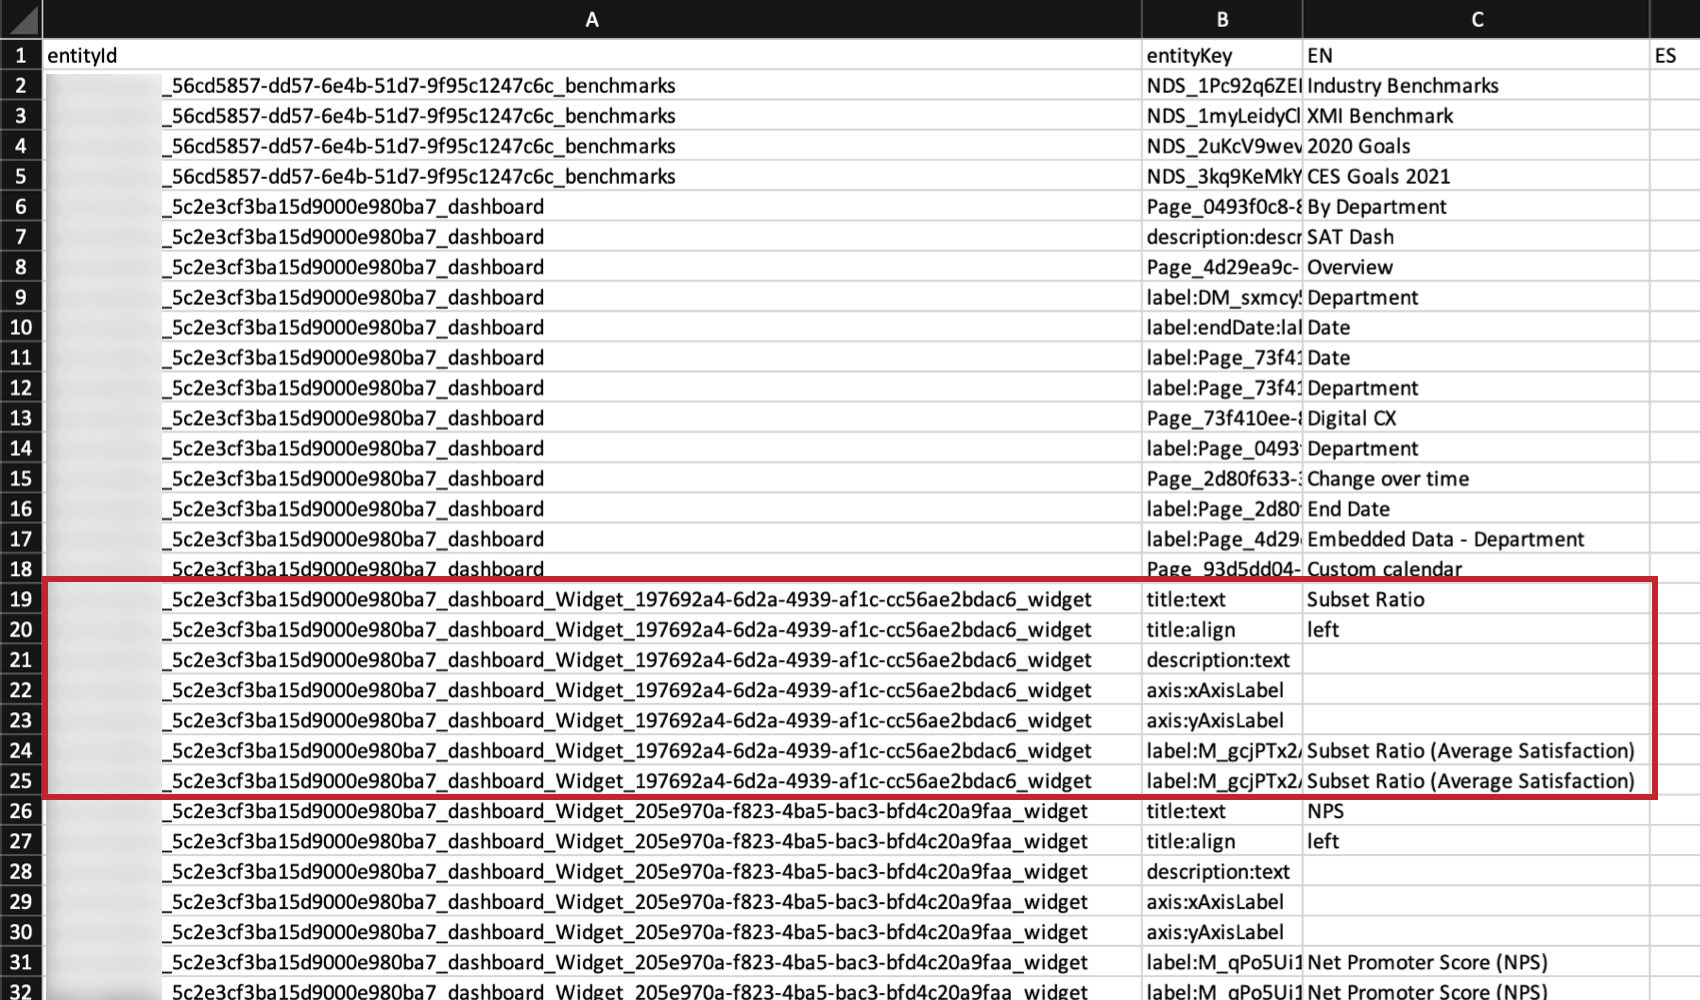
- The smallest section you can upload at a time is called an entity. Each widget is its own entity. All rows that belong to the same entity have the same entityId. You must have all of the rows related to a single entity for an import to work.
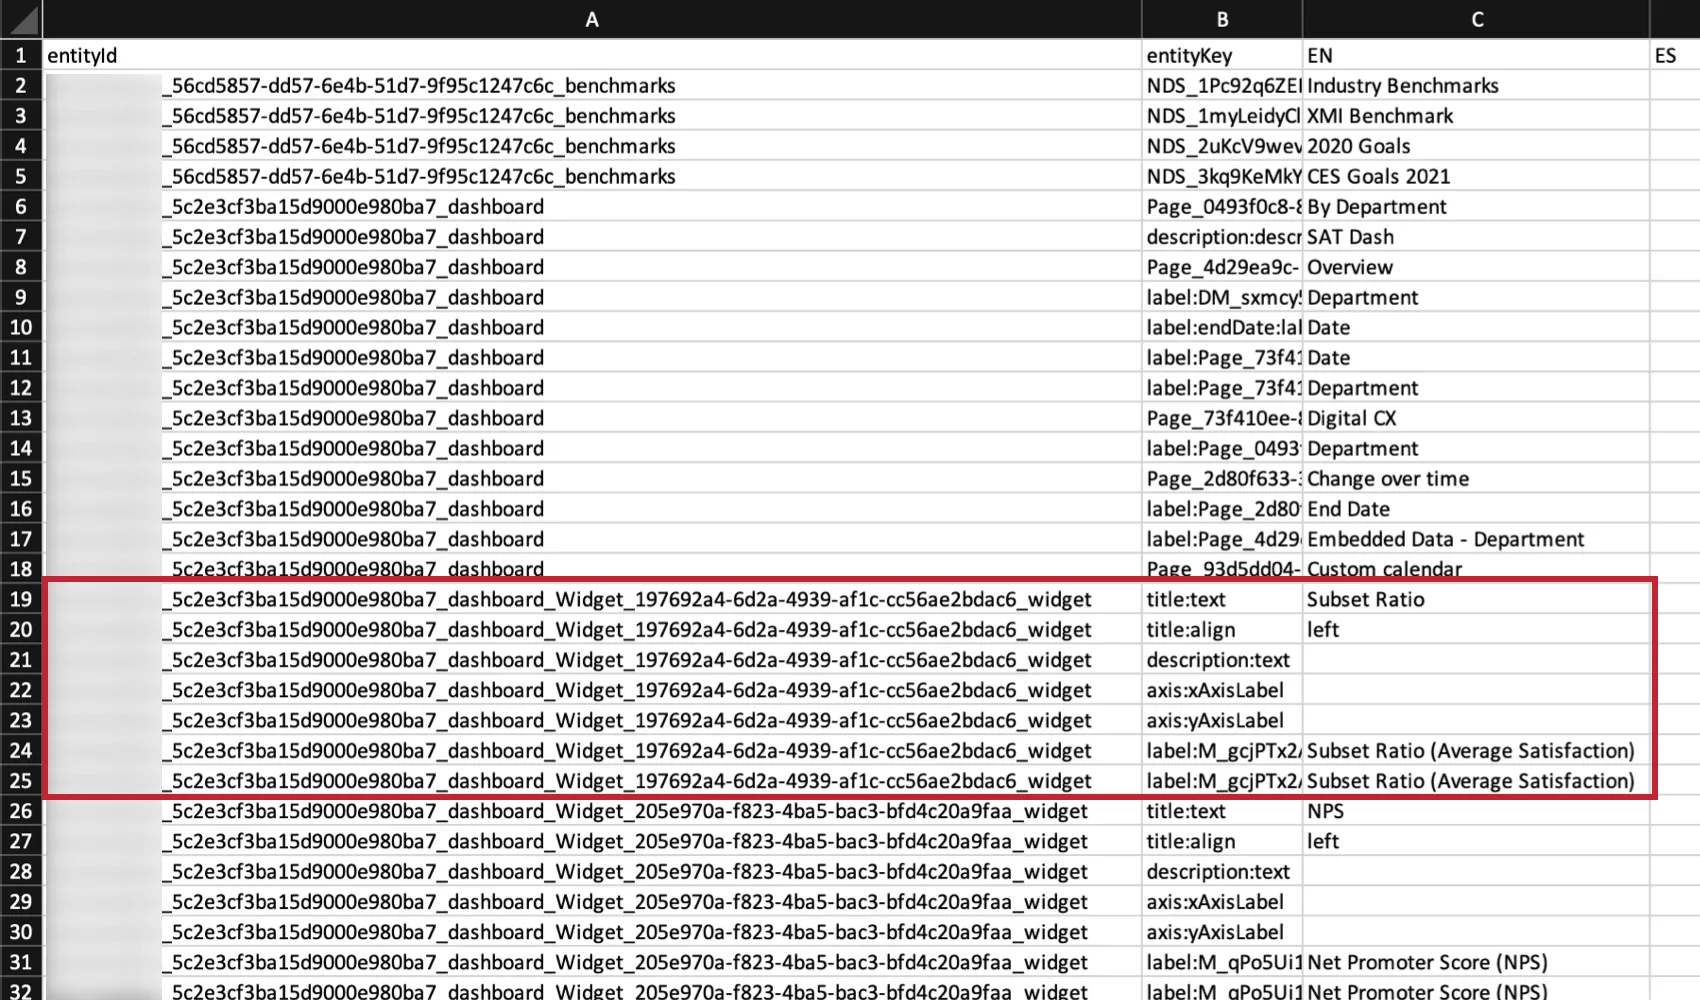 Example: For example, if you’re translating your focus areas widget, you must include every row related to the focus areas widget.Warning: If you upload only a few of an entity’s rows instead of all of them, any previous translations you uploaded for missing rows will be deleted.
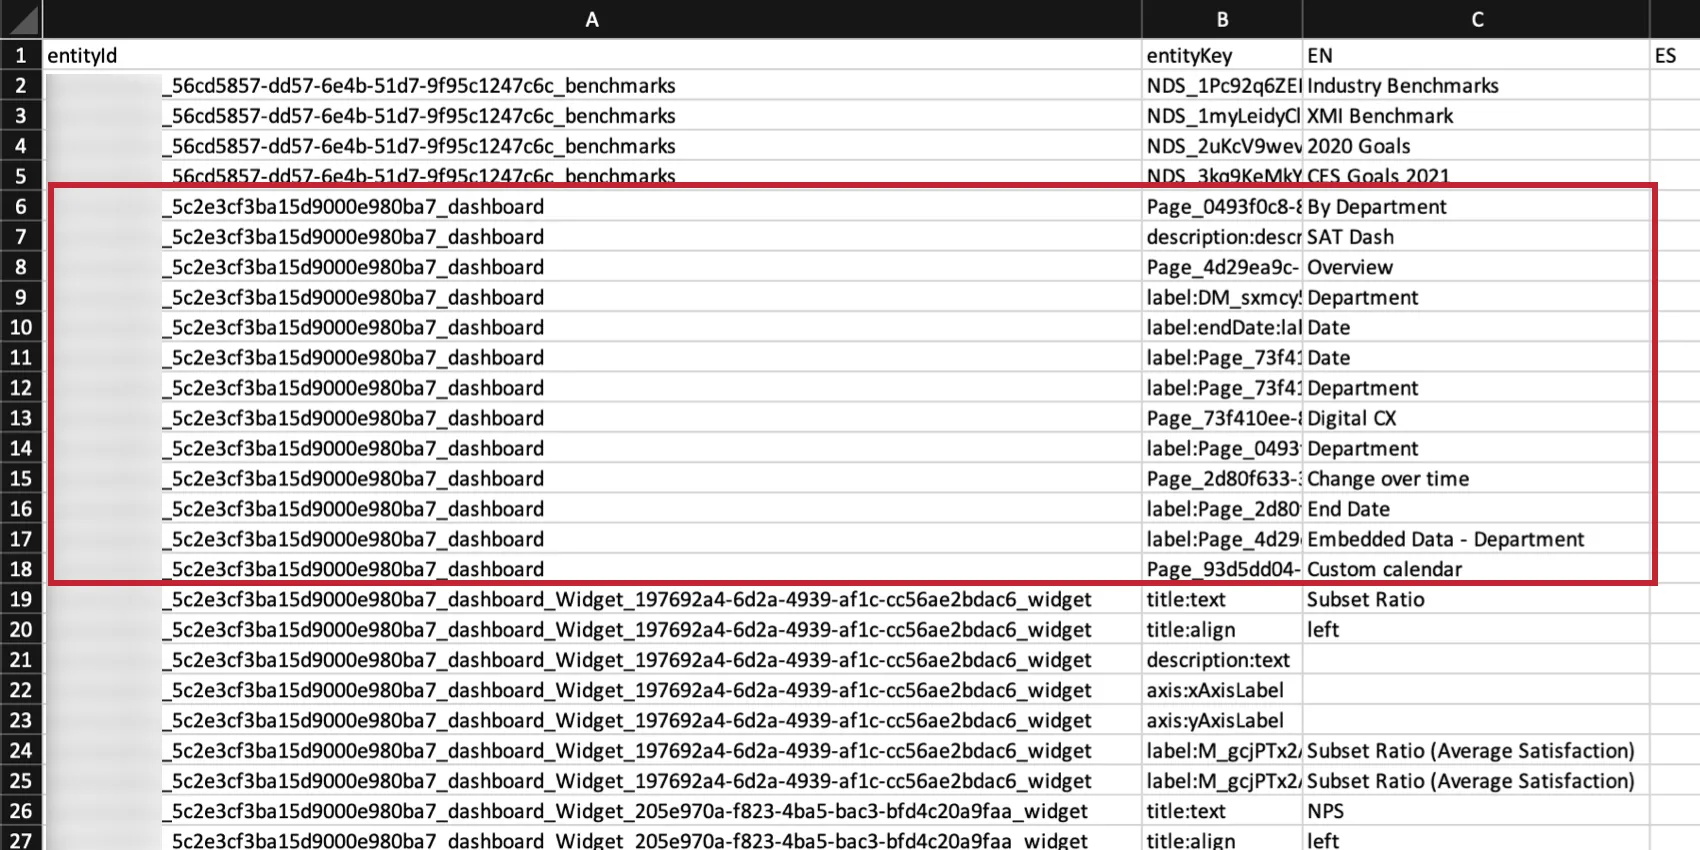
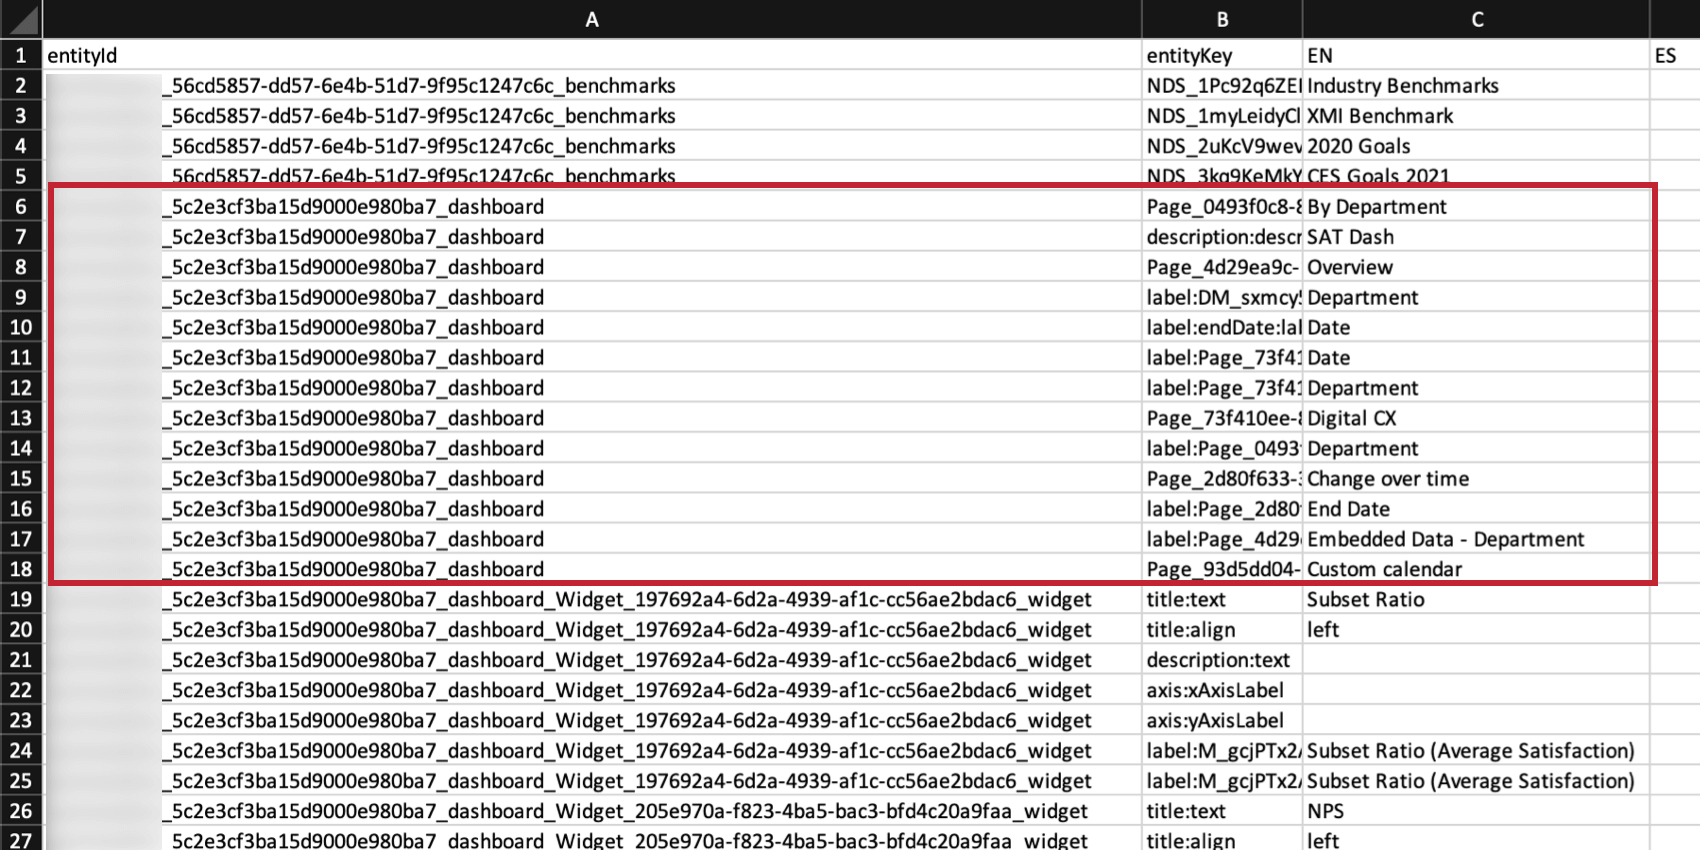
- All of the labels for the dashboard, like page names and filter summaries, must be uploaded together. These are considered a single entity.
- The best way to safely upload partial translations is to exclude all the rows of an entity you’re not translating. For example, if you’re not going to translate your focus areas widget, exclude all of the focus area rows from the file.
How Users See Translated Reports
When users export the report, it will export in the user’s account language if the language is available. If the report is not available in the user’s account language, then it will export in English.
Users can change their account language at any time in their user settings.
That's great! Thank you for your feedback!
Thank you for your feedback!