
Inserting Reports Content (360)
What's on this page
About Inserting Content
The Insert button on the reports toolbar allows you to add content to your reports, including visualizations, page breaks, headers and footers.
Qtip: Interested in other features of the toolbar? Visit the Reports Toolbar support page.
Inserting Visualizations
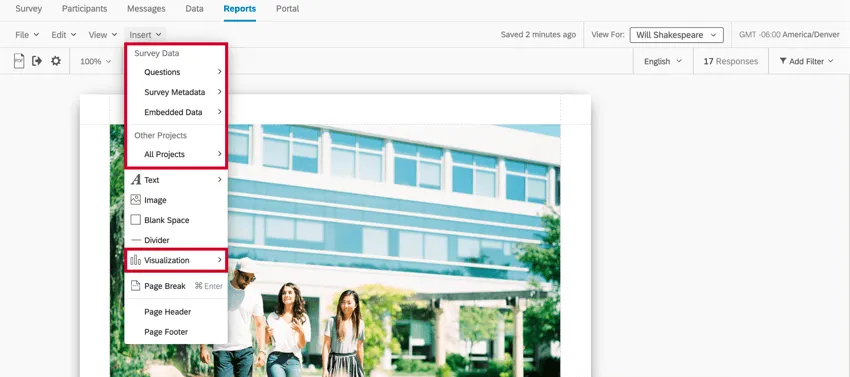
You can use the Insert button to insert visualizations into your report. See our support page on Adding and Removing Visualizations for further instruction.
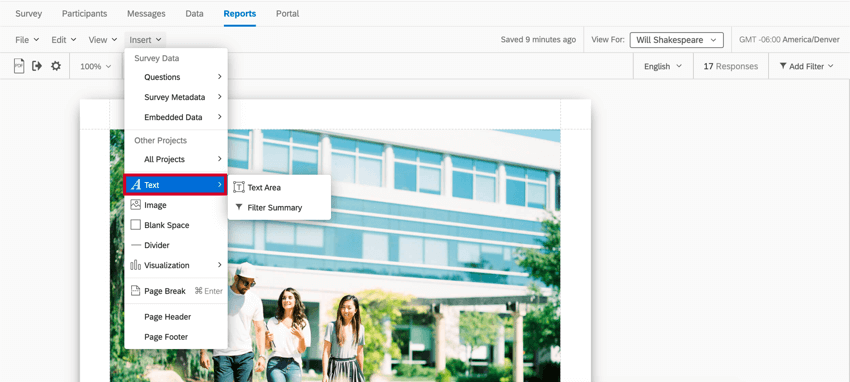
Inserting Text Areas
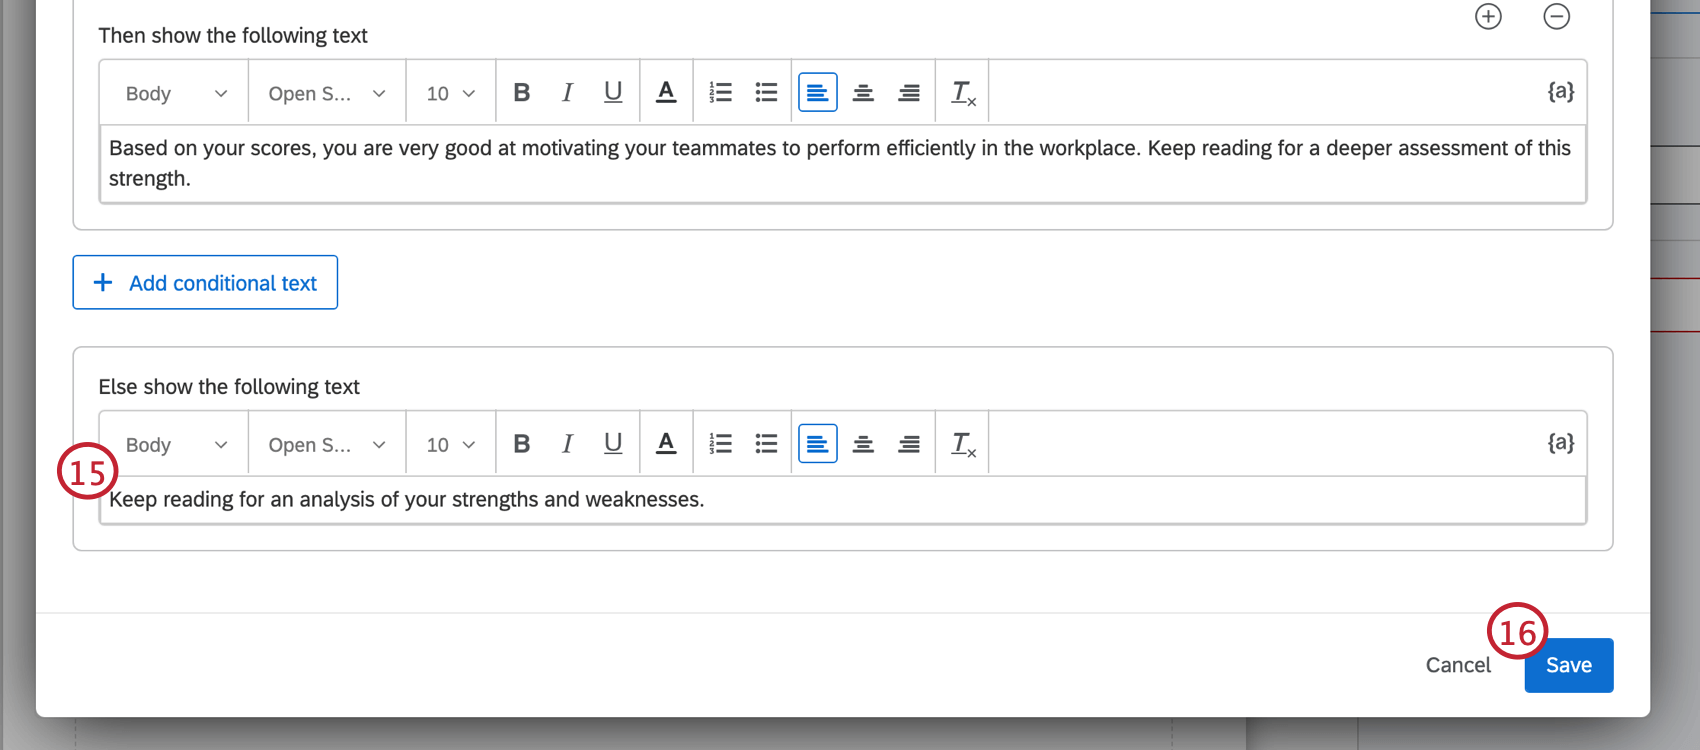
Click Insert then Text Area to add a Text Area to your report. This feature is useful if you want to add special headers, informational paragraphs, or other text to your report.
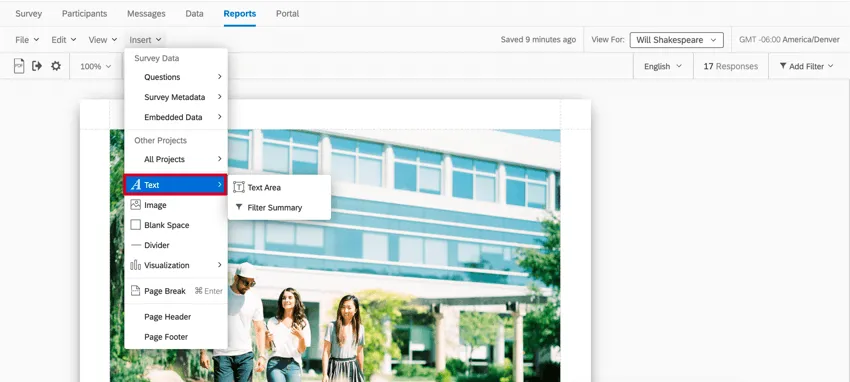
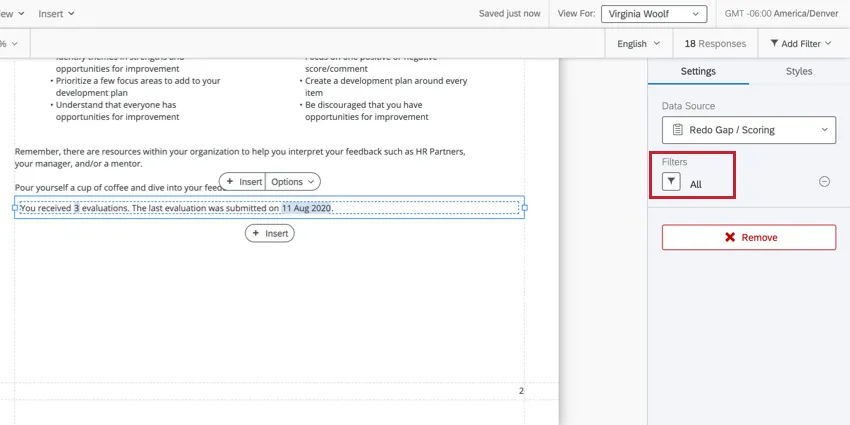
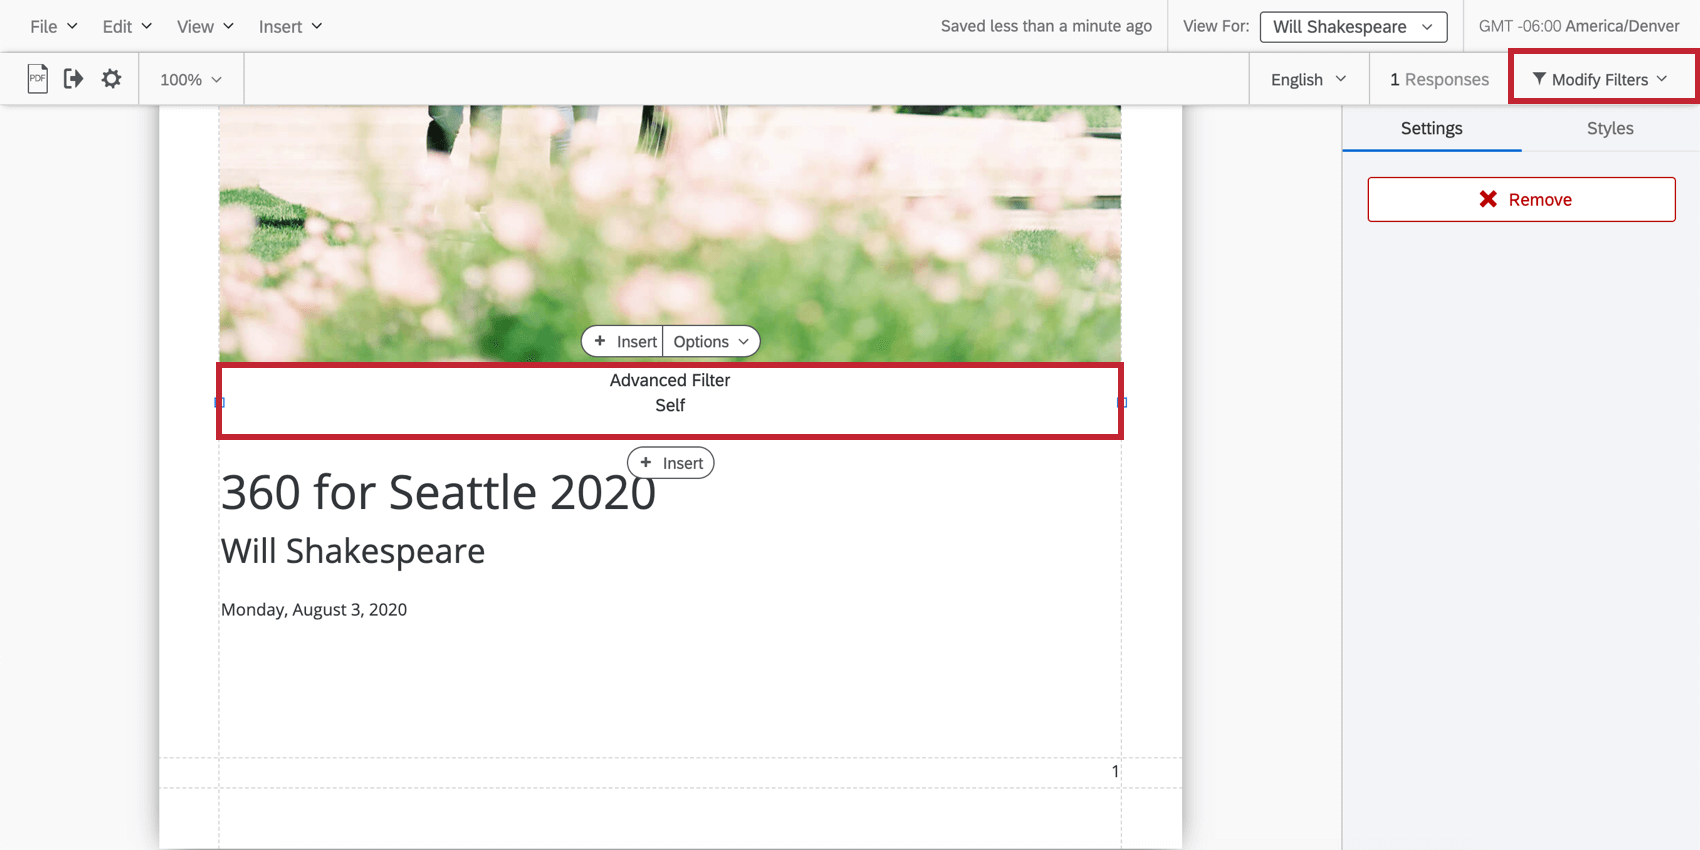
Click Filter Summary to insert a textual summary of the Filters you are using on the report. To change a Filter (and thus change the Filter Summary), click on Modify Filters. See Rater Group Filters or Basic Filters for more.

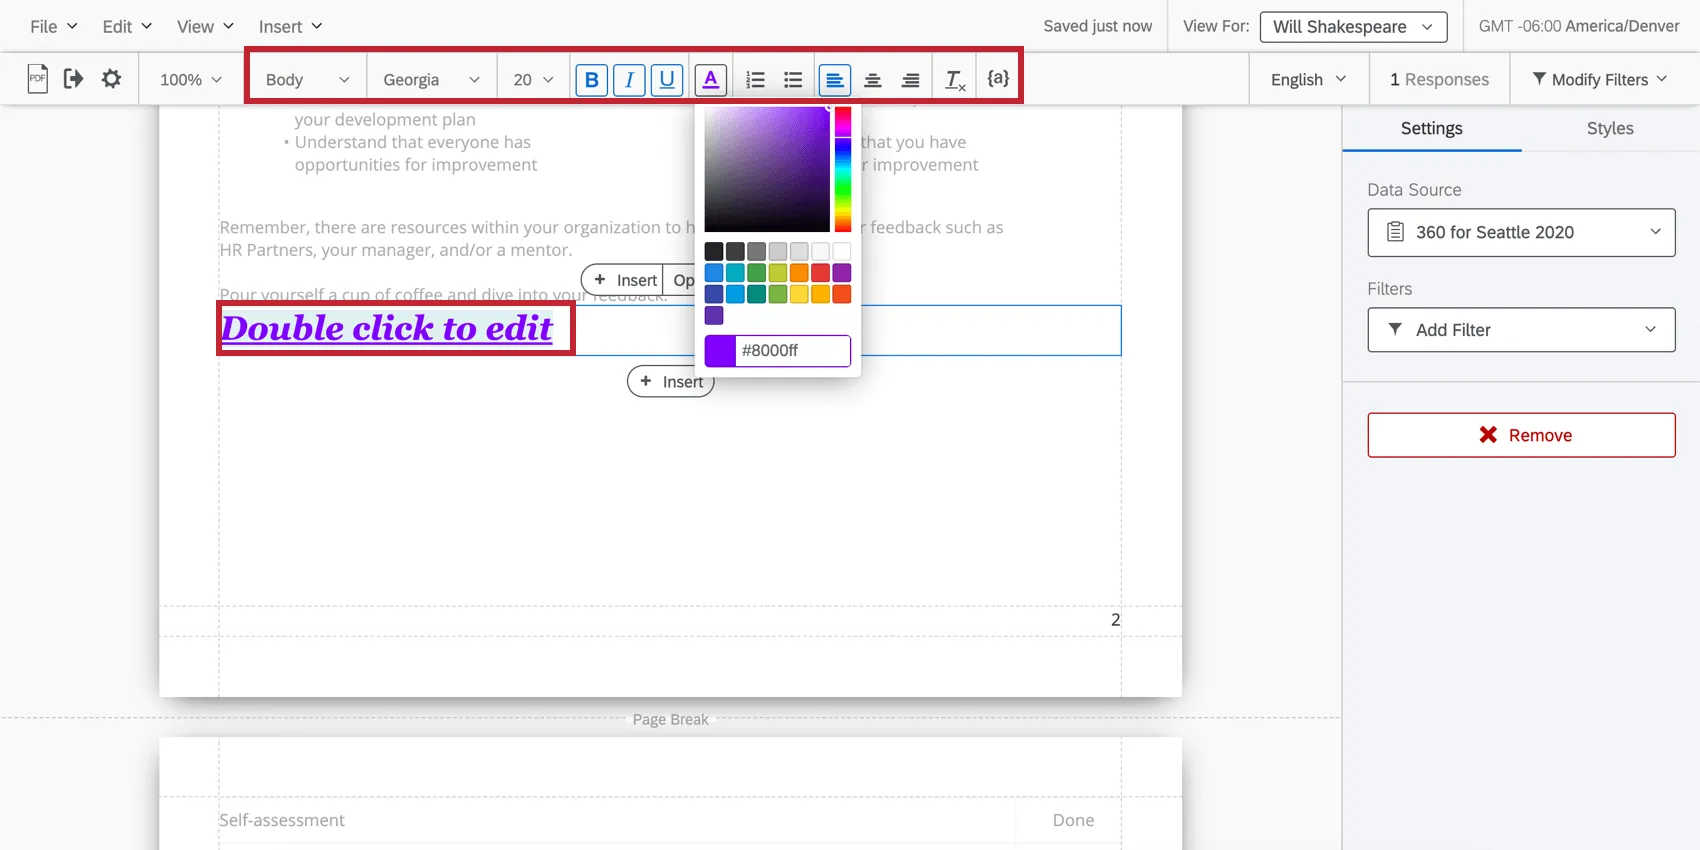
Once your Text Area is created, double-click the text to start editing. A Rich Content Editor will appear above to help you change font styles and formatting.
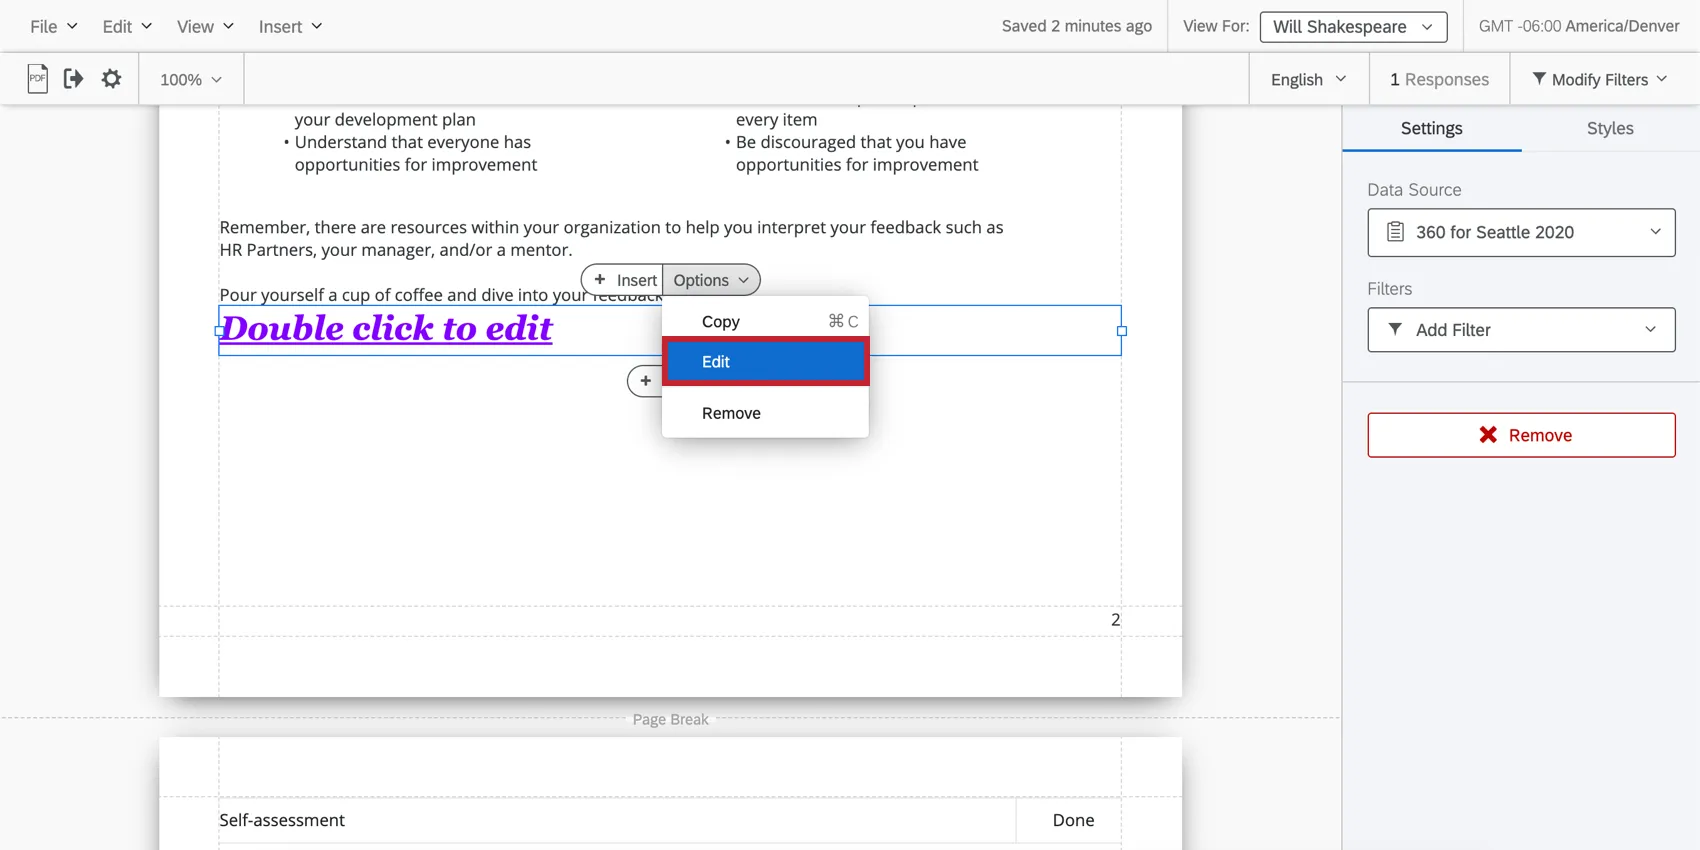
Qtip: You can also click Options and then Edit at the top of the Text Area to open the Rich Content Editor.

Piped Text
Rather than manually typing certain values into your reports (e.g., the number of responses), piped text serves as a placeholder that can dynamically pull in values as they update.
For more on piped text in 360 reports, see the next section.
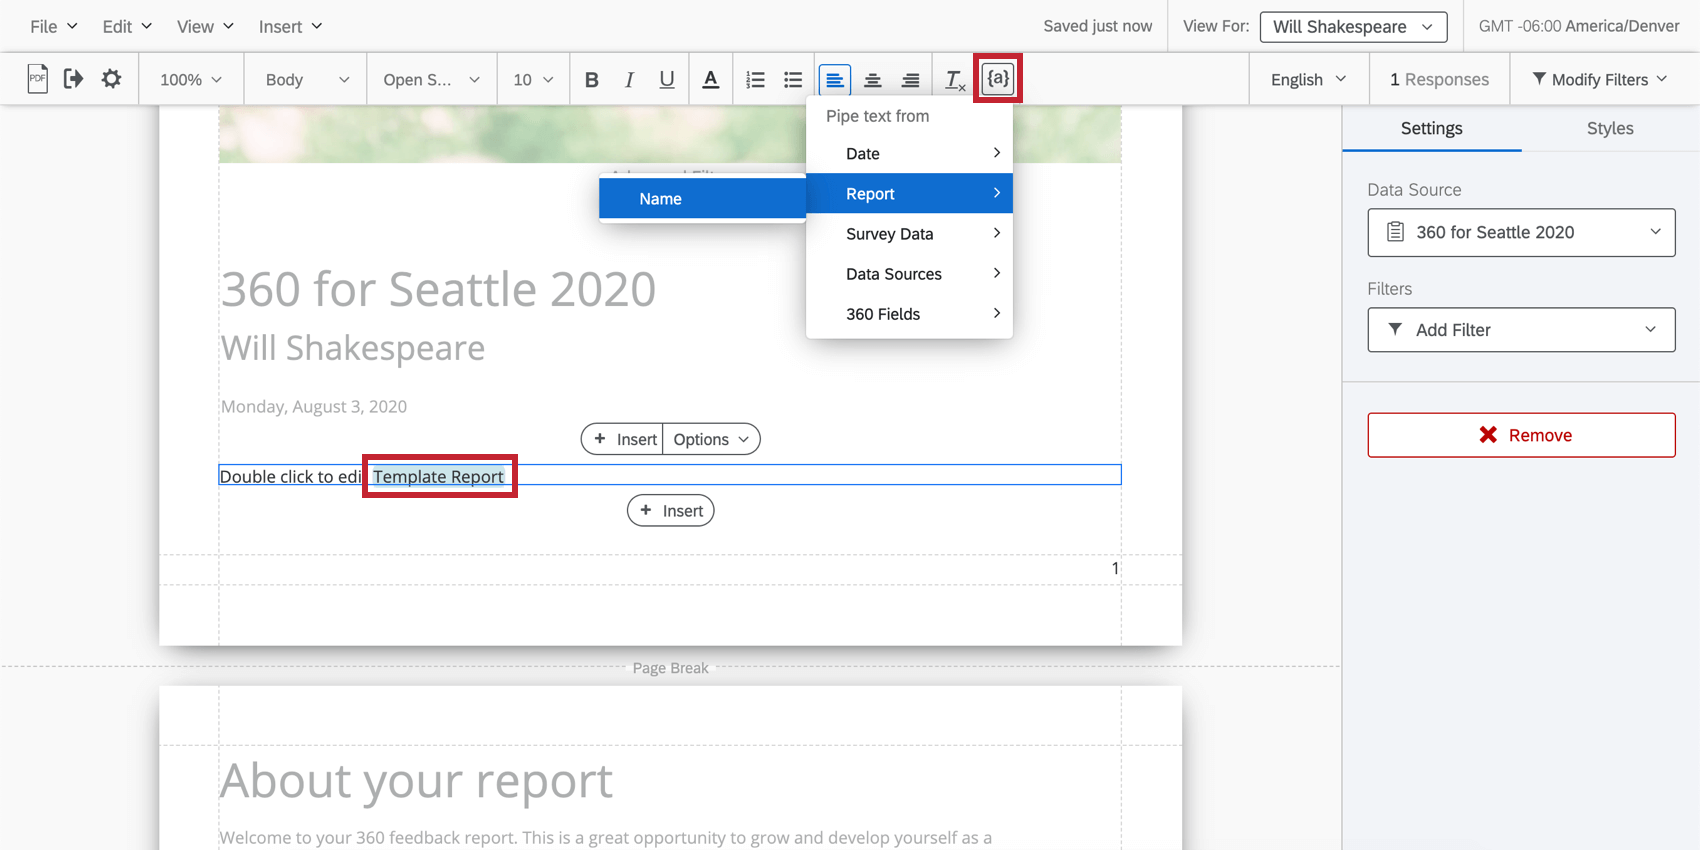
Piped Text
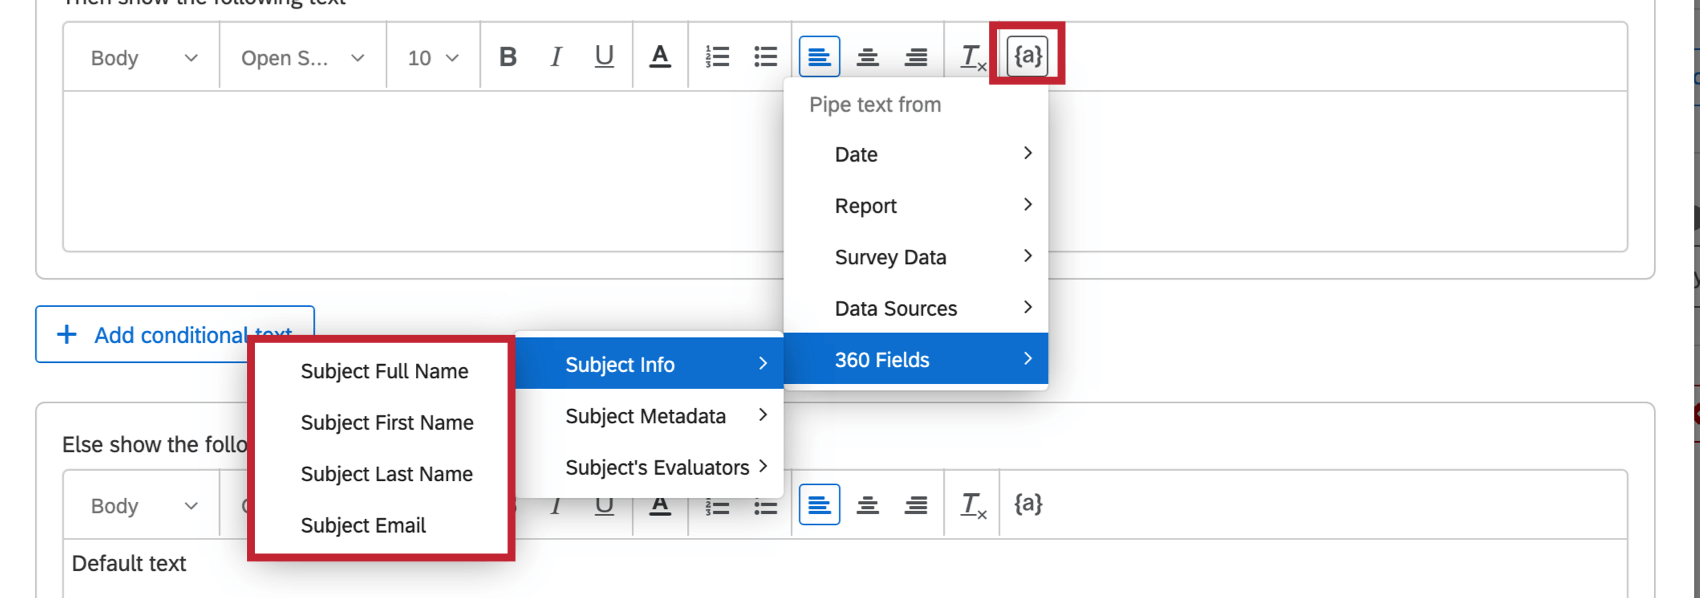
Rather than manually typing certain values into your reports (e.g., the number of responses), piped text serves as a placeholder that can dynamically pull in values as they update. Piped text can be inserted into text areas using the button ( {a} ) that appears when you edit a text area.

With the exception of the 360 fields, these fields you can pipe in are not subject-specific. For example, if you select “Survey Data” and “Responses,” you will see total number of responses in the 360 survey, not just the number of responses the subject received.
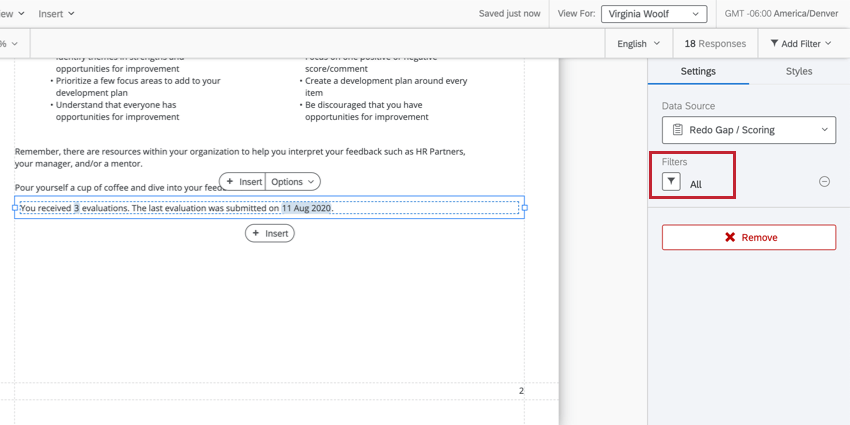
Qtip: For these fields to become subject-specific, you must add a filter to your text area that is set equal to “all” the subjects’ evaluations.
If the piped text being displayed doesn’t have a value, it will not show up in the subject report.
List of Fields
You can only pull certain fields into 360 reports using piped text. See the list below.
Qtip: Many of these fields can be affected by filters. For example, if you insert “Total responses,” then filter the text area only by subject responses, you’ll see the number of responses submitted for that subject instead of the total number in the whole survey.
- Date: Pull in today’s date in a variety of formats.
- Report
- Name: Pull in the name of the report (not the subject themselves).
- Survey data: These options all pull in data from the 360 project.
- Name: The name of the 360 project.
- Status: The project’s status.
- Total responses: The total number of responses received by the survey.
- Last response date: The date of the last response submitted.
- Questions: Choose a question asked in the 360 project. Then choose if you’d like to pull in a mean, minimum, maximum, Net Promoter Score, response count, or sum.
- Embedded data: Pull in the name (not the value) of an embedded data field that’s saved to the survey.
- Data sources: Pull in information from another Employee Experience project. These fields include Name, Status, Total responses, Last response date, Questions, and Embedded Data. Qtip: Keep in mind that because these fields are pulling information from another project, they will not react to filters the same way.

- 360 Fields
- Subject info: Pull information about the subject, such as full name, first name, last name, or email address.
- Subject metadata: Pull in metadata saved to the subject. This shows the value, not just the field’s name. Example: We pipe in the subject’s “Office” metadata. When Jan looks at her report, she sees “Provo,” because that’s the office she’s located in.

- Subject’s evaluators: You can list the names of every evaluator a subject has assigned to them. You can select evaluators by relationship
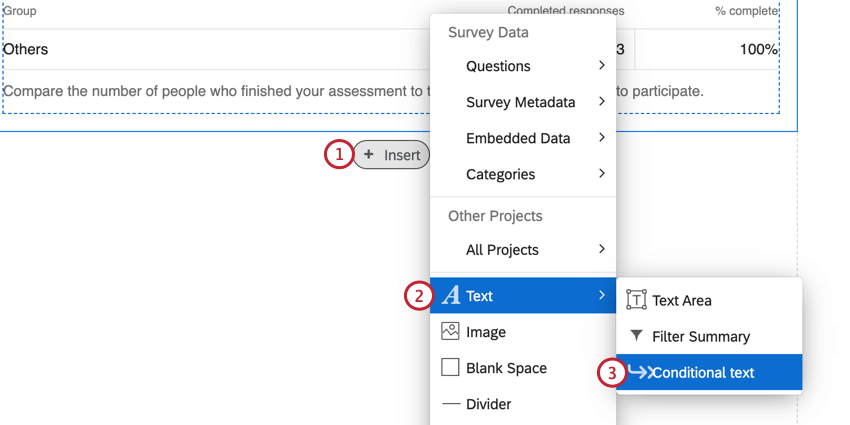
Inserting Conditional Text
Conditional text allows you to display different text to different report viewers based on criteria you set. For example, based on how a subject scores in a certain category, you may want the text that displays to them to be catered to their score. You can base your conditional text on a participant’s score, their response to a numerically formatted question, their person metadata, their relationship, and more.
Qtip: When ranking scoring categories, conditional text always considers all scoring categories in the project. You cannot limit rankings to a subset of scoring categories.
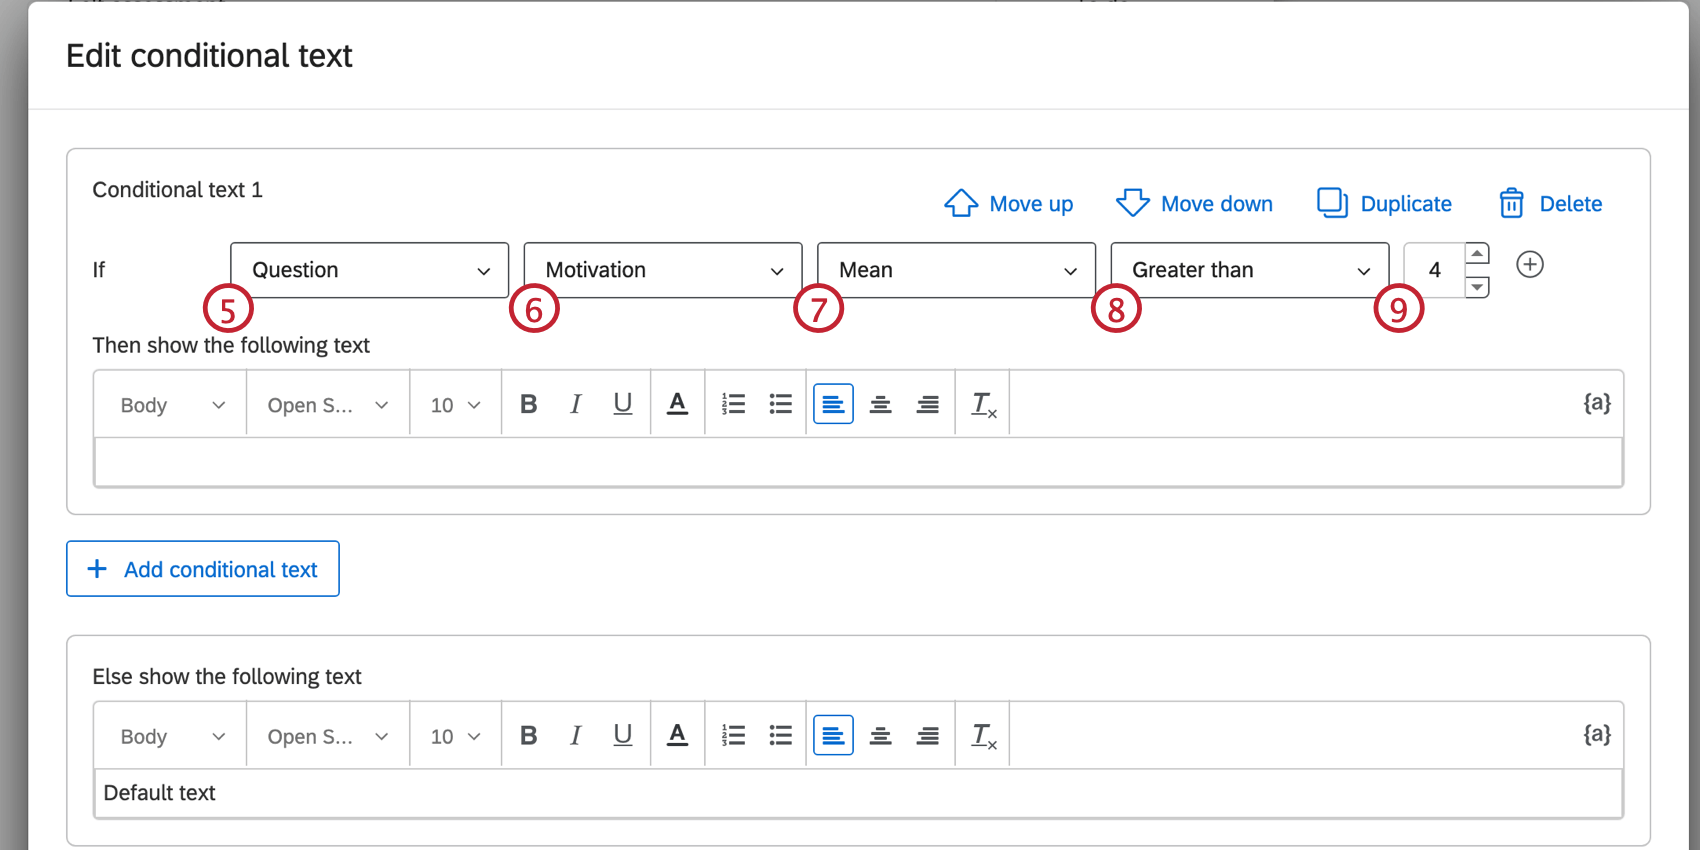
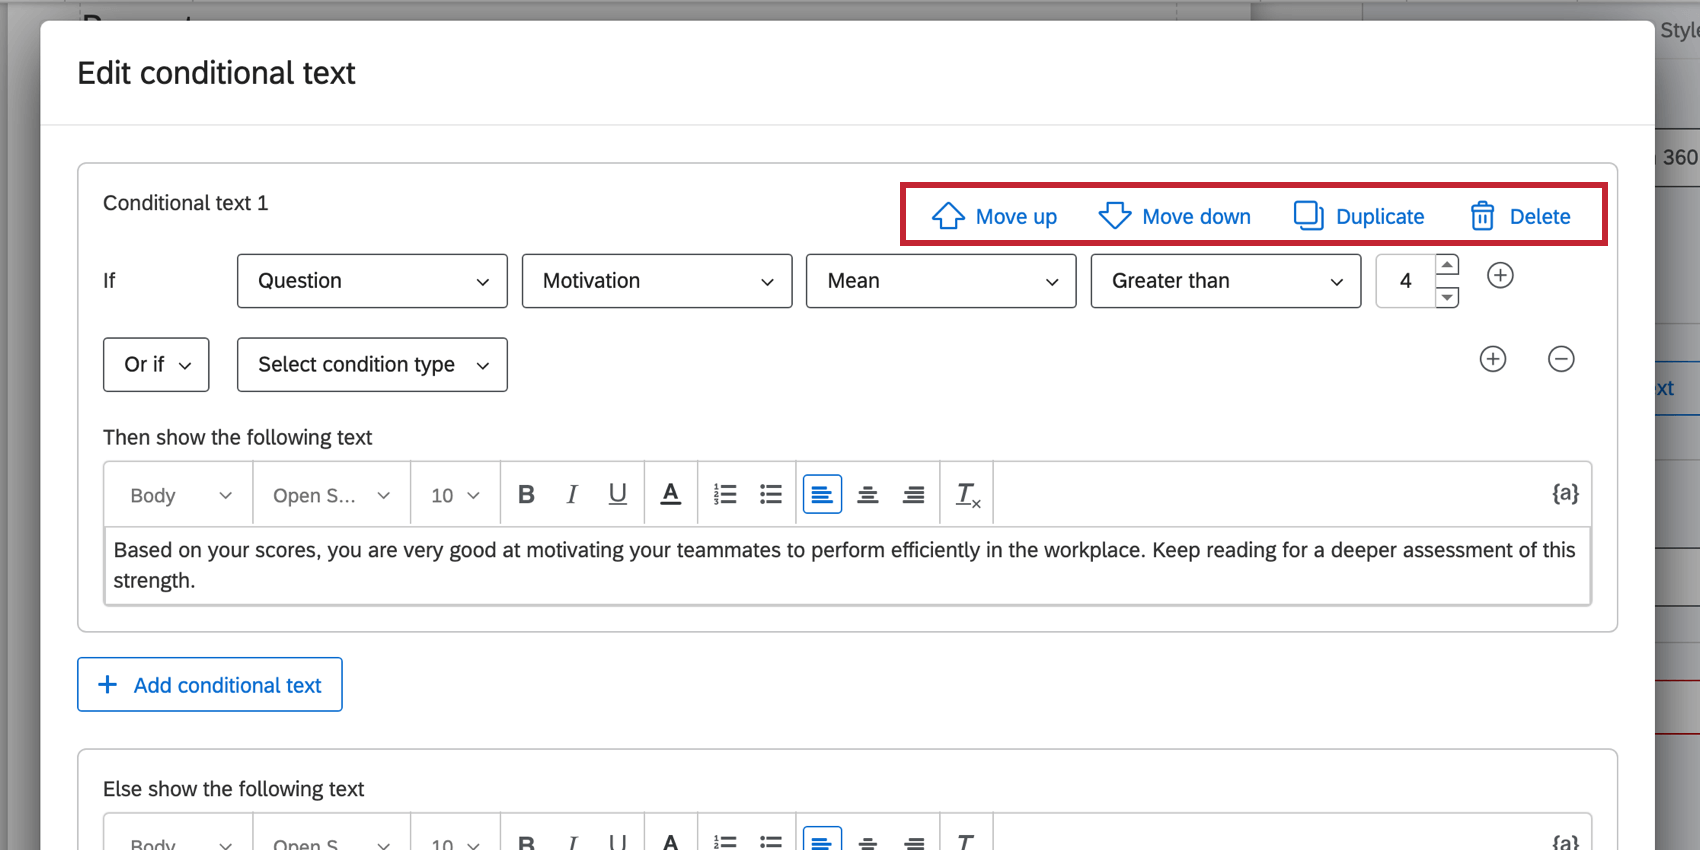
Example: In the above steps, the conditional text will display if the respondent’s mean score for the question “Motivation” is above 4.
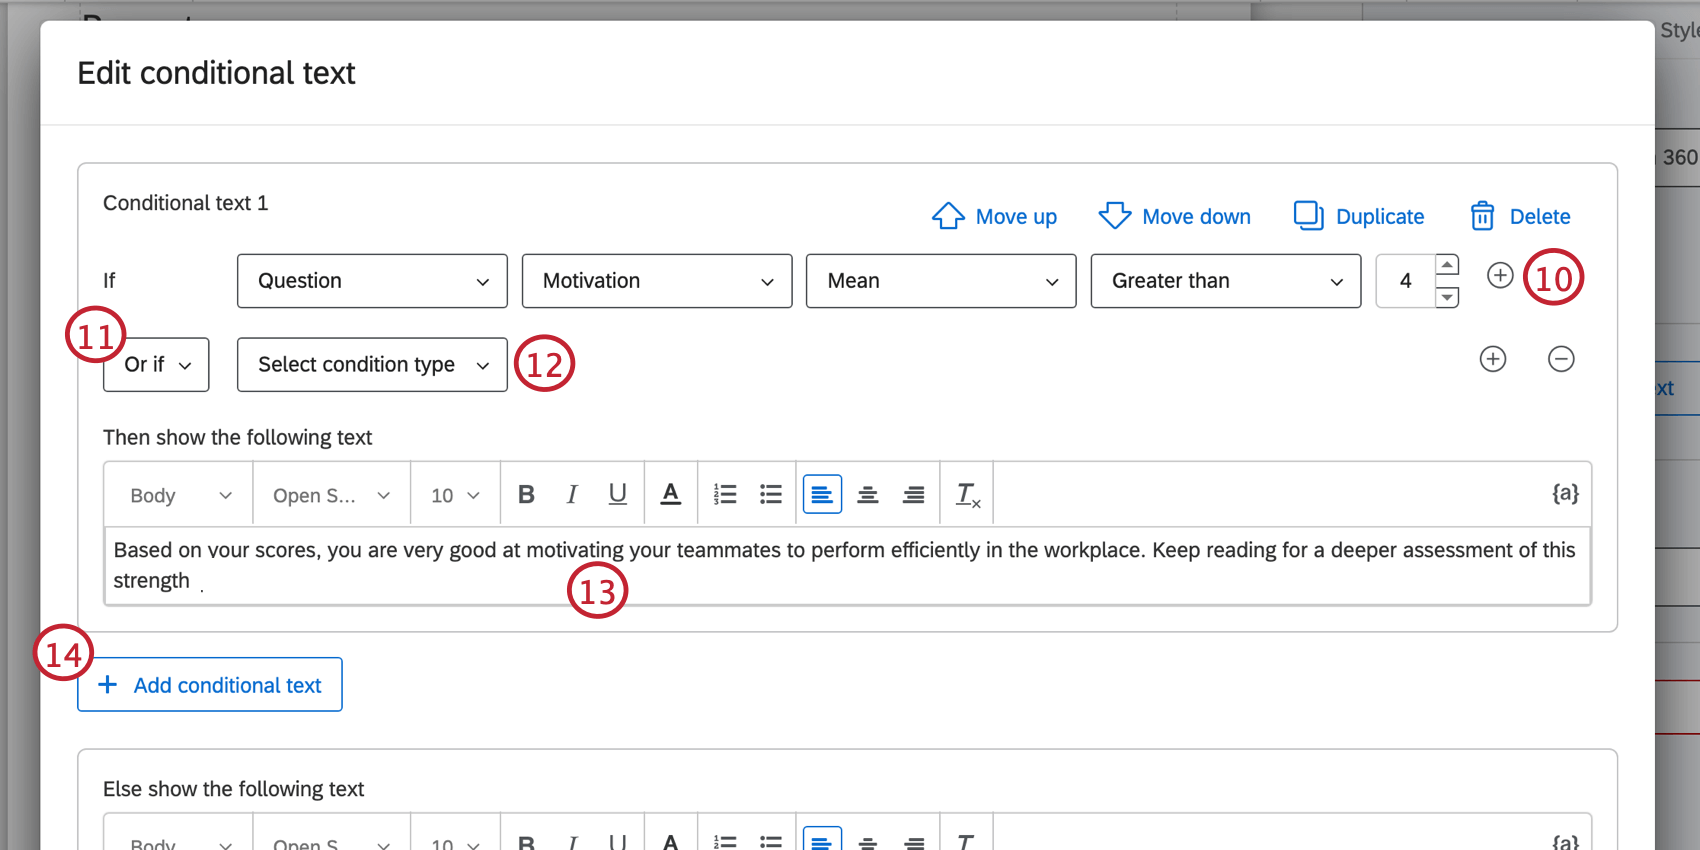
Qtip: Use the piped text icon to pull information from different sources and display that information accordingly. The 360 fields can be used to include subject data applicable to the report.

Attention: If a respondent meets multiple conditional text sets, they will only see the text associated with the first conditional text set in the list.
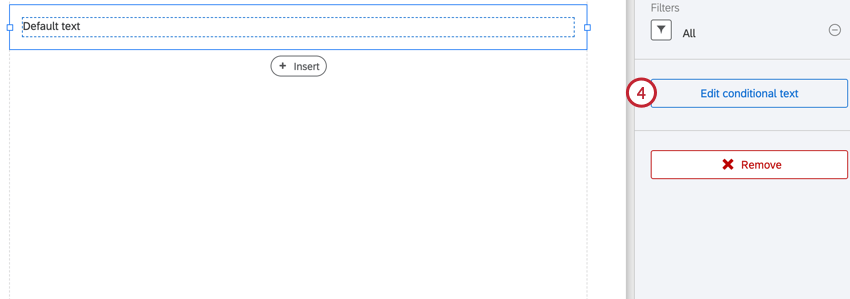
Managing Conditional Text
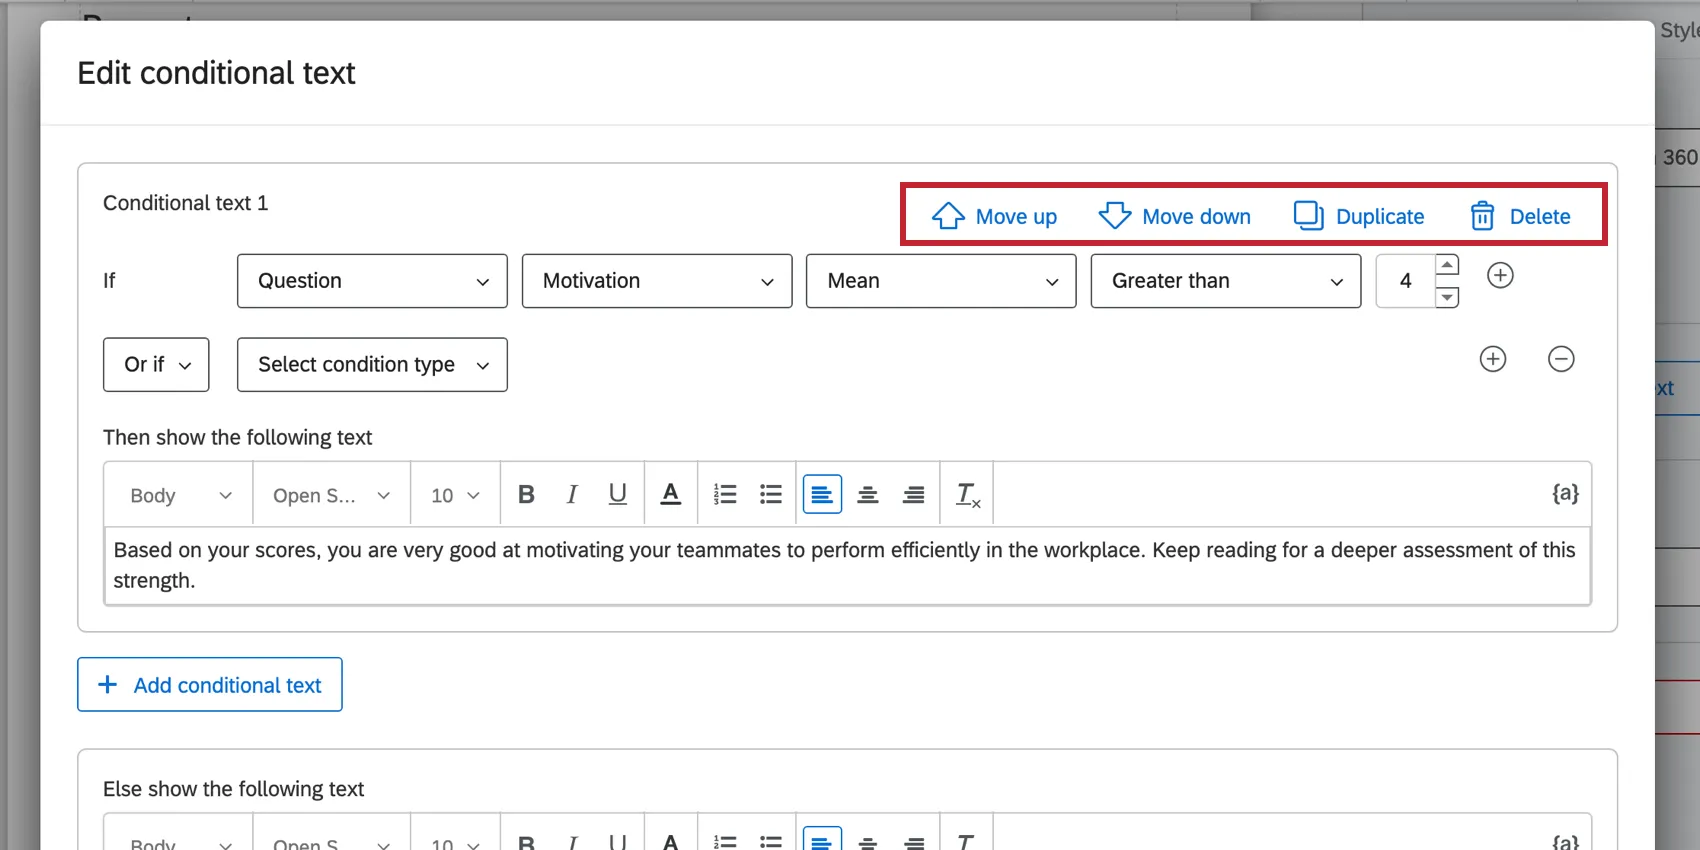
You can manage your conditional text using the options in the top-right corner of each conditional text set. Click Move up or Move down to rearrange the conditional text set in the list. Remember, if a respondent meets multiple conditions, they will only see the text for the first one in the list.
Click Duplicate to copy a conditional text set. This option is useful if you want to add conditional text sets that are very similar but with slight modifications.
If you need to delete a conditional text set, click Delete. Deleted conditional text sets are irretrievable.
Types of Conditional Text
Question or Scoring Category
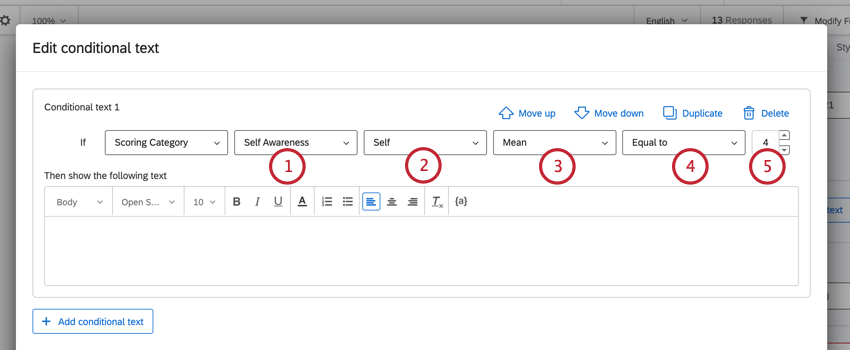
Display text based on the participant’s answer to a specific question or their score in a scoring category. If you choose one of these options, these are the steps to create a condition:
Example: Applying a filter is useful if you want to compare the same metric between 2 groups and then display text based on the difference. For example, you may want to compare the gap between a subject’s Self and Others data sources, and based on the gap, show different text in the report.
Example: In the above steps, the conditional text will display if the respondent’s mean score for “self awareness” is equal to 4.
Qtip: If you are basing conditional text on a question, it’s best to use questions that are recoded or have numeric data.
Person Metadata
Use metadata attached to the subject or the viewer to determine what is displayed. When basing on viewer metadata, that means you can vary what’s displayed based on whether the subjects themselves or their managers are viewing the report.
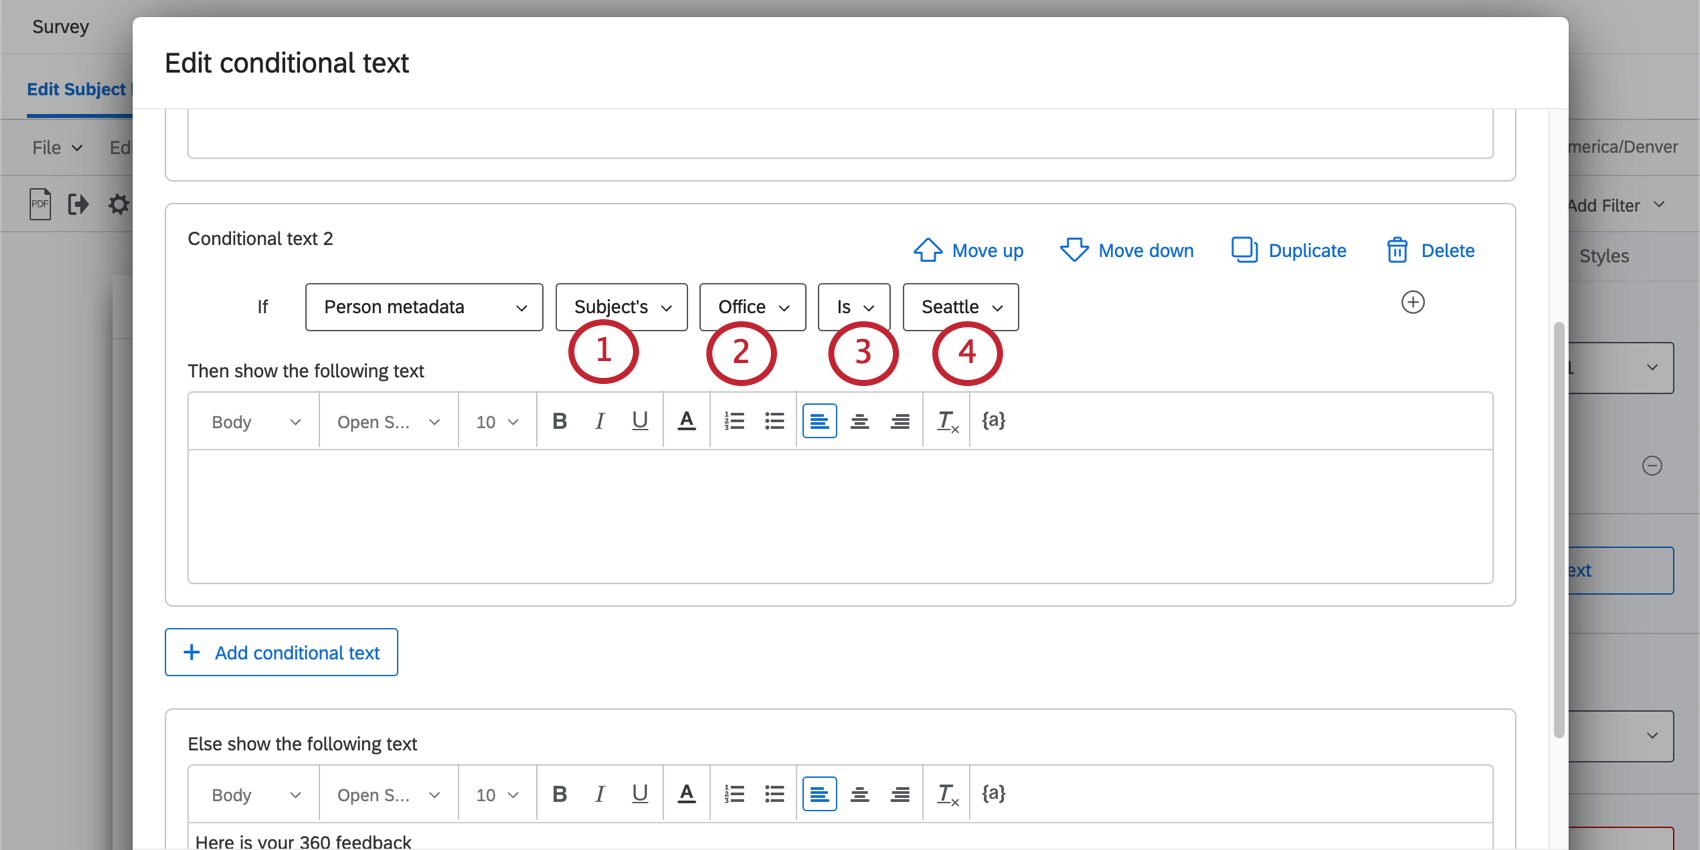
- Is same as subject’s: The value of the viewer’s metadata should match the subject of the report. For example, only show the text if the viewer and the subject are based in the same location, or if they are in the same department.
- Is: Match a specific value. You will be able to then choose from all existing values.
- Is not: Match any value except the one selected.
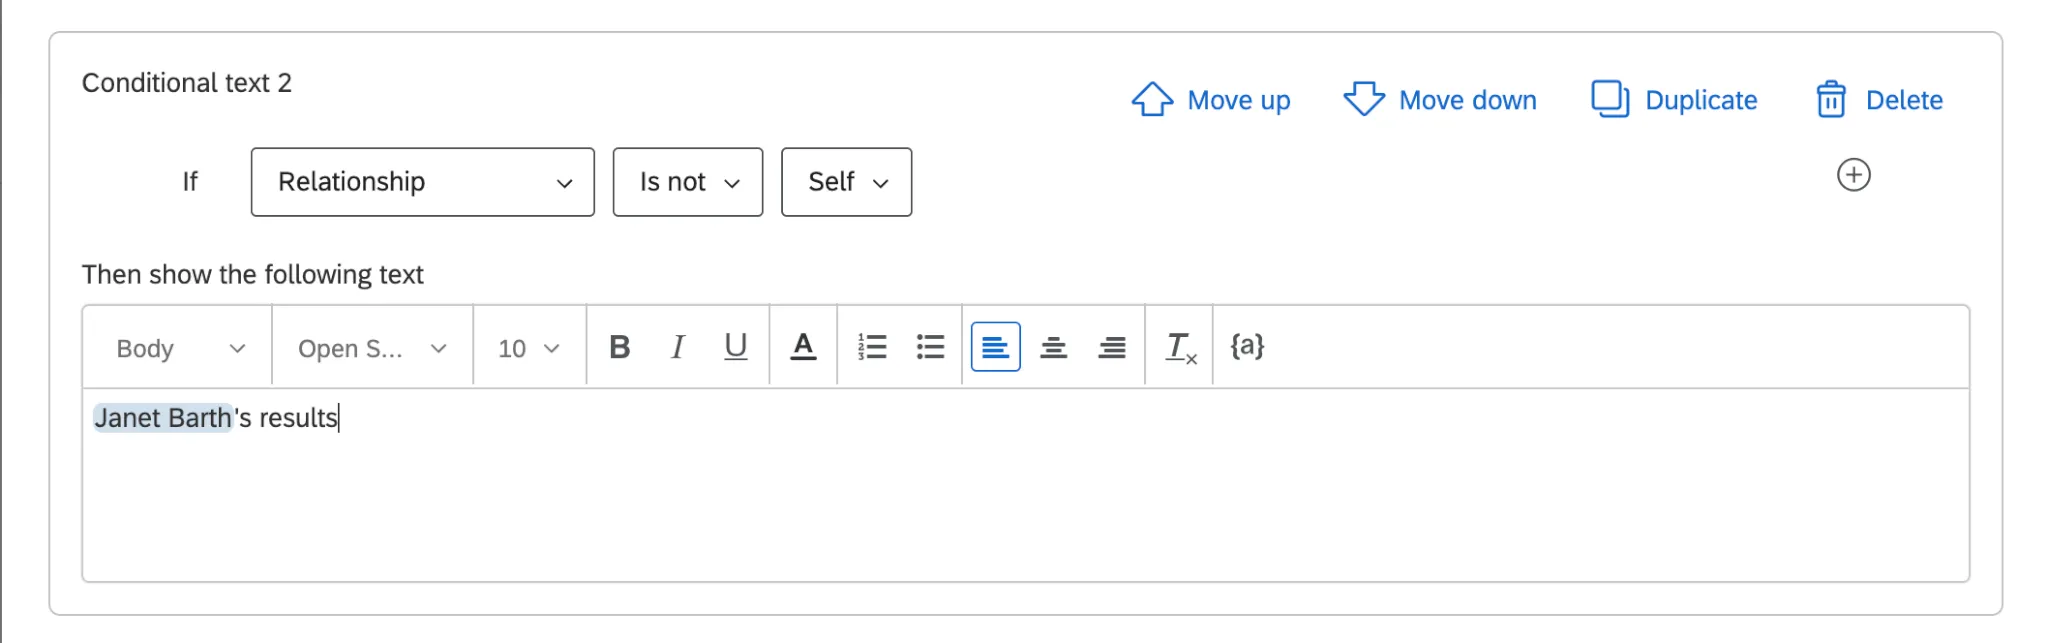
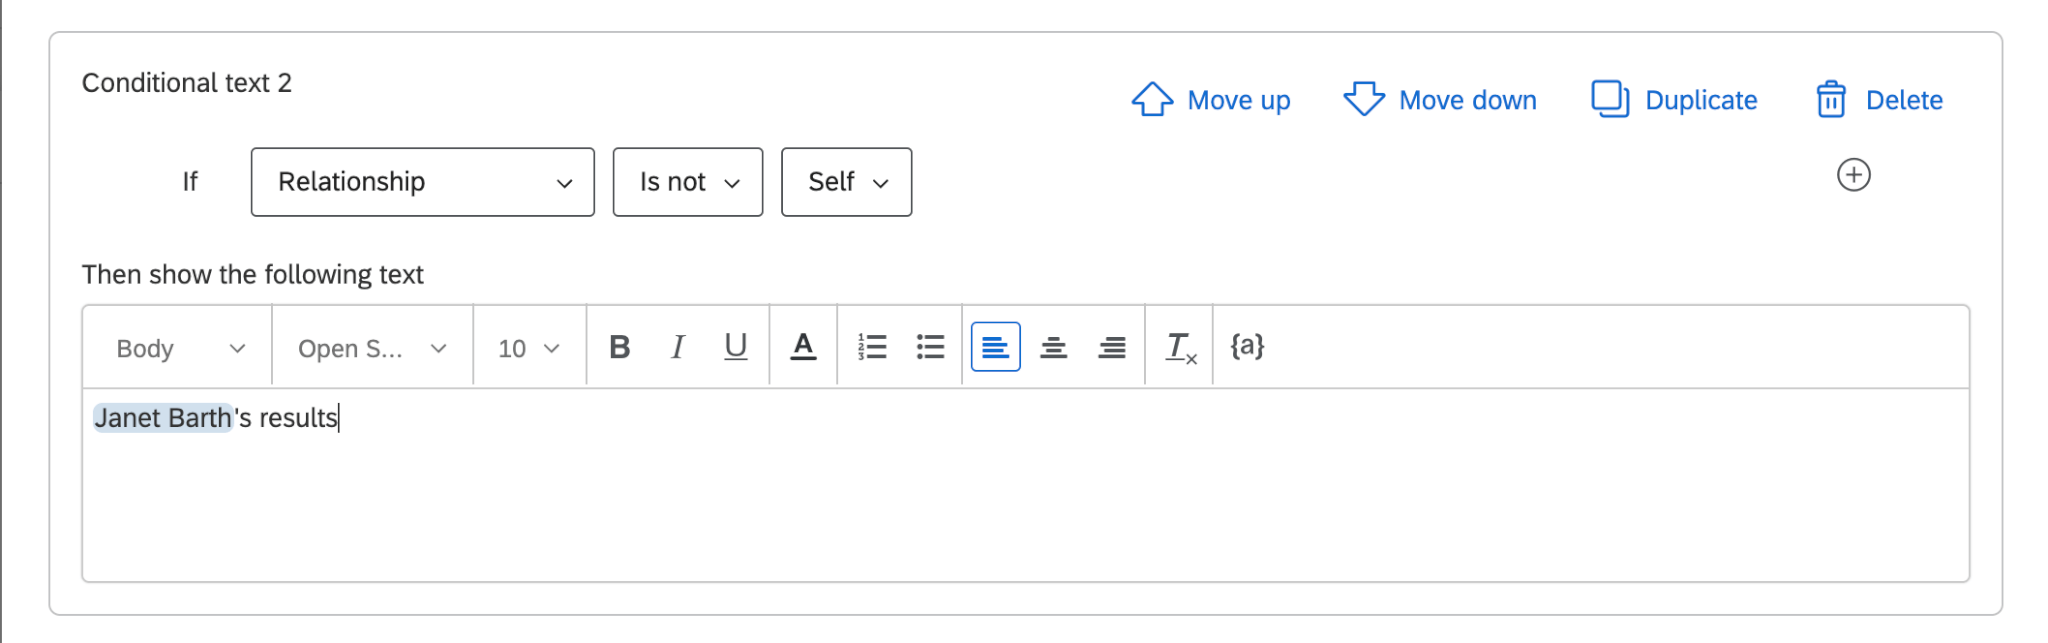
Relationship
Decide what to display based on the viewer’s relationship to the subject. You can use “is” or “is not” conditions.
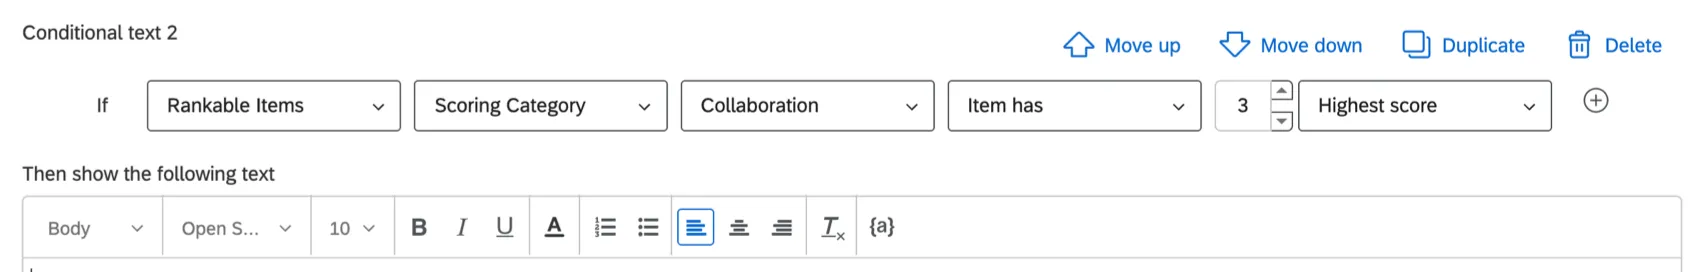
Rankable Items
Display text to show how items are scored for a particular subject.
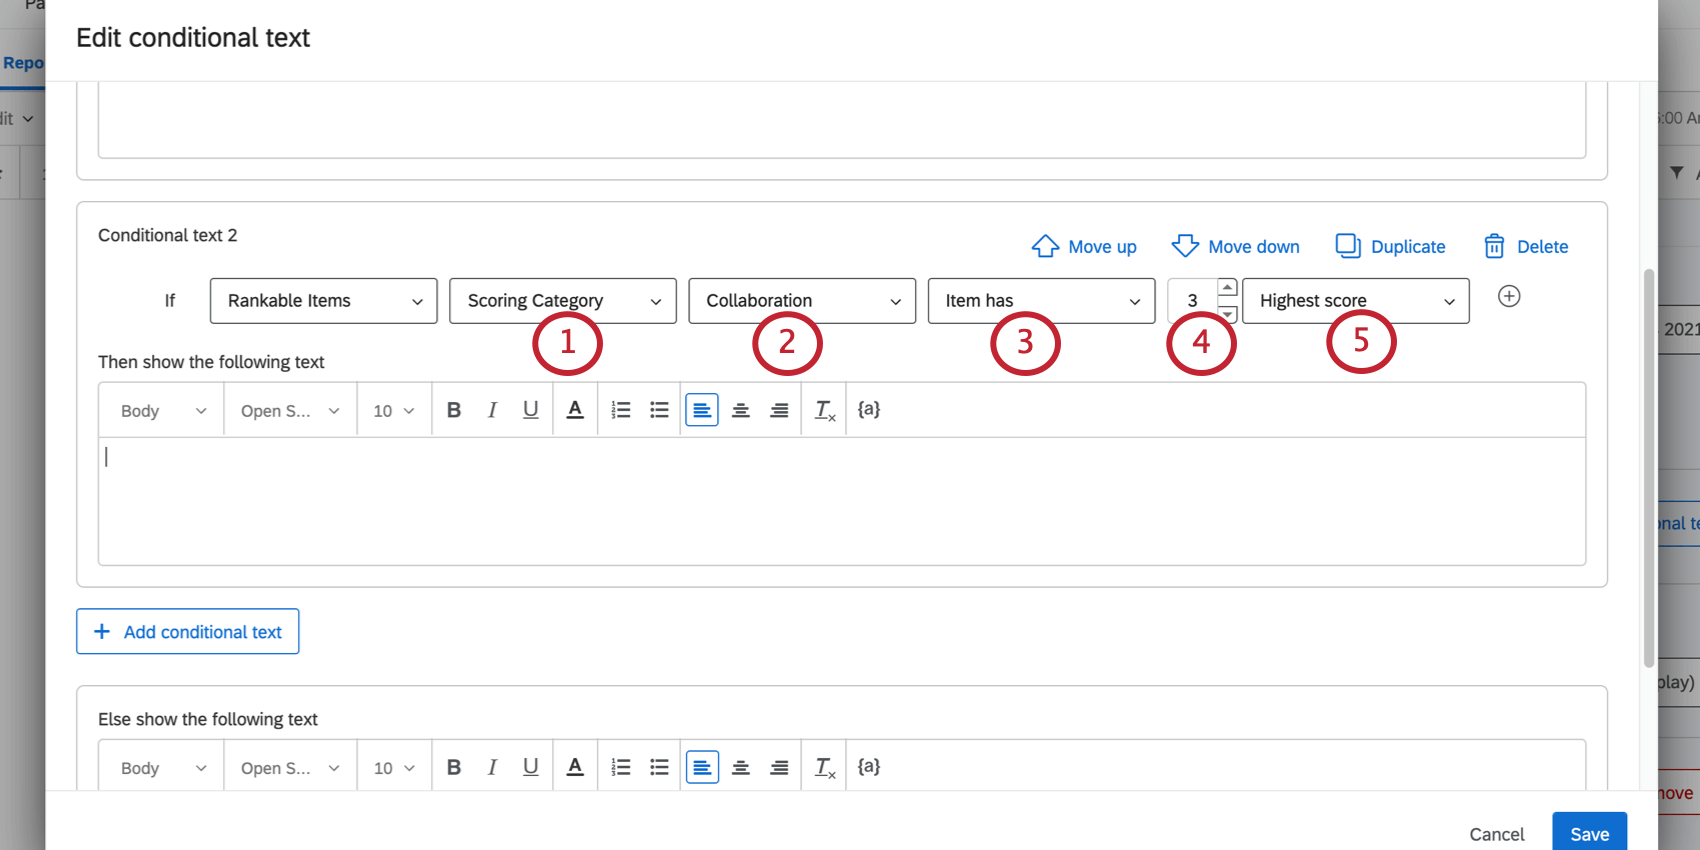
- Item has: The item is a specific rank. Example: If you say the viewer’s collaboration score “item has 3 highest score,” the item must be the third highest scored from the top of the ranks in the collaboration filter group before the viewer will see the text.
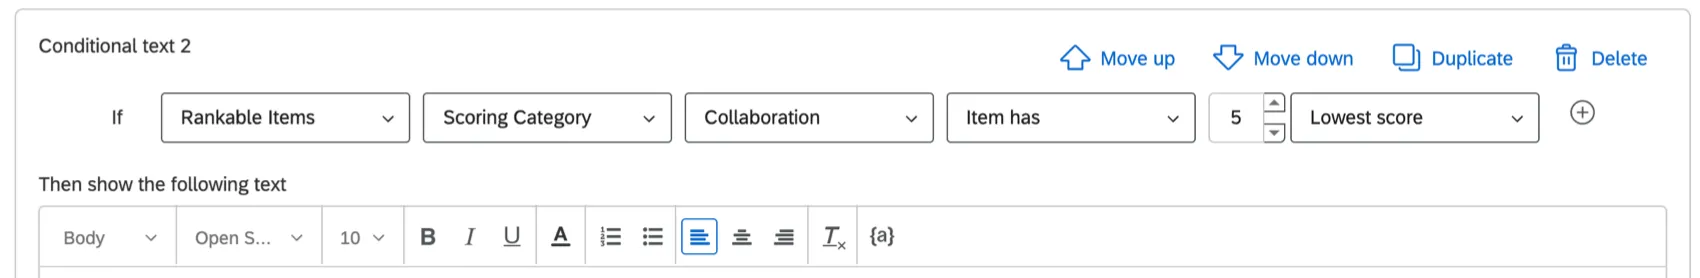
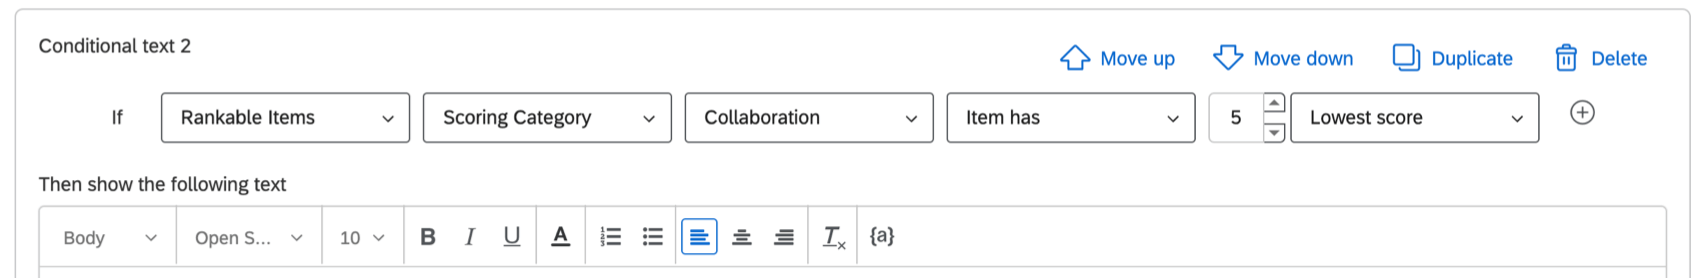
 Example: If you say the viewer’s collaboration score “item has 5 lowest score,” the item must be the fifth lowest scorer from the bottom of the collaboration ranks before the viewer will see the text.
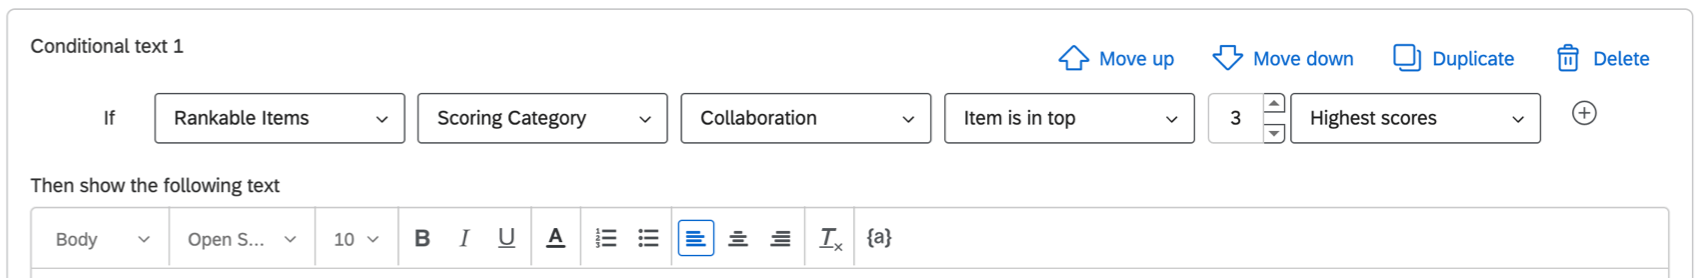
- Item is in top: The item must be within the chosen number of ranks. Example: Text displayed only for the top 3 highest scored items will display the items with the first, second, and third highest scores to the viewer.
 Qtip: This feature does not compare your values to other subject’s values, it compares your values to other values of yours.

Inserting Images
You can add images throughout your report.
Qtip: Want a logo to appear on the top of every page of the report without having to manually insert each one? Check out the Header and Footer section below.
Adding Images

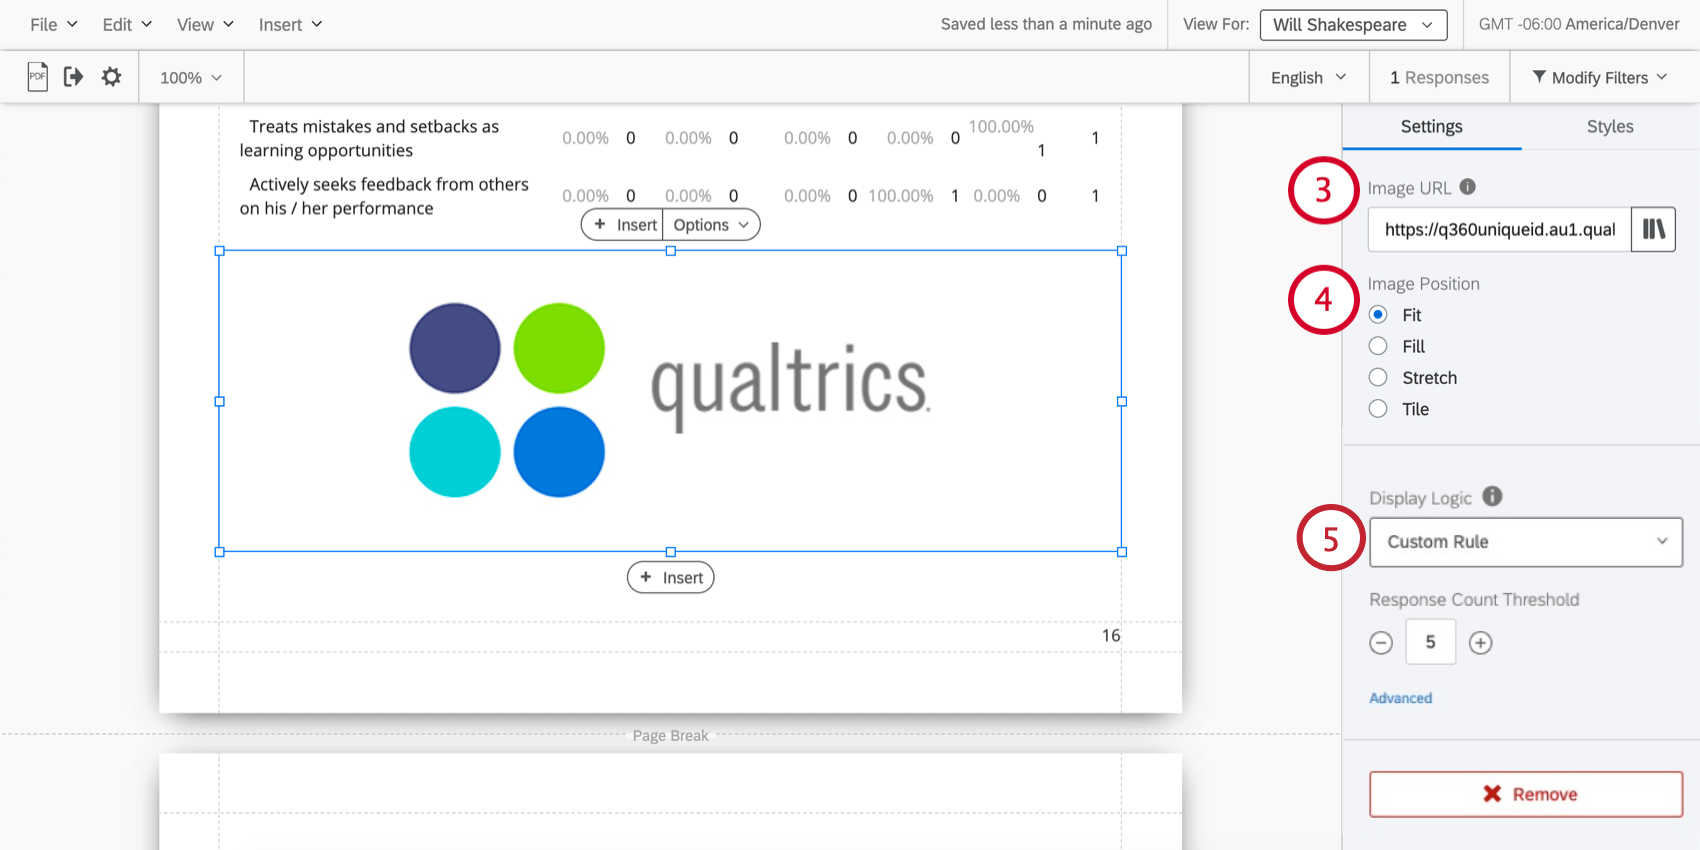
Qtip: To insert an image from your library, click the Library icon to the right of the Image URL text box and select the graphic you want to insert.

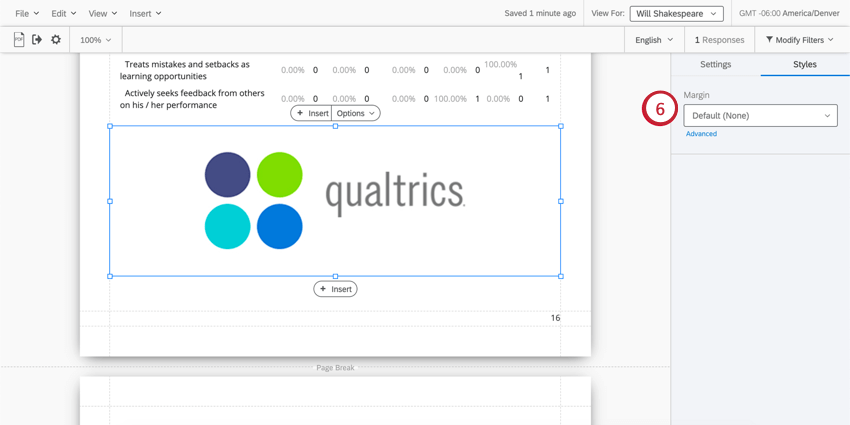
See the examples below for more information on image position.
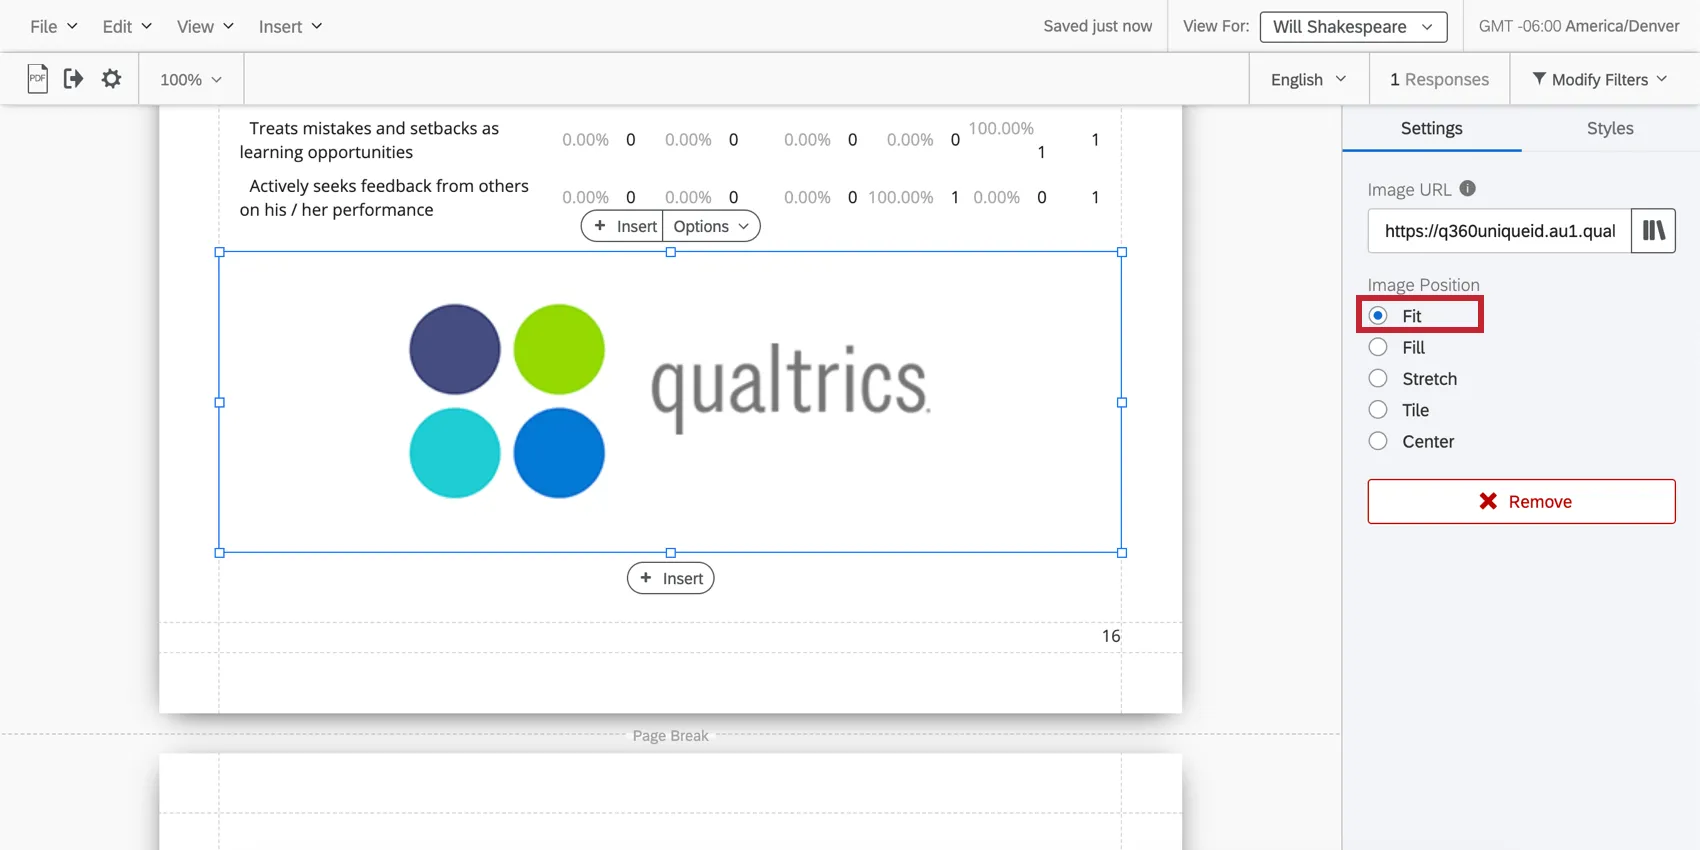
Fit
The image reverts to its natural dimensions within the margins. If you need to resize an image without stretching it, this is the best option.
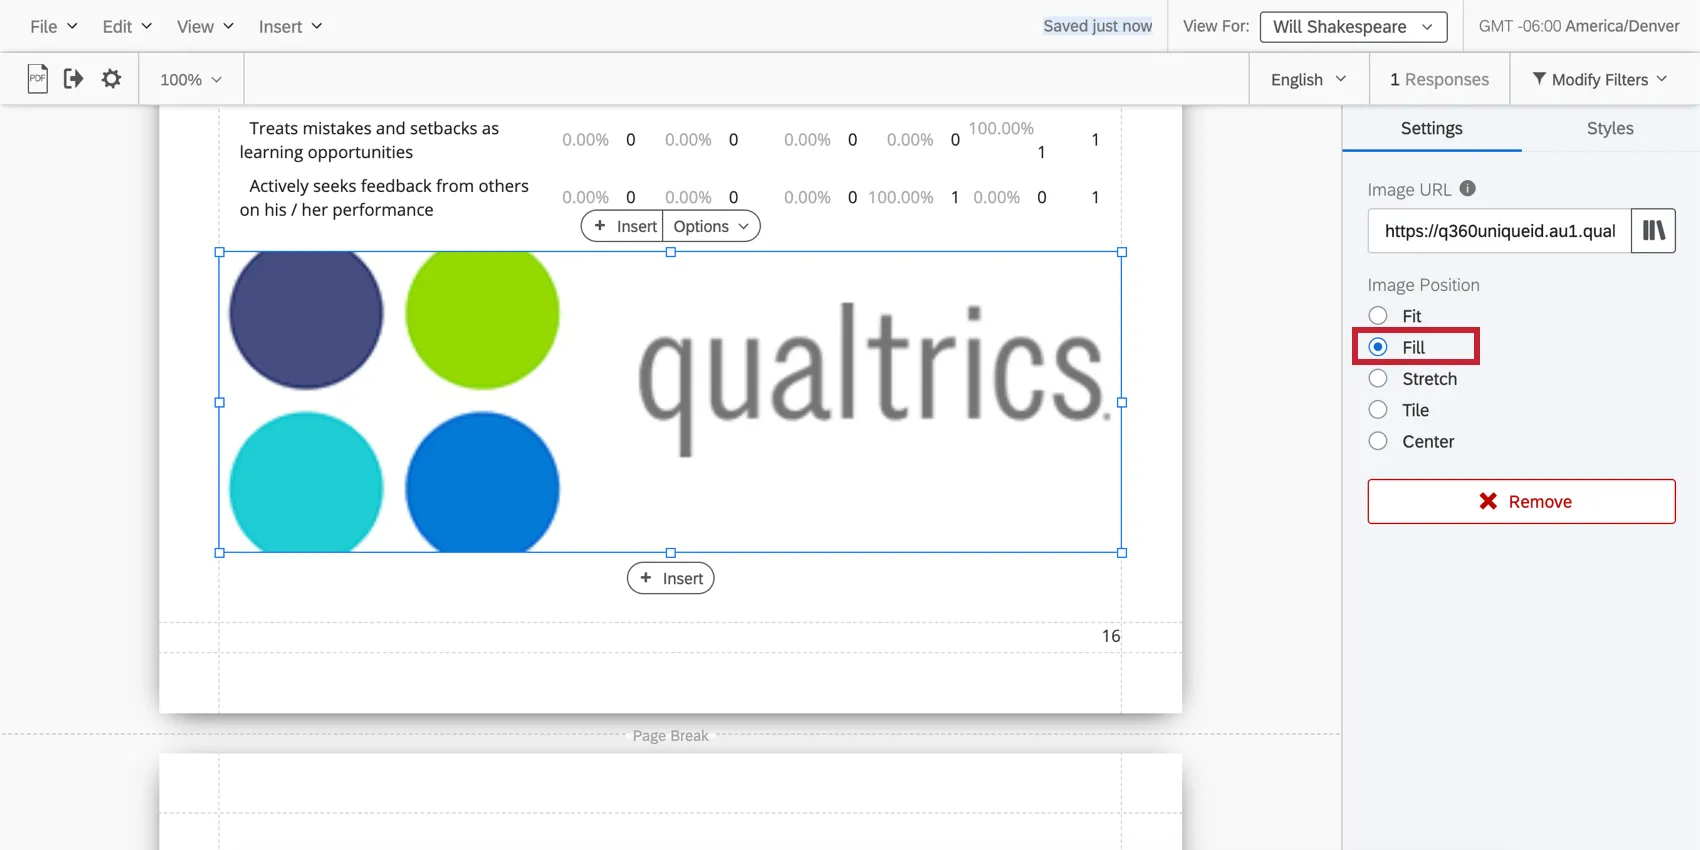
Fill
Have the image fill the margin without stretching.
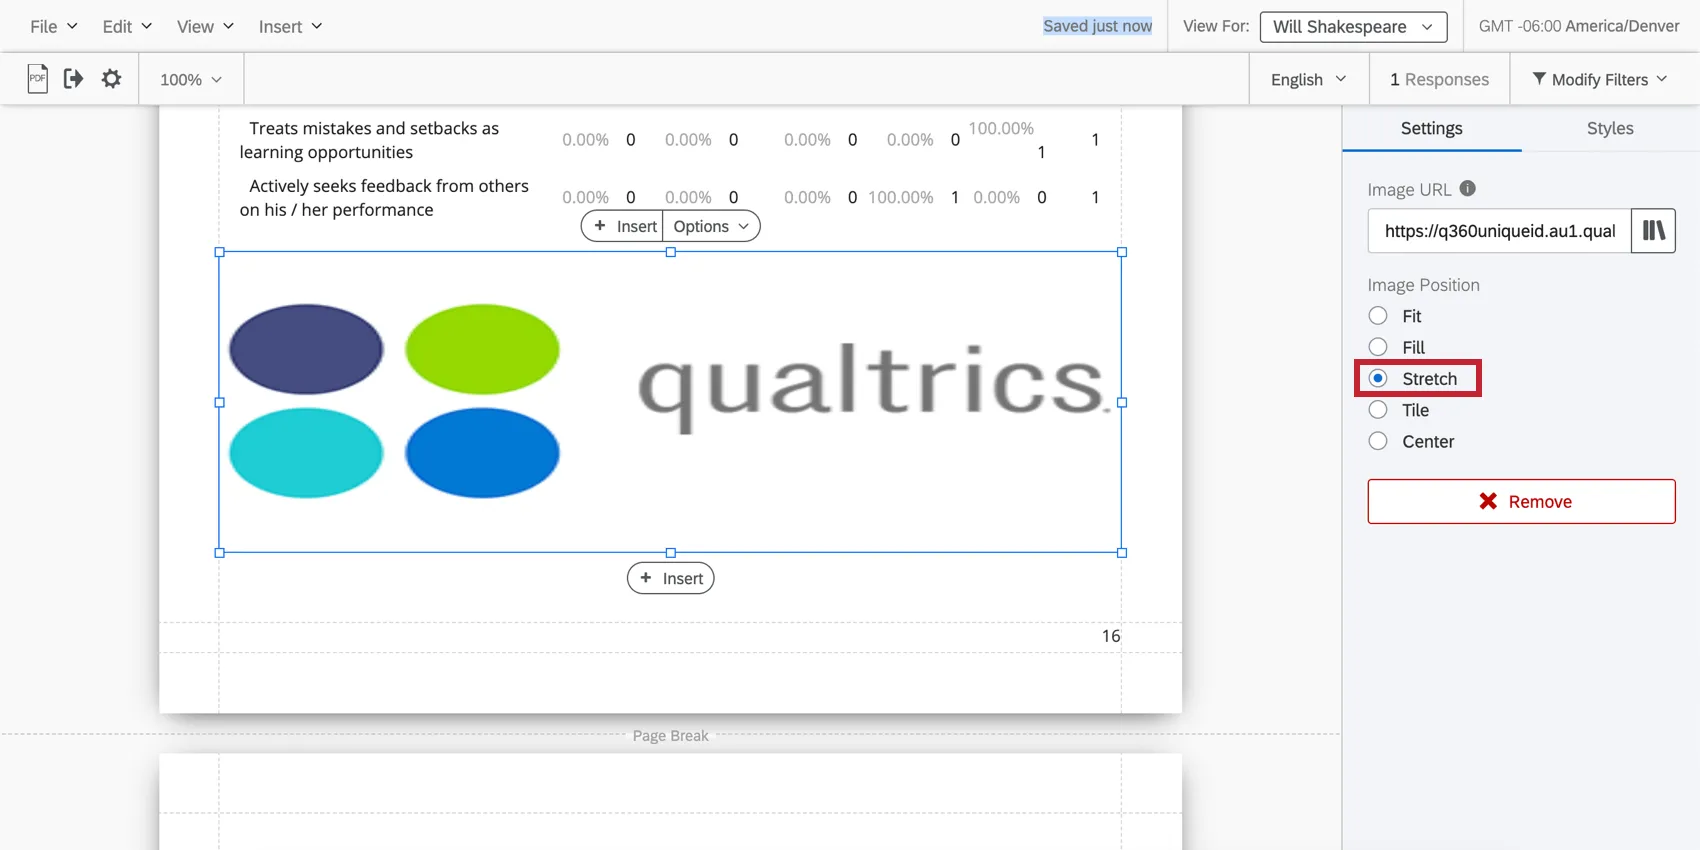
Stretch
Stretch the image to fit the margins.
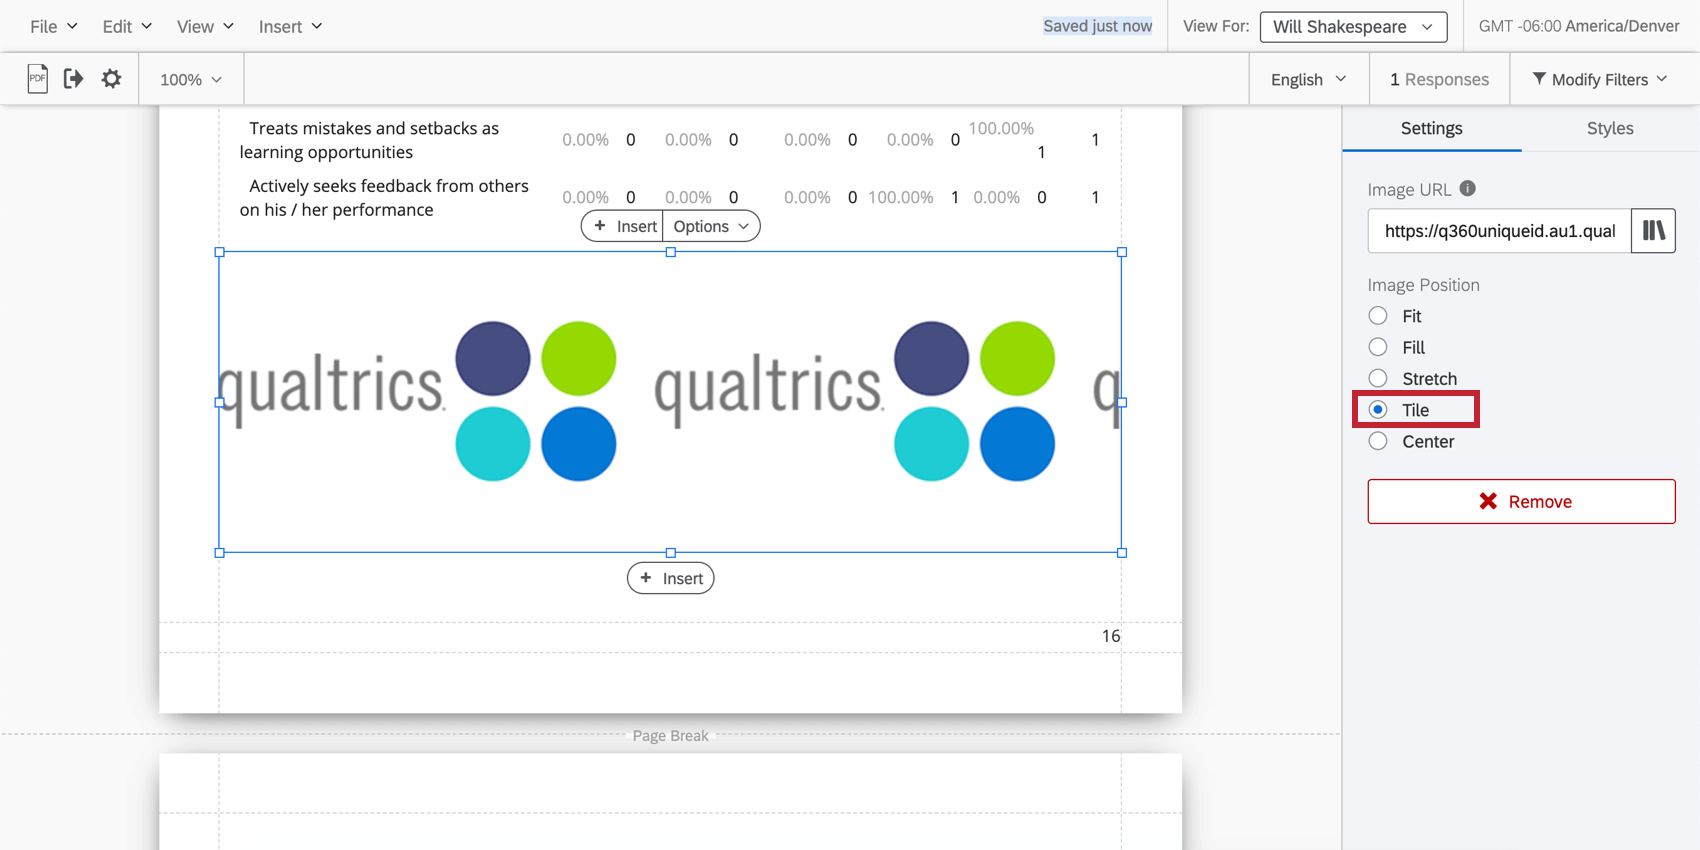
Tile
Repeat the image within the margins. This option looks especially nice for minimalist images or patterns.
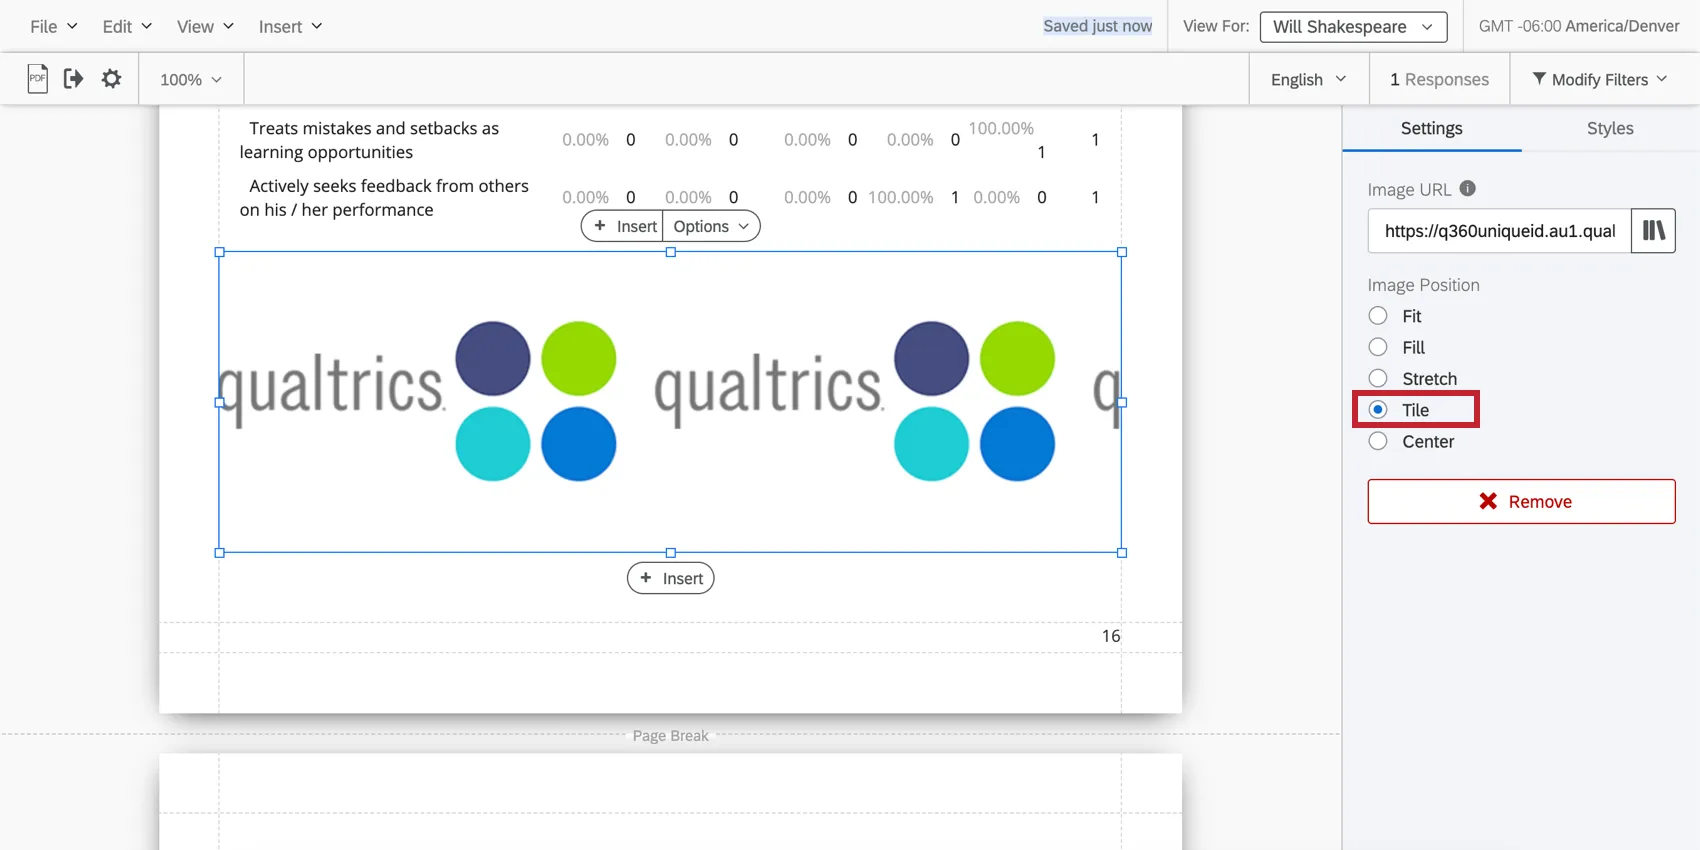
Qtip: If the image is larger than the space you’re trying to fit it into, it won’t have a chance to repeat.
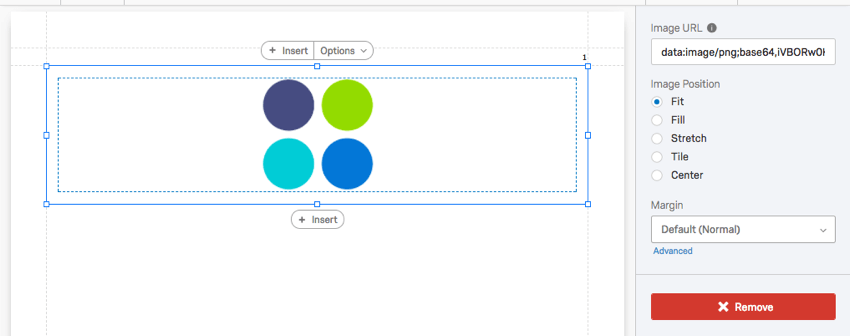
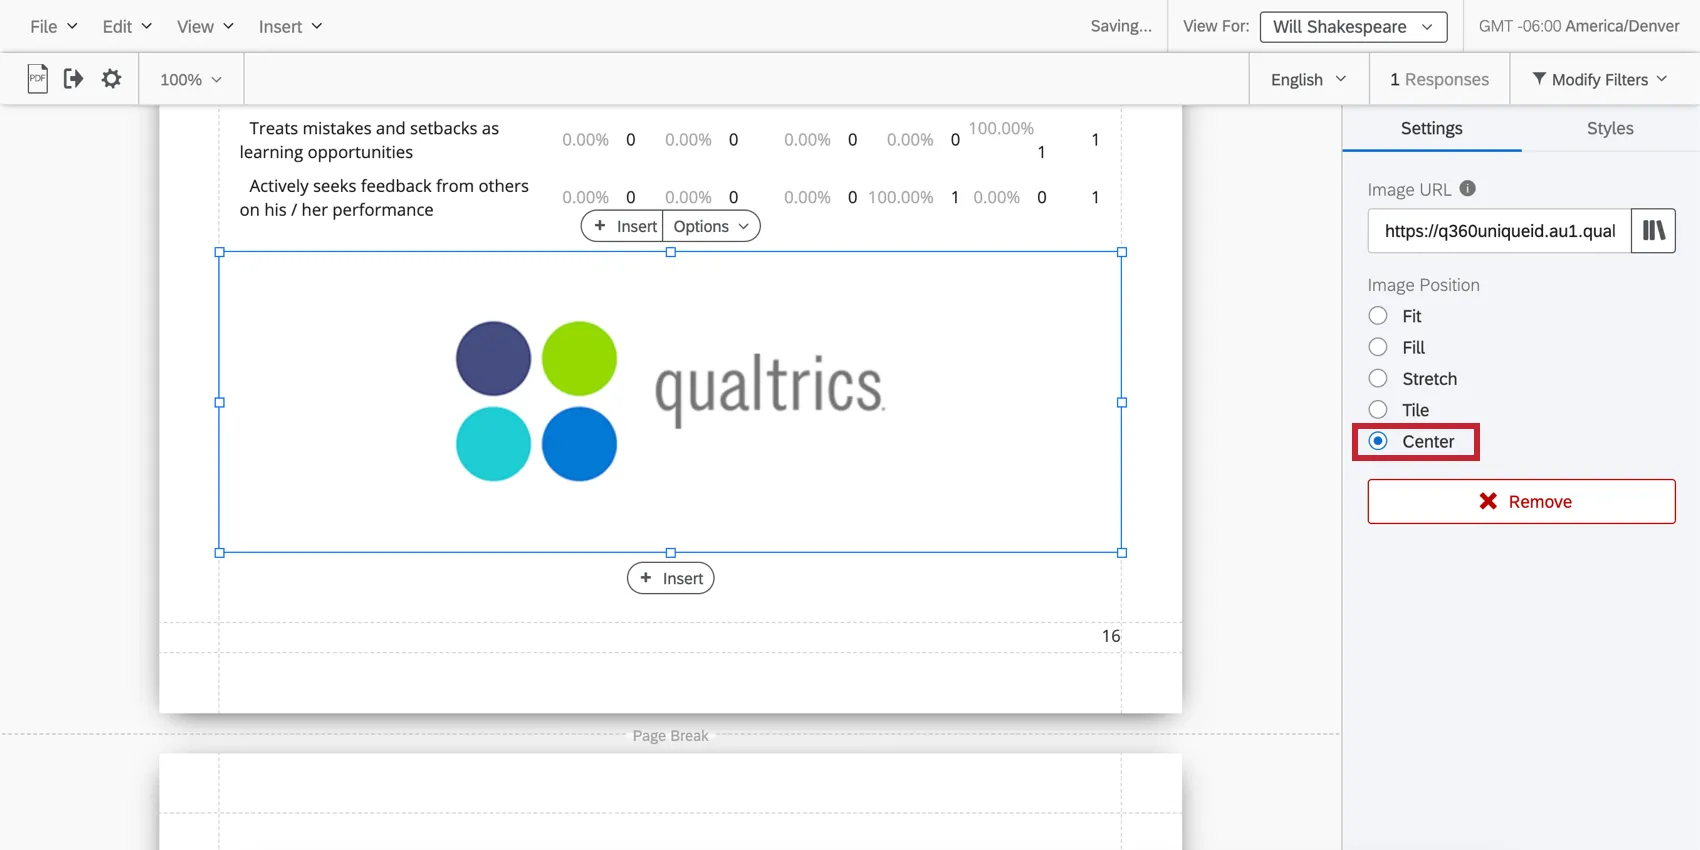
Center
Center the image within the margins without stretching it or fitting it.
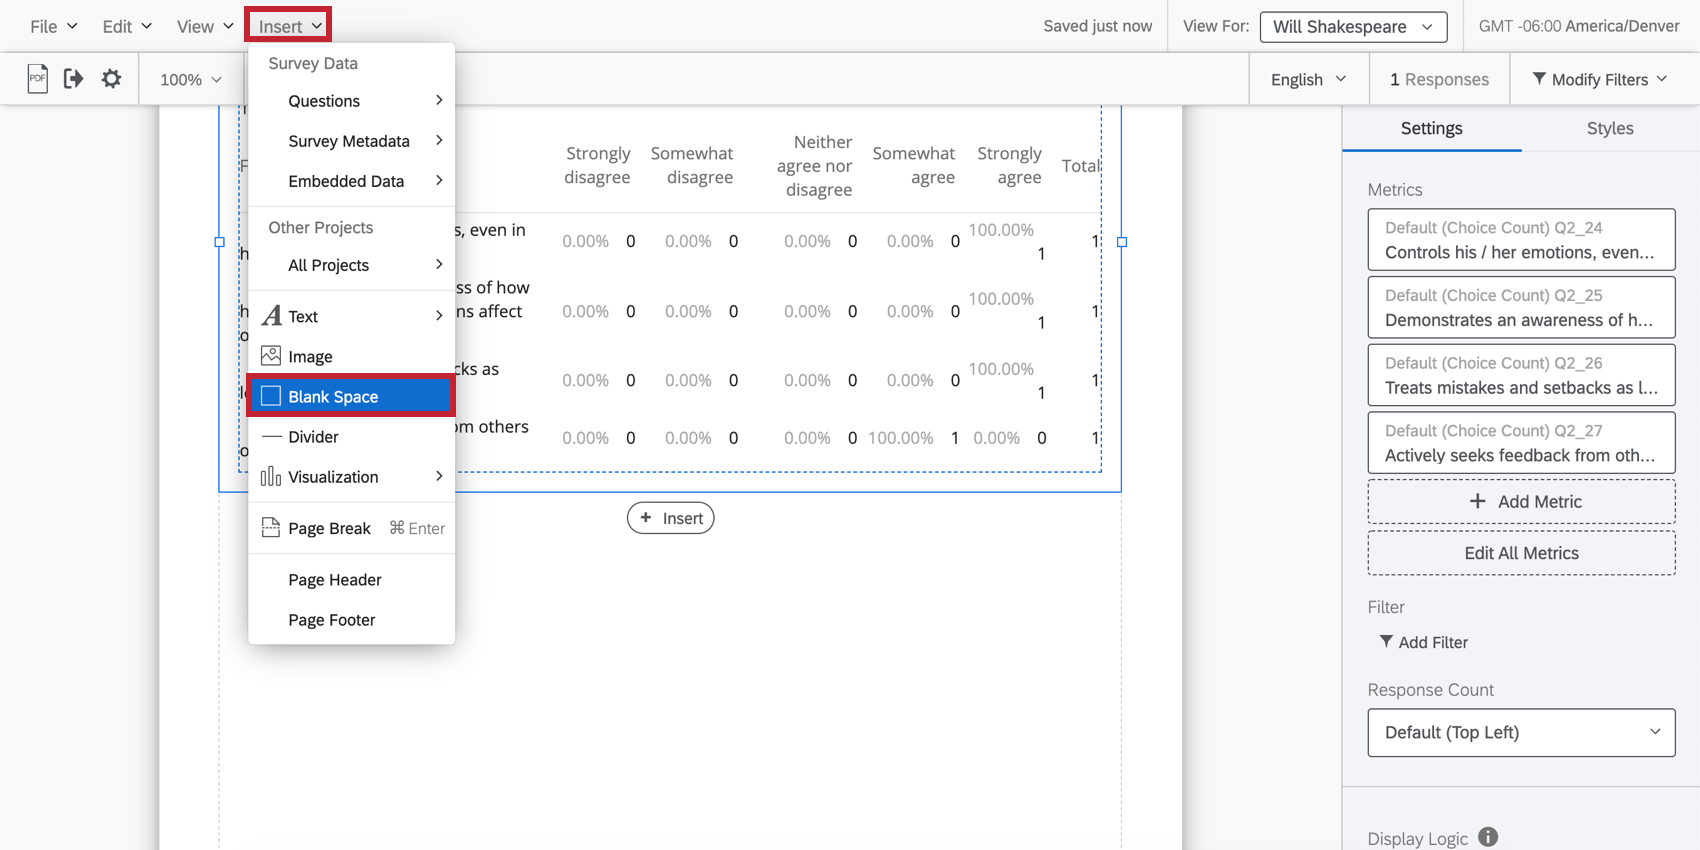
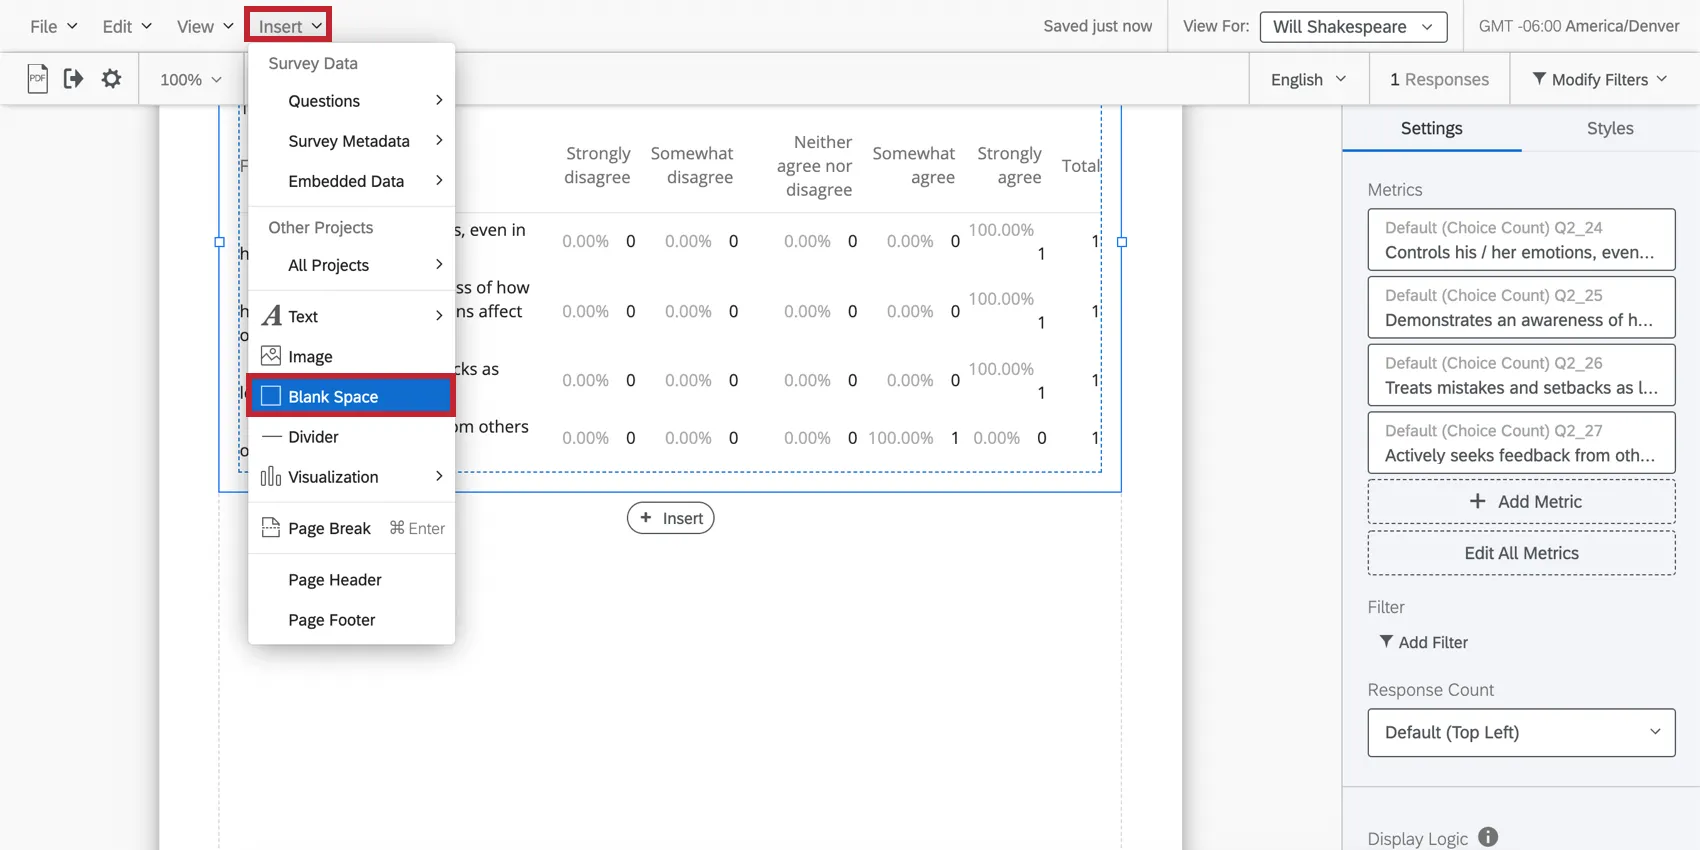
Inserting Blank Spaces
Click Insert and choose Blank Space to insert a blank space at the bottom of the page you’re working on.
Blank spaces do exactly what it sounds like: they allow you to create blank spaces between your visualizations. They can be resized and dragged around the page as necessary.
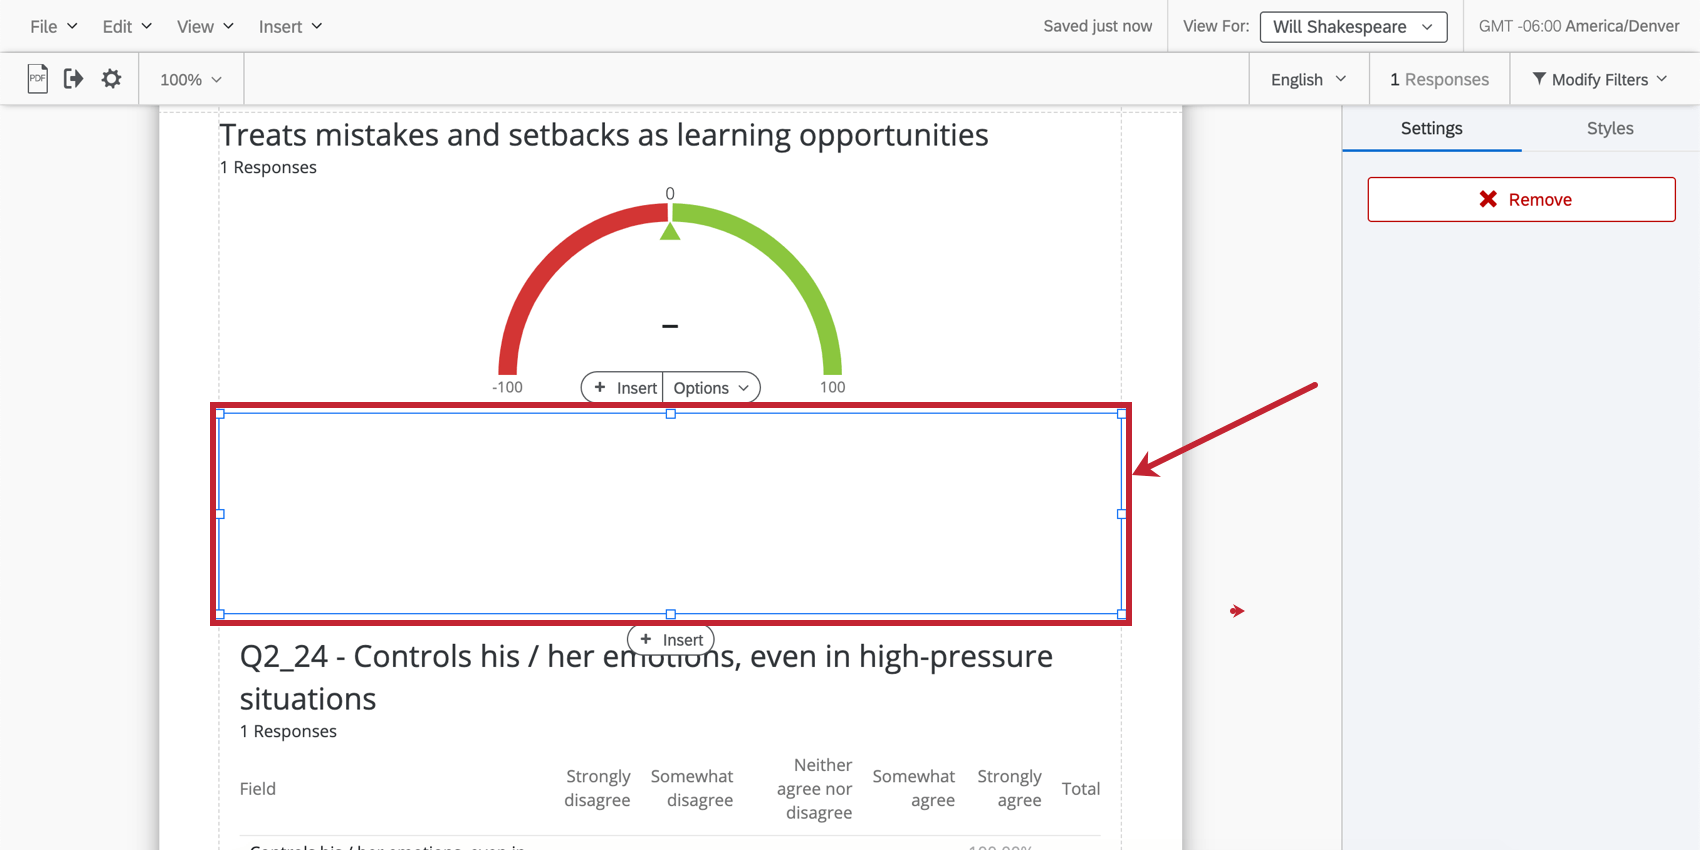
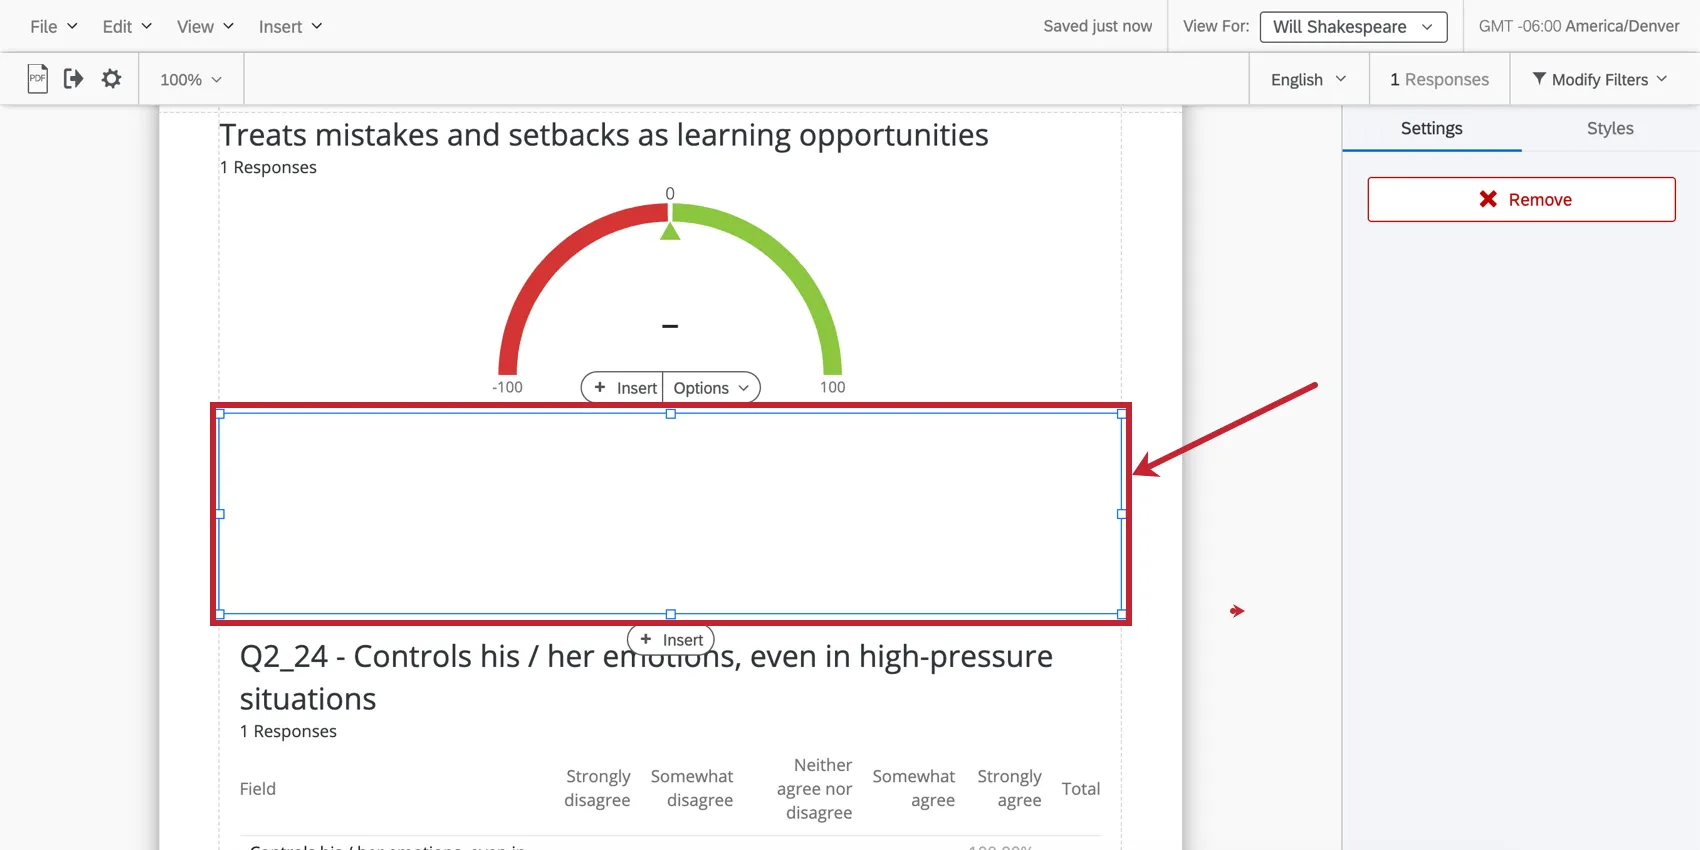
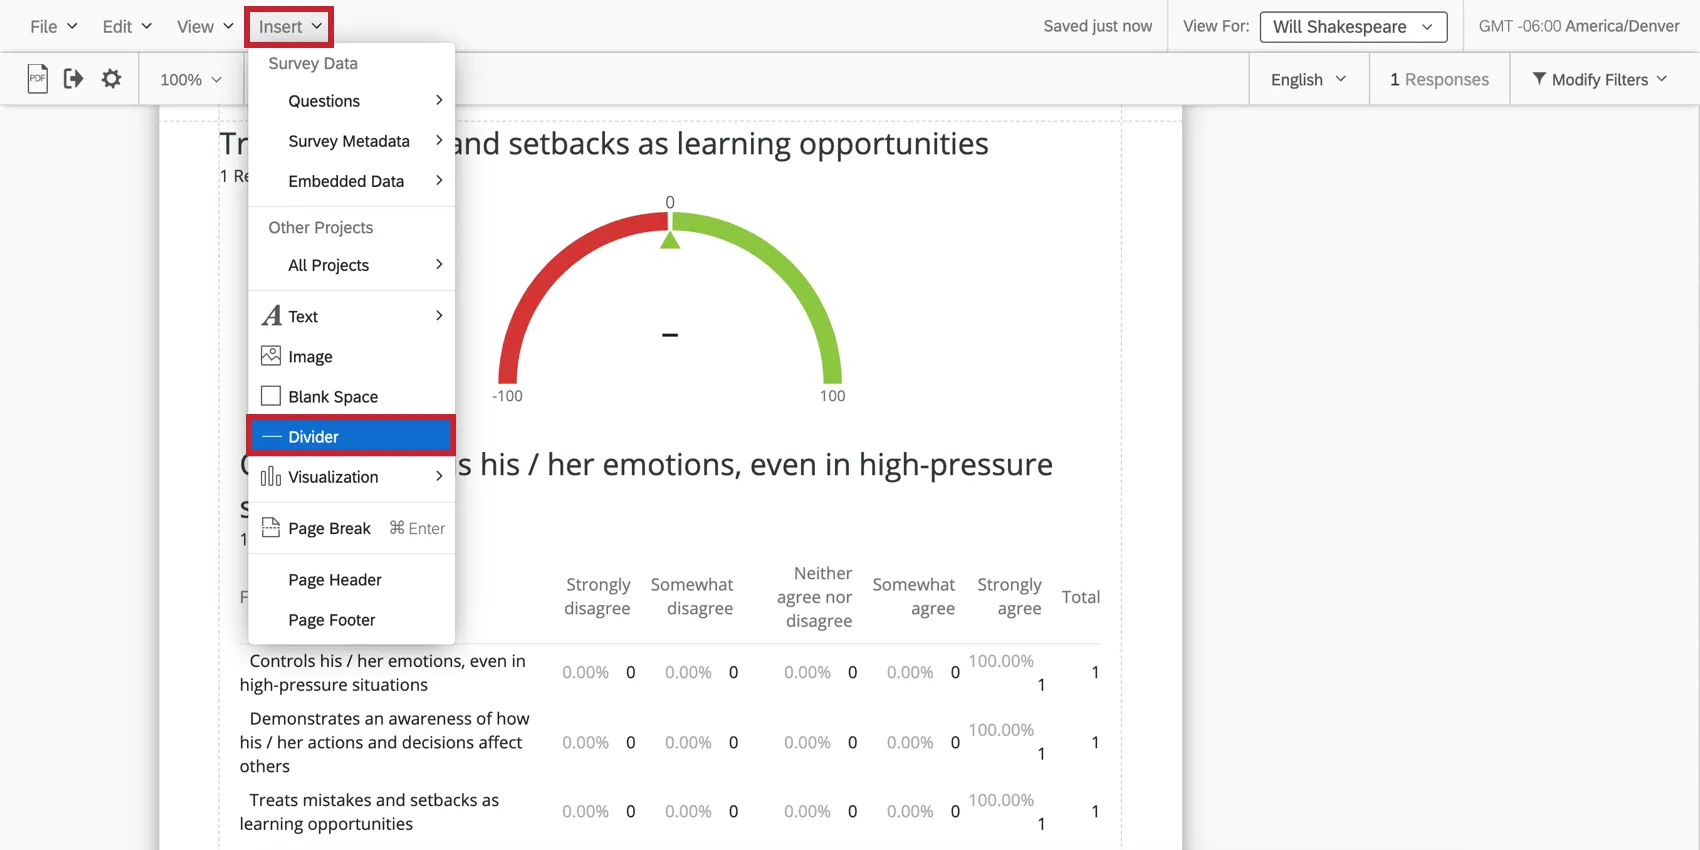
Dividers
Click Insert and choose Divider to insert a dividing line at the bottom of the page you’re working on.
There are several options for customizing dividers.
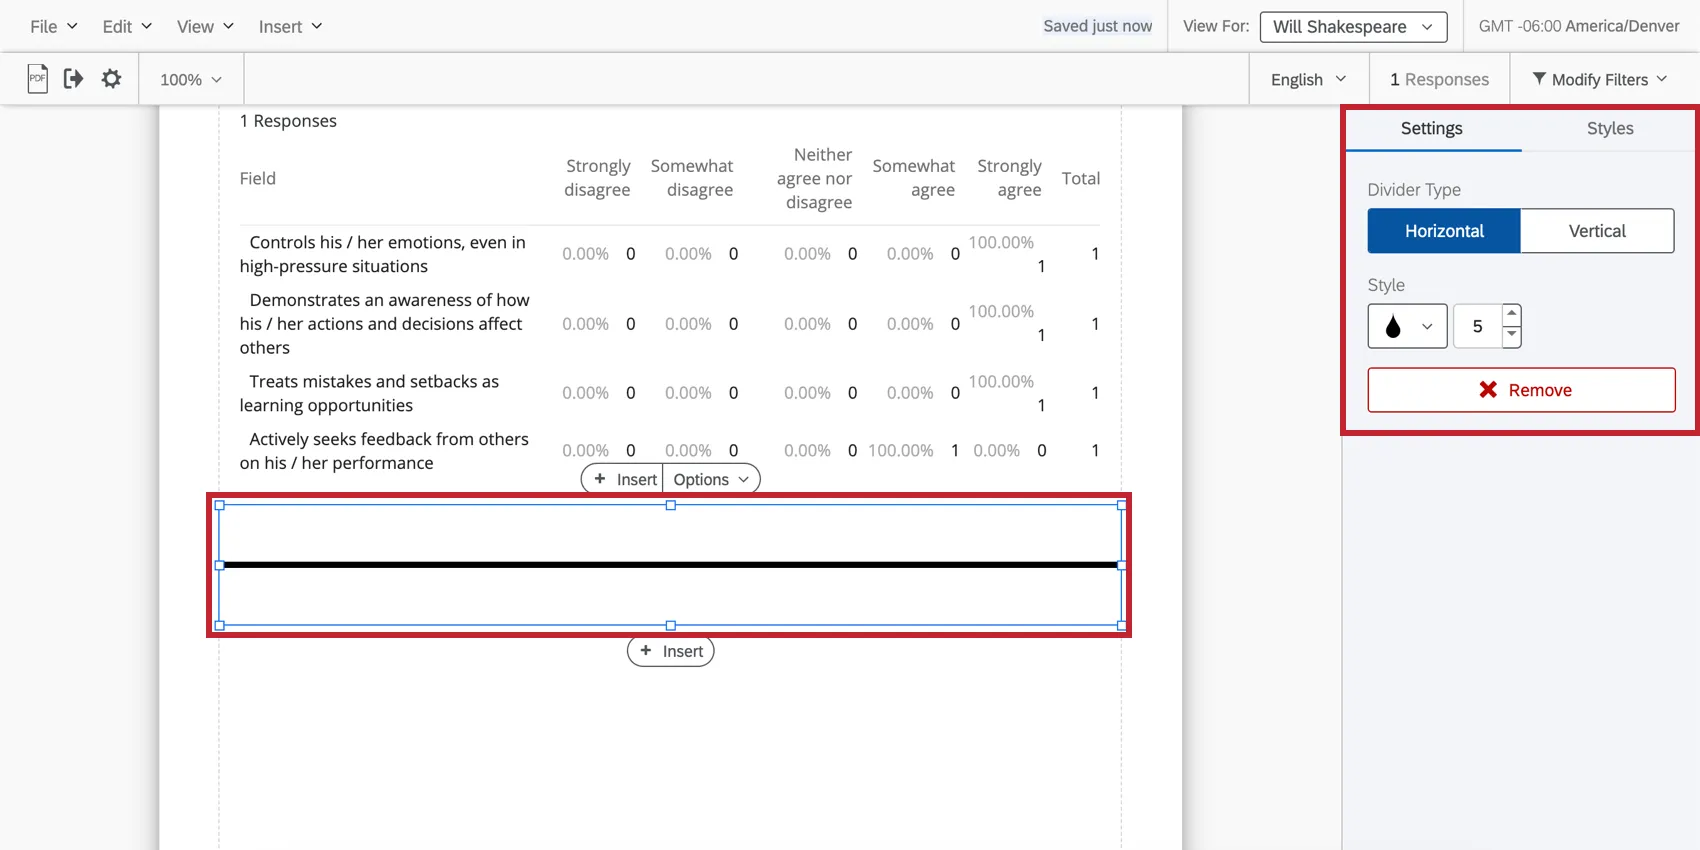
- Divider Type: Decide whether your dividing line is horizontal across the page or vertical.
- Style: The tear drop icon allows you to adjust the color of the divider. The Number selector lets you choose the thickness, in pixels, of the line.
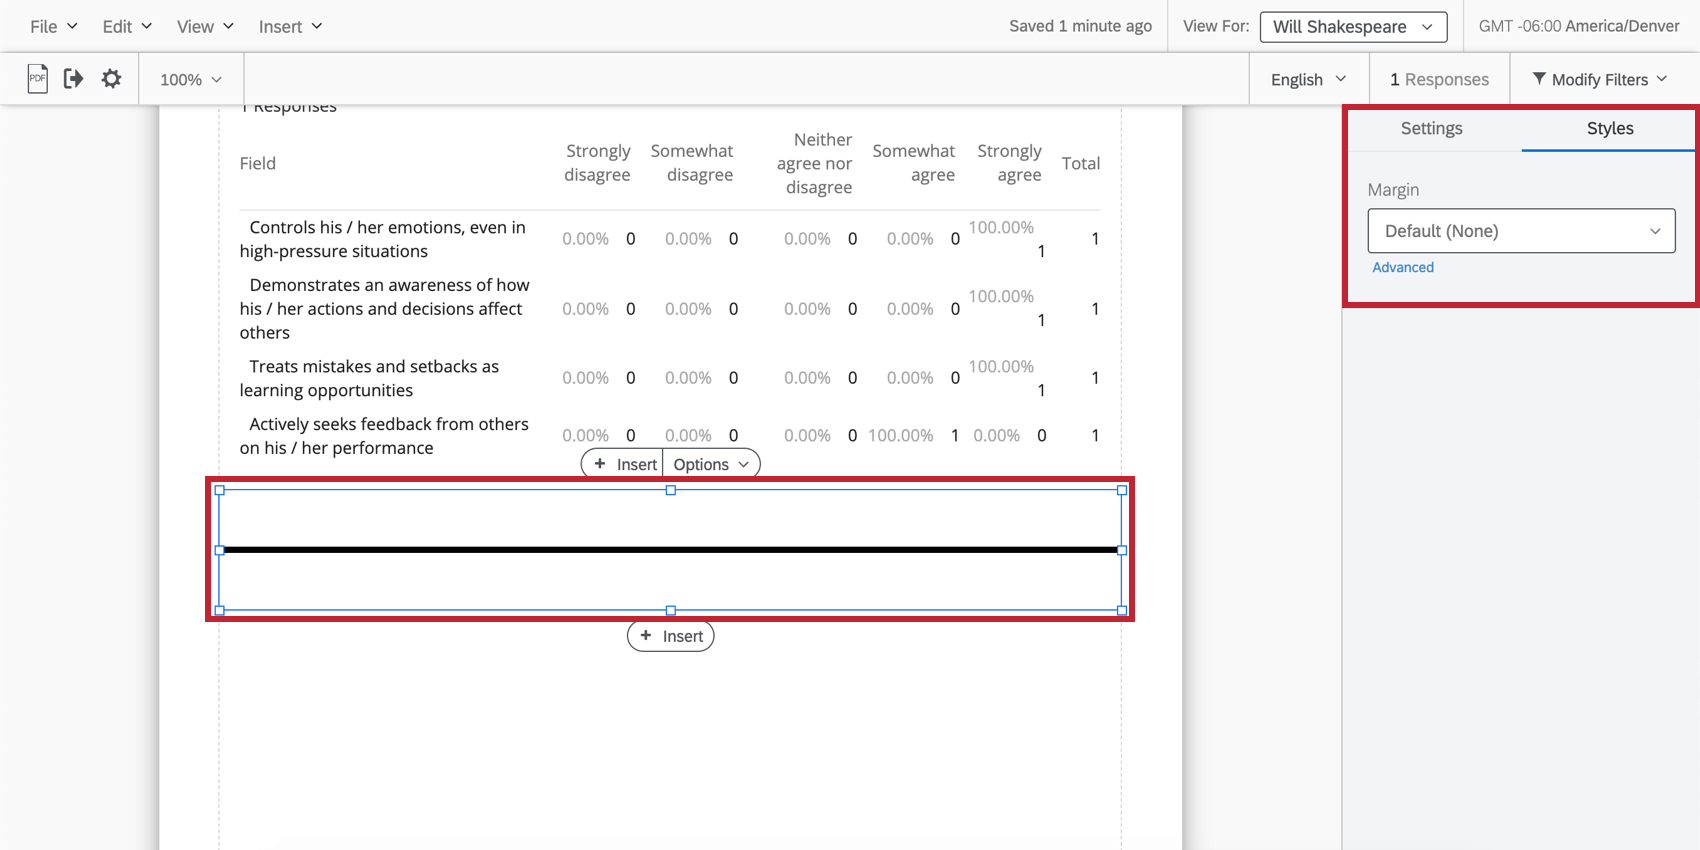
- Margin: Adjust the margin around the divider.
Page Breaks & Deleting Pages
Pages are created automatically when you add visualizations and insert other content. Once a page runs out of room, a new one is automatically created. However, you can also manually insert pages.
Attention: For the best performance, we recommend trying to keep your report below 30 pages.
Click Insert and choose Page Break to insert a page break at the bottom of the page you’re working on.
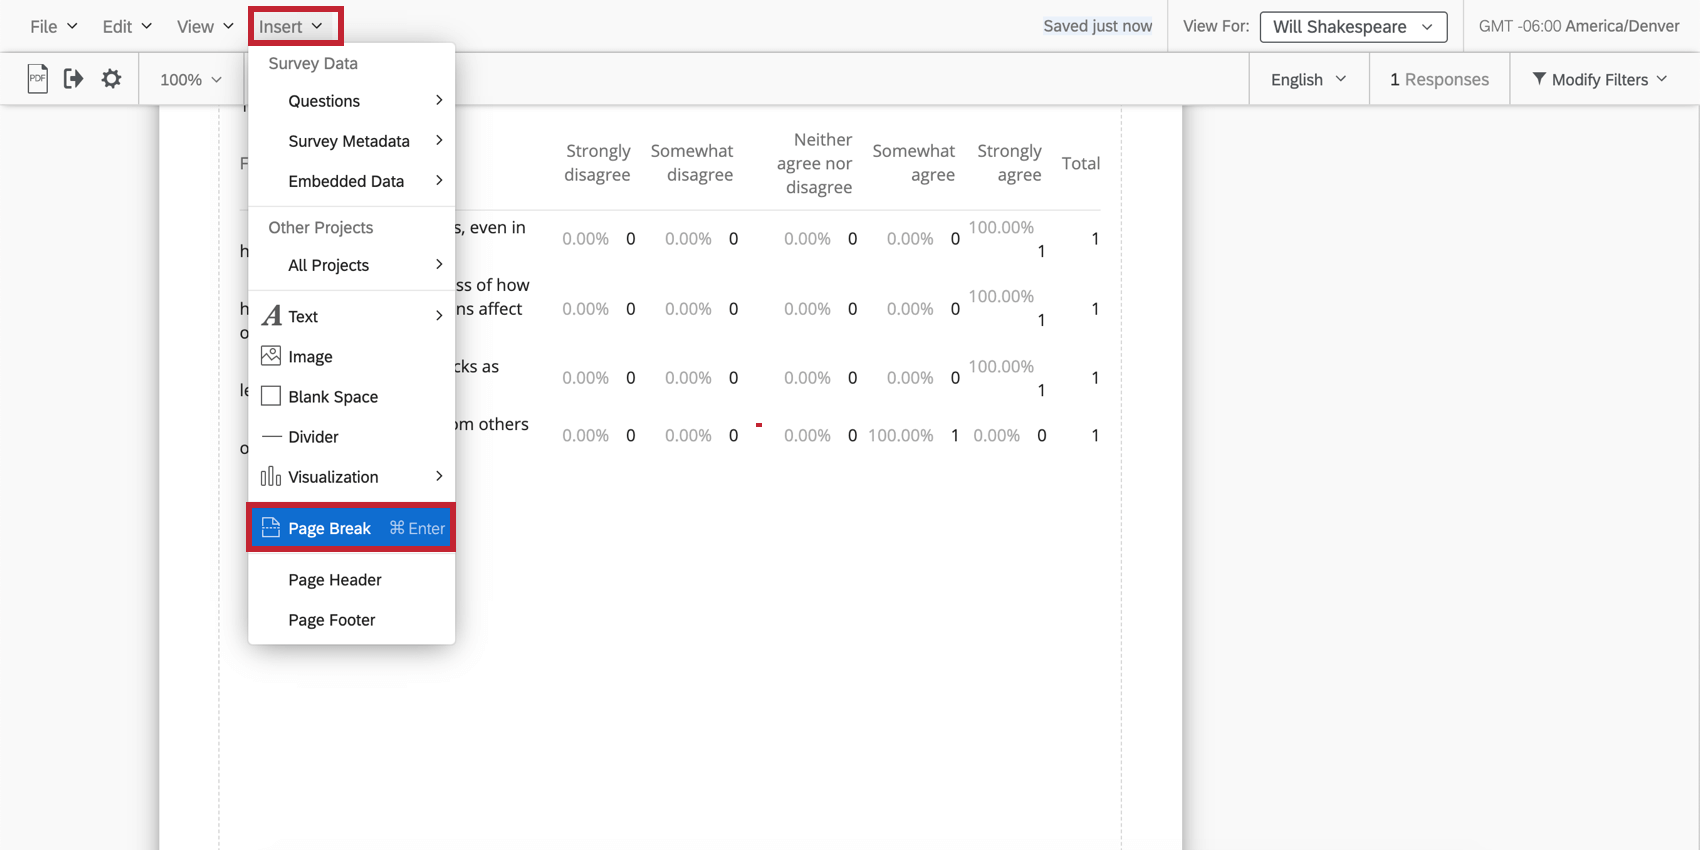

Qtip: You can also add a page break using the Insert buttons that appear when you click a visualization.
Remove a page break by hovering over it and clicking the X.
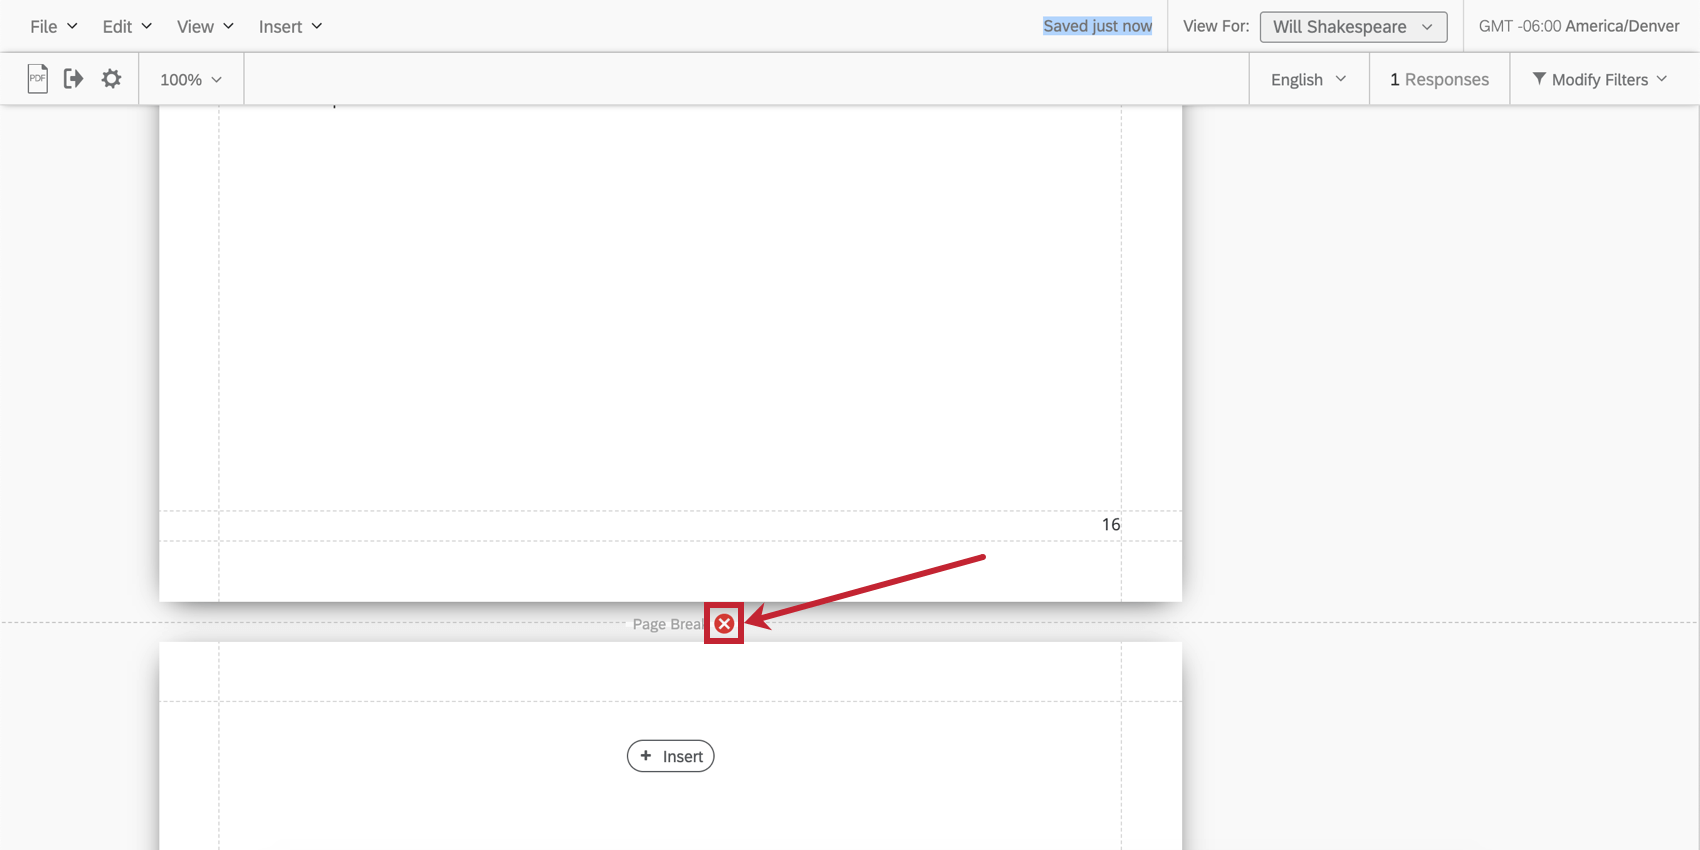

Qtip: Removing a page break will not remove the entire page if there is content on it. You must manually remove the visualizations on a page before it will disappear.
Qtip: If a page is entirely blank, it will not be included when you export the report to PDF. This is true whether there’s two page breaks with nothing between them (or just a blank space), or if the page is blank because display logic has hidden all the visualizations.
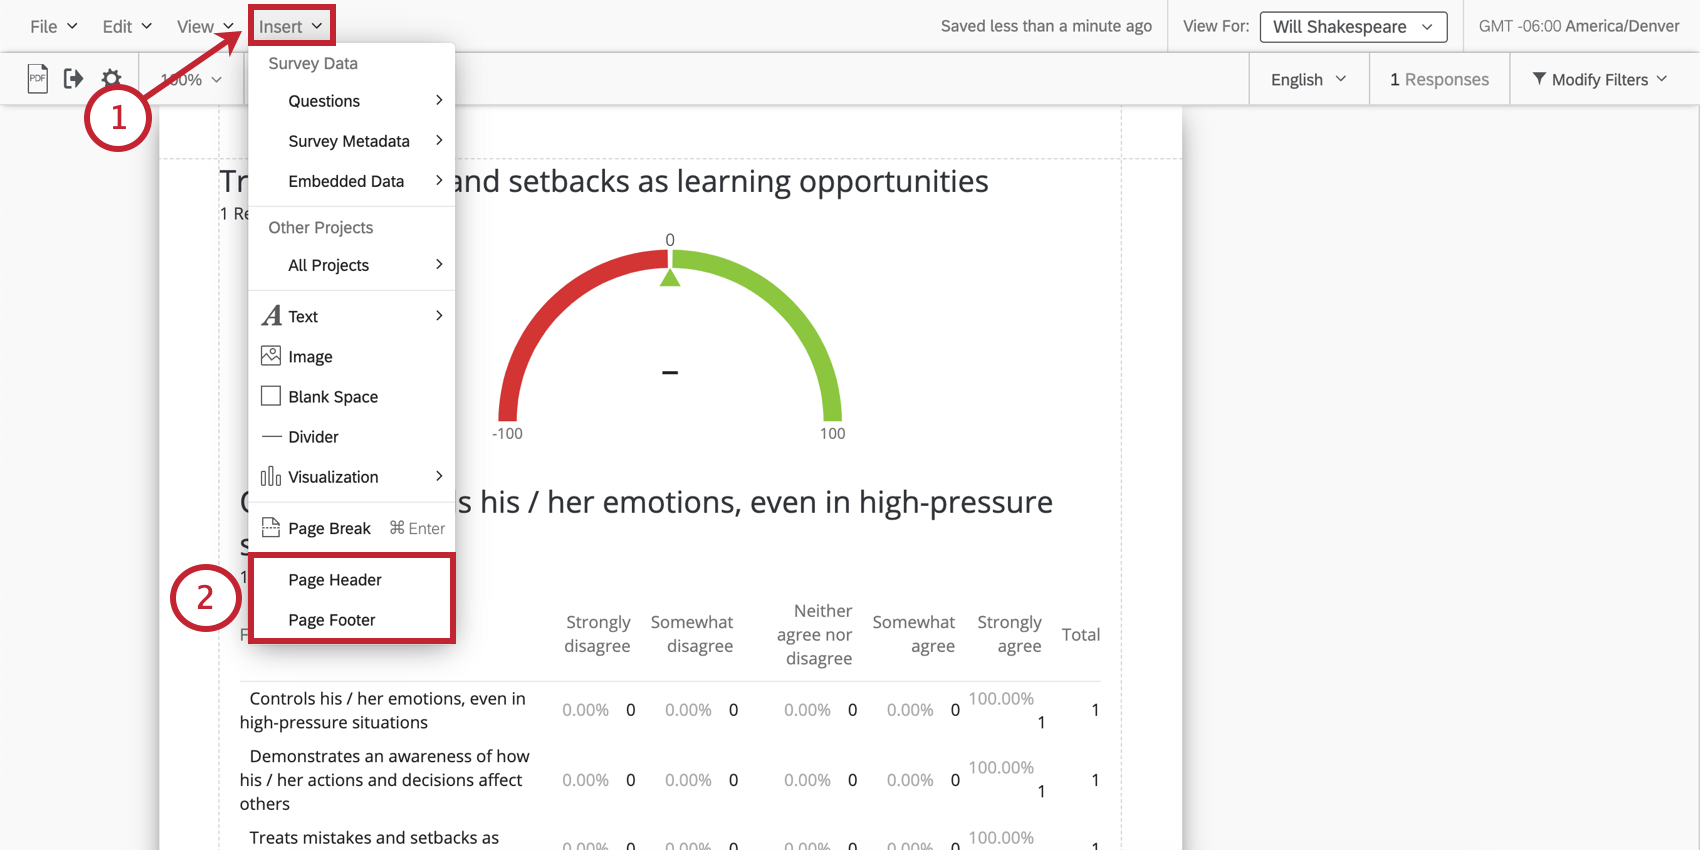
Header and Footer
You can add a header and footer to your report that contains a title, page numbers, or logos.
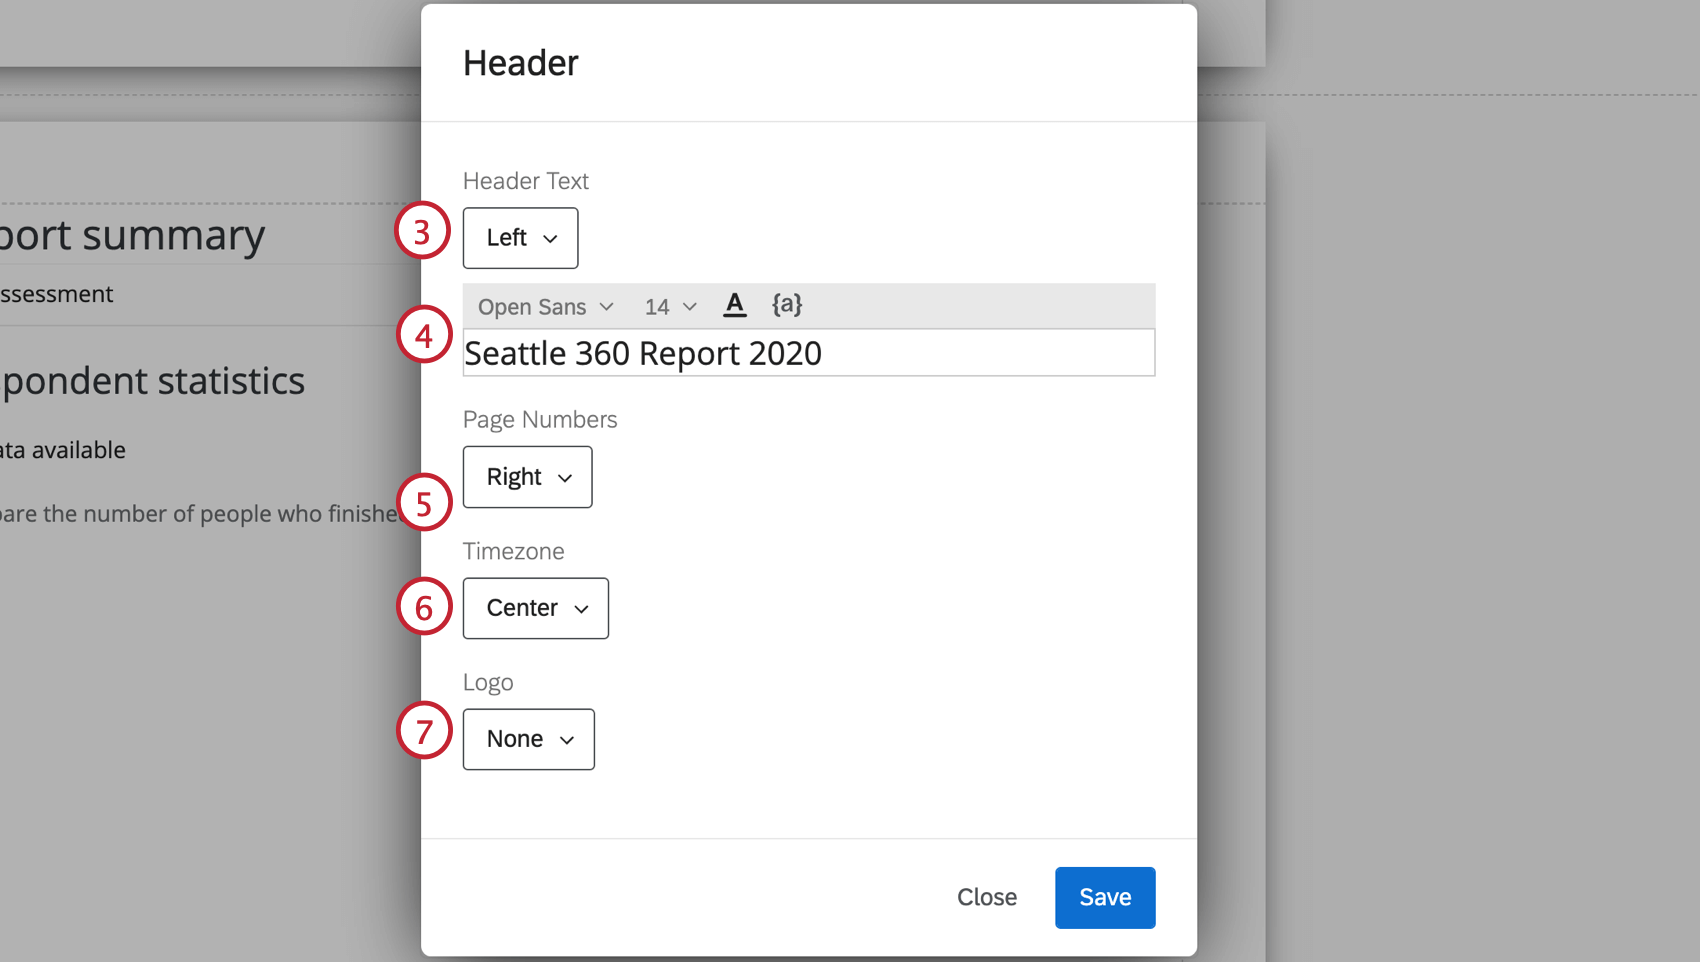
Qtip: To add piped text to your header and footer, use the piped text button ( {a} ). This can be useful if you want to dynamically insert the date, subject’s name, etc.
Qtip: This field will disappear if you chose None in Step 3. However, if you make the field reappear, any previous changes you made here will come back.
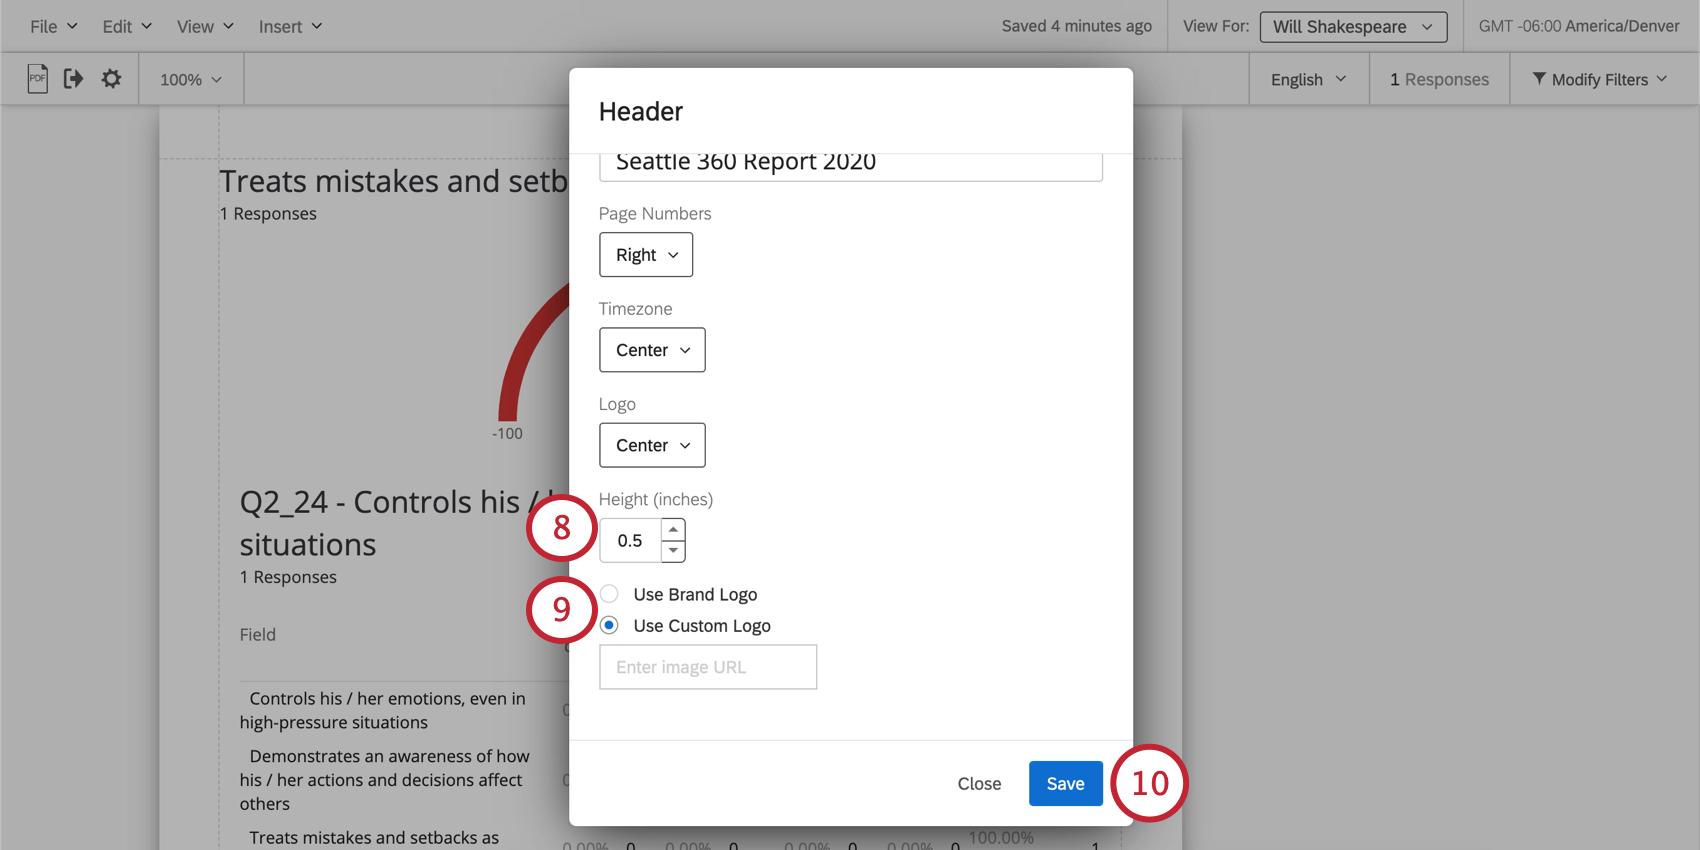
Qtip: This field will disappear if you chose None in Step 7.
Qtip: This field will disappear if you chose None in Step 7.
Once a header or footer is added, you can double-click on it to open the editing window again.
FAQs
How can I add formulas to my 360 report?
How can I add formulas to my 360 report?
That's great! Thank you for your feedback!
Thank you for your feedback!