
Data & Analysis in Imported Data Projects
What's on this page
About Data & Analysis in Imported Data Projects
Data & Analysis is a tab where you can view and manage the data in your project. Here, you can filter, classify, merge, clean, and statistically analyze your response data. This support page will explain the features available in the Data & Analysis tab of an imported data project.
Qtip: Only imported data projects created on or after June 16, 2021 have a Data section in the Data & Analysis tab. That means imported data projects created before this date will not have all the functionality described on this page.
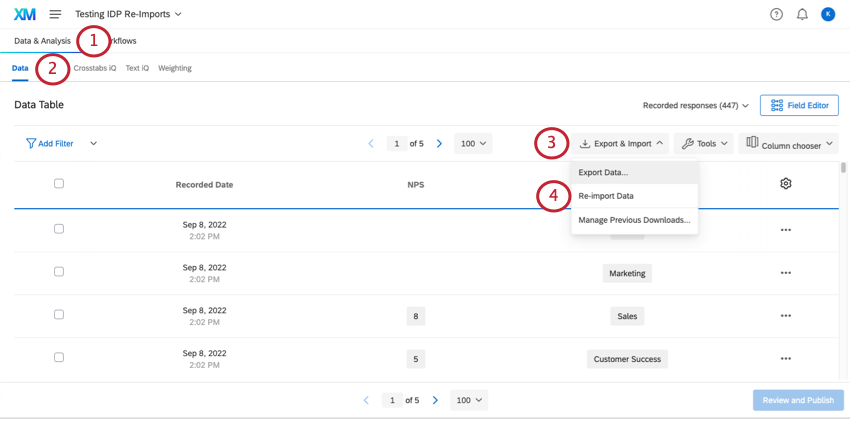
Re-Importing Data
Imported data projects are the only types of projects that allow you to re-import data. This means that rather than uploading all new responses, you can make changes to data that already exists in your project using a file upload.
Unique IDs
Imported data projects with unique identifiers are the easiest to re-import data for, because the unique ID is how Qualtrics recognizes which responses to update.
Unique identifiers can only be added to an imported data project when you first create it. See step 11 in the setup process.
Examples of unique identifiers include response IDs, customer IDs, employee IDs, or random number IDs you generated right inside the sheet.
Preparing a File
Your file must have the exact same headers your dataset has. You want to make sure no headers are missing and that every field rename is accounted for. To make this easy, we recommend exporting your data to use as a template for your updates.
Qtip: These are the changes you can not make to the data by uploading a file:
- Add a new field (instead, see Custom Field Creation)
- Remove a field (instead, see Removing a Variable)
Qtip: If you edit a response’s unique ID, it will be recognized as a brand new response.
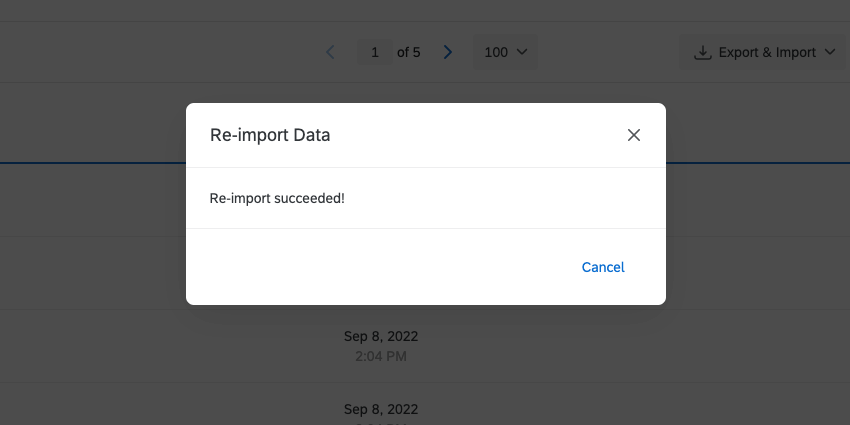
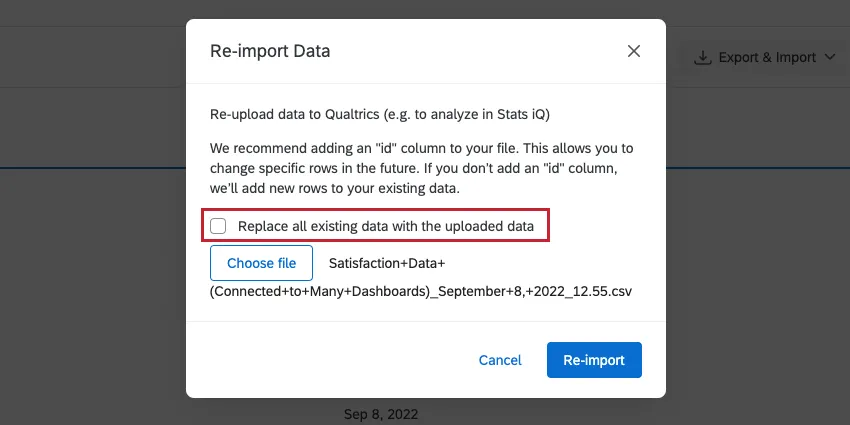
Re-Importing Data
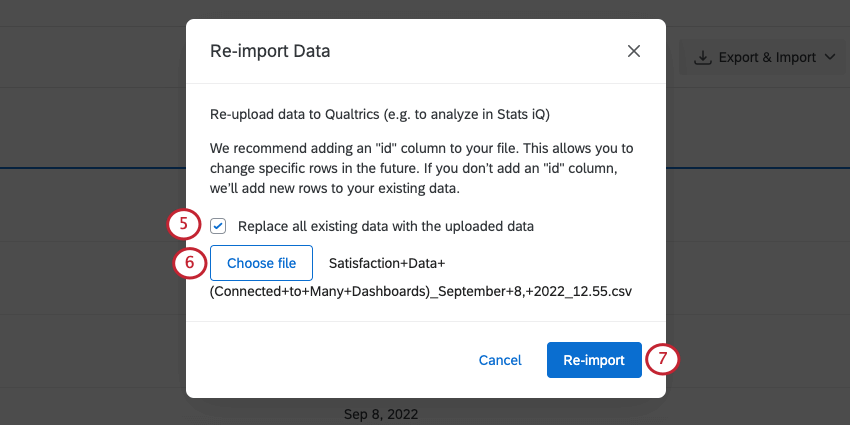
Once your file is ready, you can import it with a few easy steps.
Attention: You can always delete responses as needed. If you are deleting multiple responses at once, please note that you can only select 1 page of responses at a time.
Importing New Data
To import new responses into an imported data project, you will follow many of the same steps you take to re-import data. There are just 2 differences:
- If your project has unique identifiers, make sure the new responses have their own unique identifiers that do not match any other existing response. If unique identifiers match, data will be overwritten.
- If your project does not have unique identifiers, make sure you do not select Replace all existing data with the uploading data.
Qtip: These are the changes you can not make to the data by uploading a file:
- Add a new field (instead, see Custom Field Creation)
- Remove a field (instead, see Removing a Variable)
Troubleshooting Imports
If you want to replace or edit the data you’ve already uploaded, see Re-Importing Data. If you want to add additional responses, see Importing Data.
If you have closely followed all of the steps in the recommended section, here’s some more troubleshooting you can try:
- For more file parameters, such as size limits and date formatting, see Preparing a File for Import.
- If your imported data project doesn’t have unique identifiers, you can’t add them after the fact.
- Keep in mind that neither re-importing data nor importing data allow you to delete fields or create new fields. Instead, see Editing Fields and Custom Field Creation.
- For common issues with CSV and TSV files, see CSV & TSV Upload Issues on how to resolve them.
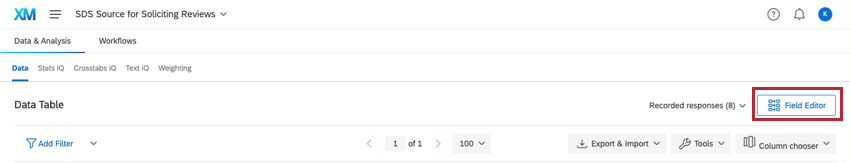
Editing Fields
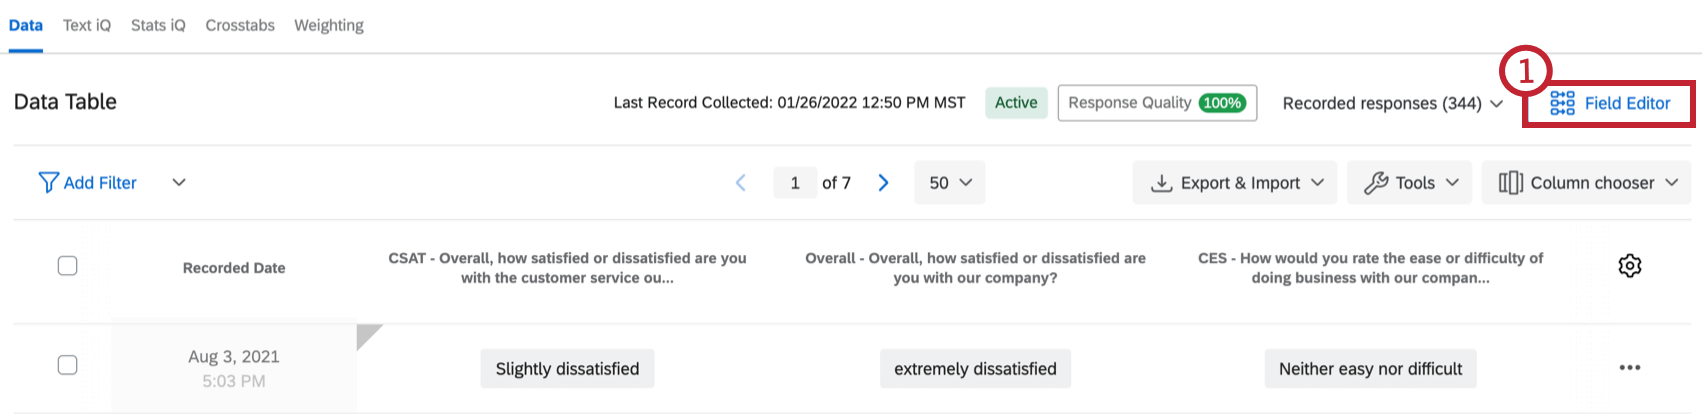
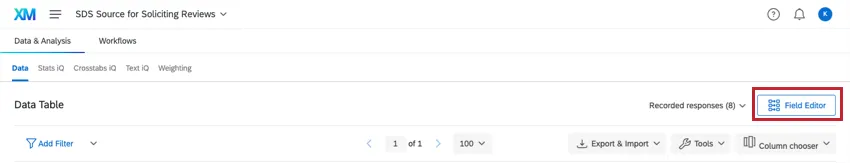
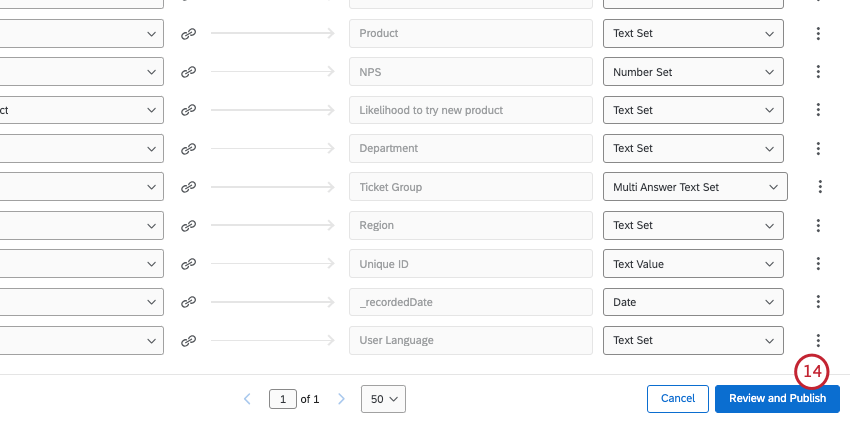
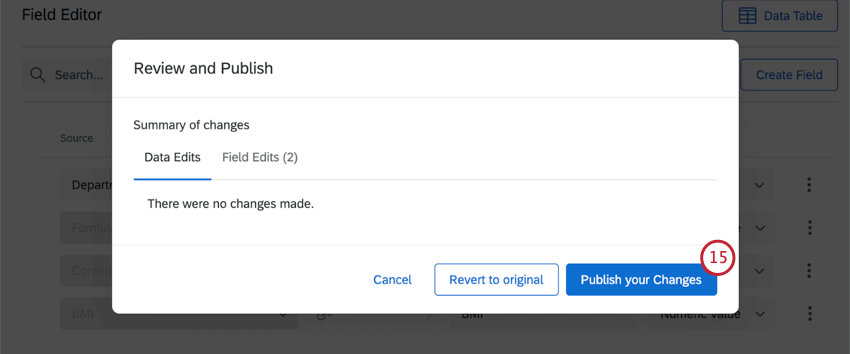
The Field Editor is located in the Data section of the Data & Analysis tab. Here, you’ll see all the fields in your imported data project and be able to make edits, such as renaming fields, recoding values, changing field types, and removing fields.
To learn more about all the ways you can edit your fields, see Editing Custom Fields.
To create a new field altogether, see Custom Field Creation.
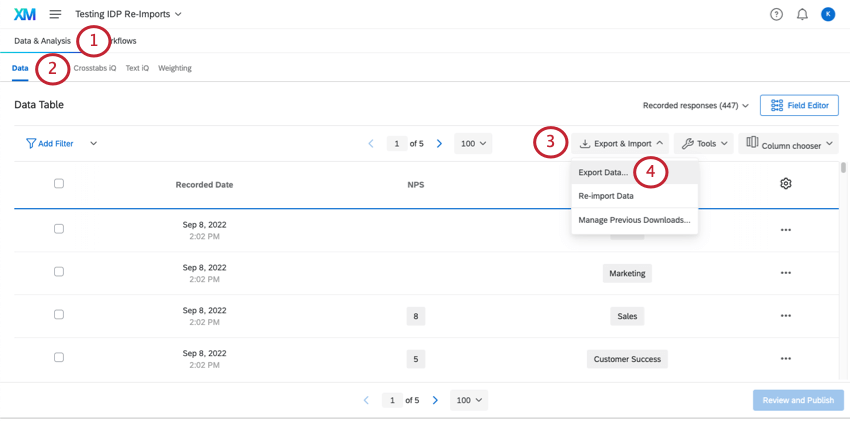
Exporting Data
Exporting data from an imported data project is very similar to exporting data from a survey project. There are just a few key differences.
Export formats
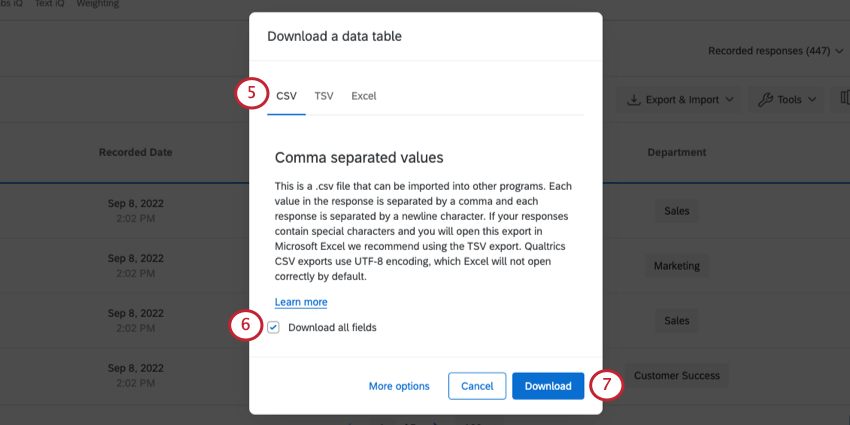
You can only export data in a CSV, TSV, or Excel (XLSX) format.
Export options
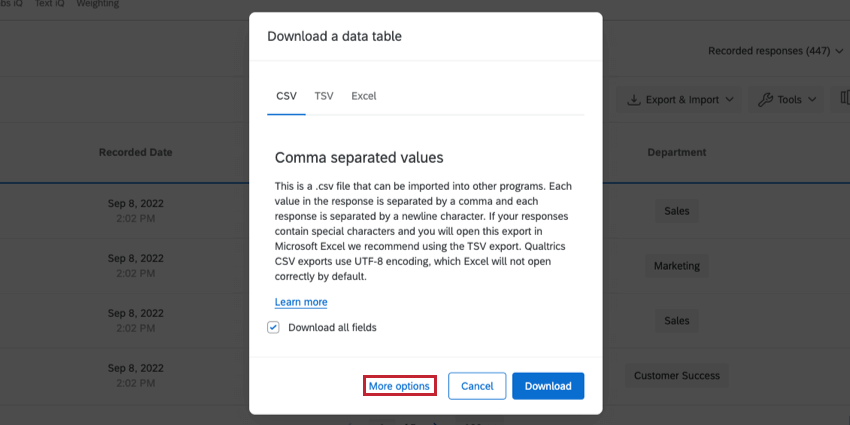
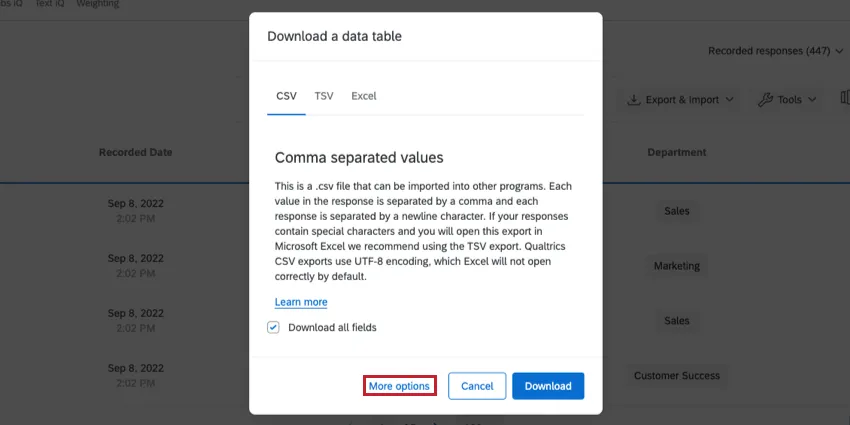
Imported data projects only have the following export options available when you click More options:
- Compress data as .zip file
- Use commas for decimals
- Remove line breaks
See Export Options for a description of each.
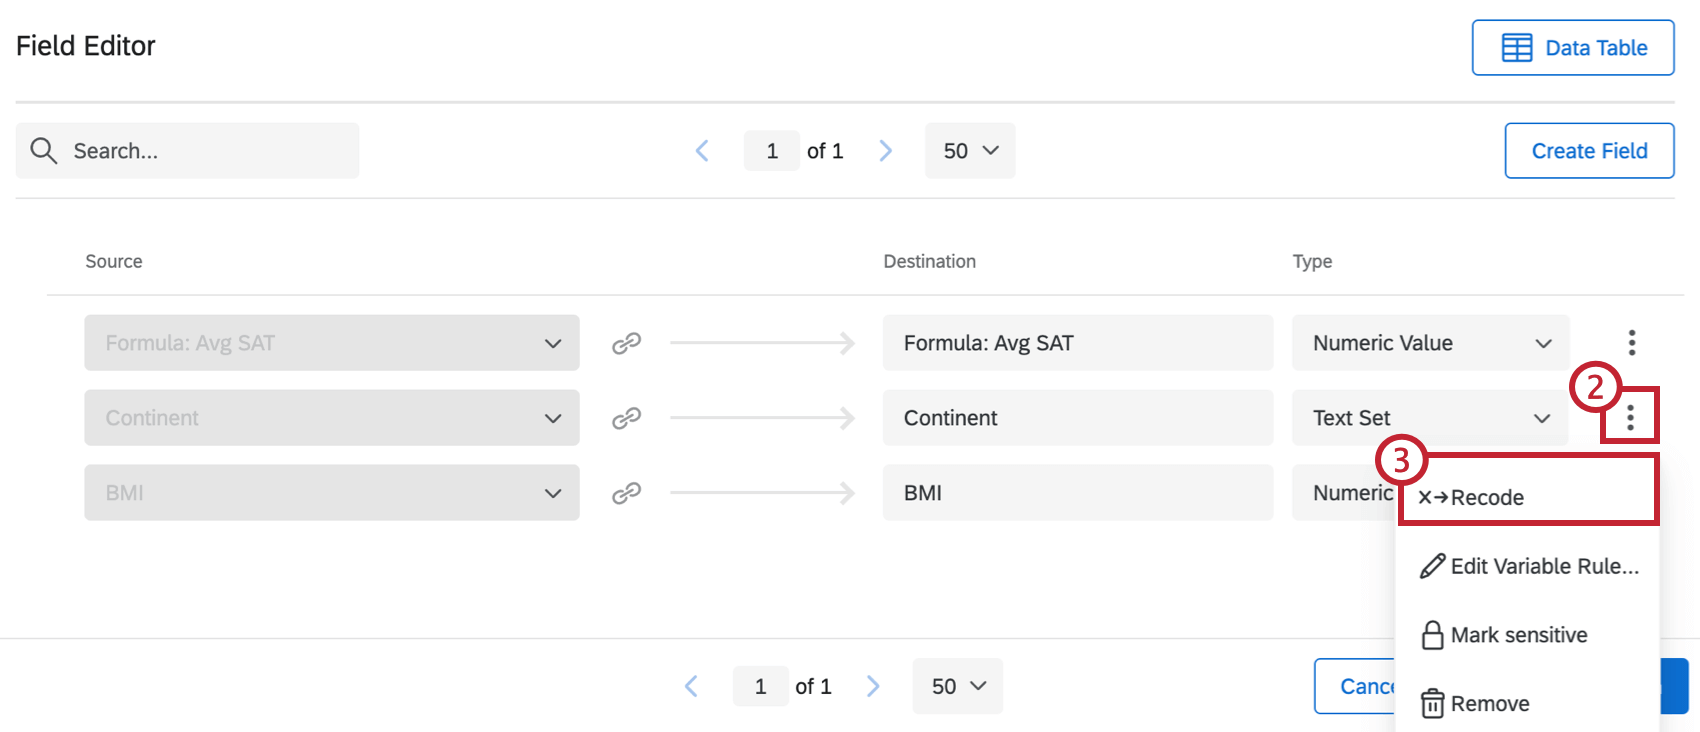
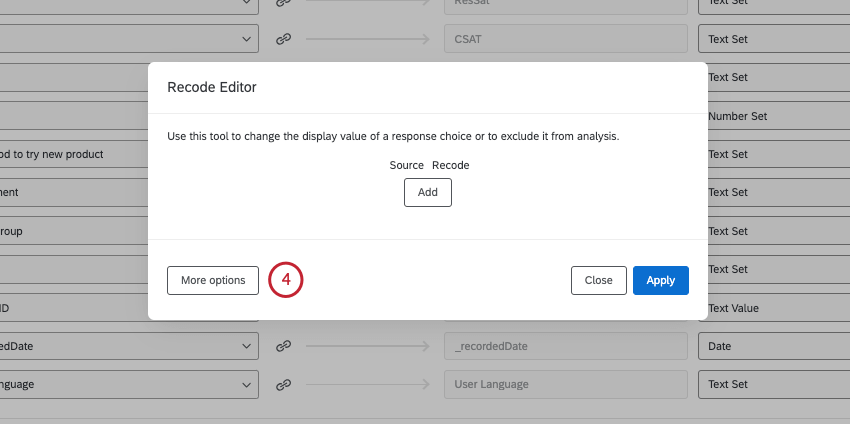
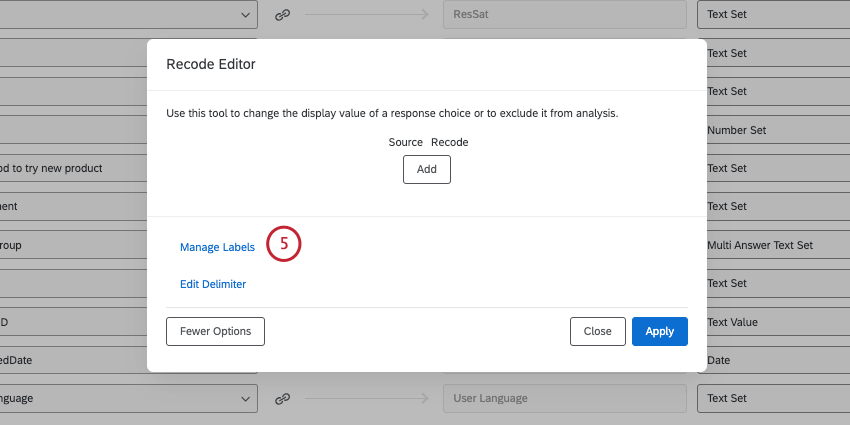
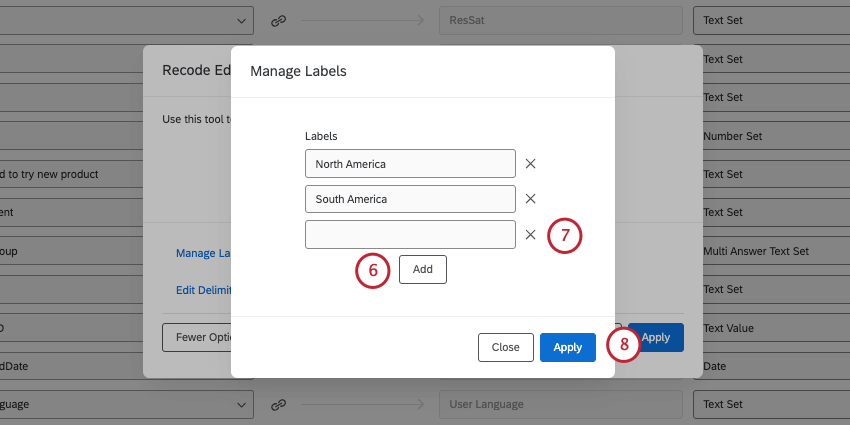
Recoding a Field
After setting up your project, you may realize that you need to change the values of a response choice or exclude choices from analysis. In this case, you would recode the values of your variable.
Attention: Only the following types of fields can be recoded: Number Set, Text Set, and Multi-Answer Text Set.
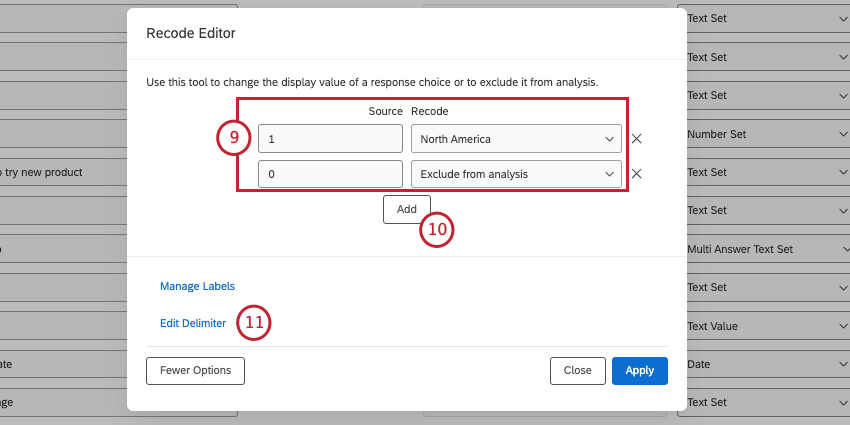
Qtip: If an option is excluded from analysis, it will be hidden and ignored in any reports you create. This option does not remove the entire associated response from the project — it only hides the selected field value.
Qtip: Note that the recode values are limited by the field type. For example, if you want to recode scores to groups, the type must be Text Set instead of Number Set, because the recoded values will be text instead of numbers.
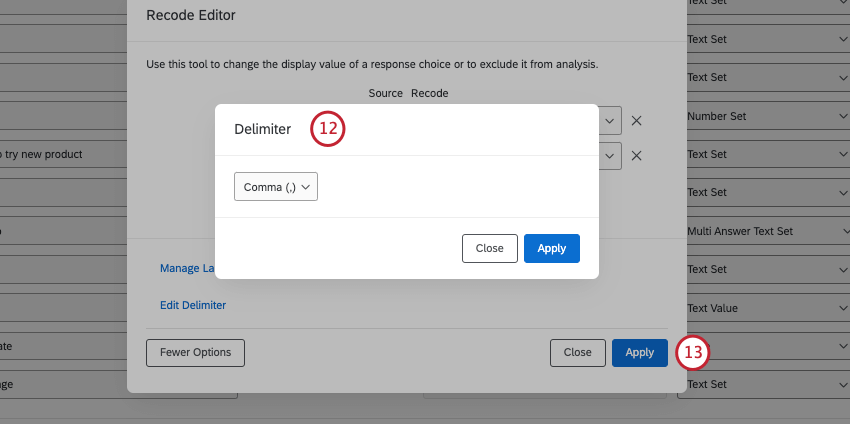
Qtip: A delimiter determines how multiple values for the same field are separated in a file. For example, a customer who has visited multiple locations might have a “Location” equal to “Seattle,Provo”. In this example, the comma would be the delimiter.
Other Features in the Data Section
A lot of functionality in the Data section works the same as it does in survey projects. Here’s a list of support pages covering this functionality:
- Recorded Responses Qtip: Imported data projects only allow you to view 1 page of responses at a time. That means filtering or selecting data in bulk will be limited to 1 page of responses.

- Filtering Responses
- Custom Field Creation
- Editing Responses
- Translate Comments Qtip: Make sure comments you want to translate are set to open text.
Qtip: Imported data projects do not have the “Responses in progress” page.
Other Features in Data & Analysis
The Data section isn’t the only one in the Data & Analysis tab. The following is a list of features available in imported data projects, so long as they have already been purchased for your license.
That's great! Thank you for your feedback!
Thank you for your feedback!