Data on its own is nothing but facts and figures. To be useful, raw data needs to be broken down, modelled and interrogated to provide useful information. Especially in businesses and organisations where decisions are based on data, collected data must be analysed and presented correctly and simply.
But what is data analysis, what are the best data analysis techniques, and why is it useful? Read on to find out.
What is data analysis?
Data analysis is a broad term that encompasses structured and scientific data collection, analysis, cleansing and data modelling. Data analysis applies to any source or amount of data, and helps to uncover insights and information that supports decision-making. Data science, on the other hand, only applies to quantitative data.
Data analysis typically revolves around two types of data: qualitative and quantitative data:
Qualitative data
Qualitative data is descriptive and typically unstructured. Examples of qualitative data include: interview transcripts, open-ended answers to surveys, field notes, recordings, questionnaires (but only if you have a small sample size) and so on.
Quantitative data
Put simply, quantitative data is survey data with sufficient sample sizes. It’s essentially data that you can count and assign a numerical value, e.g. revenue in dollars, weight in kilograms, height in feet or inches, length in centimetres. Quantitative data is often structured and suitable for statistical analysis.
You can use both types of data to gain an understanding of the entire business landscape, from how your offering fits into the picture to what customers are looking for.
For example, it can be used to understand the marketplace, your business’ position within the marketplace, and provide customer insights around preferences, decisions and behaviours.
We’ve added a table below to provide you with an at-a-glance view of the differences between qualitative and quantitative research.
| Qualitative | Quantitative |
|---|---|
| Gathered from focus groups, interviews, case studies, expert opinion, observation, social media (via scraping) | Gathered from surveys, questionnaires, polls |
| Use open-ended and open text questions | Use closed-ended (yes/no) and multiple choice questions and open-ended responses (providing a coding scheme is applied to quantify the topics) |
| Uses a ‘human touch’ to uncover and explore an issue (e.g. a customer complaint) | Cannot use a ‘human touch’ to interpret what people are thinking or feeling |
| Helps to formulate a theory to be researched | Tests and confirms a formulated theory |
| Results are categorised, summarised and interpreted linguistically | Results are analysed mathematically and statistically |
| Results expressed as text | Results expressed as numbers, tables and graphs |
| Fewer respondents needed | Many respondents needed |
| Less suitable for scientific research | Tests and confirms a formulated theory |
| Helps to formulate a theory to be researched | More suitable for scientific research as it is compatible with most standard statistical analysis methods |
| Harder to replicate | Easy to replicate |
| Less suitable for sensitive data: respondents may be biased, too familiar or inclined to leak information | Ideal for sensitive data as it can be anonymised and secured |
Find out more about qualitative and quantitative research
Why is data analysis important?
The use of data in decision-making has become more important than ever. Across the globe, businesses and organisations are basing decisions on facts and proven theories, supported by data analysis, rather than making critical decisions on the best guess. These approaches are helping them to plan more efficiently, sustain growth and deliver amazing products.
Here are a few examples of how you can use data analysis:
Customer insights
Using the right data analysis methods, you can gain a complete understanding of your customers.
You can learn everything from their brand, product and service preferences to which channels they use when researching those products and services. You can even uncover their shopping behaviours and how they change based on what they’re buying.
You can also use data analysis to better understand your customers’ demographics, interests and habits so you can better tailor your marketing and brand messaging around themes they’ll connect with.
Marketing insights
Marketing is highly reliant on information and data analysis to measure its effectiveness and success — or failure.
From website analytics like measuring traffic and leads to analysing brand sentiment, data analysis is critical to understanding the full picture of your marketing strategy. Based on measurement requirements, you can implement data collection and analysis methods to plug the gaps across the entire buyer journey, enabling you to make specific changes at each stage to help drive growth.
Presentation techniques like data visualisation also form a huge part of marketing analysis (we’ll talk more about data visualisation later on).
Market insights
Understanding the marketplace is an essential part of figuring out your positioning, how the market is changing and what your business needs to do to adapt to competitors or fast-paced market conditions.
All this can only be understood with the constant collection and analysis of data.
By collecting accurate data, analysing it closely and gaining insights you can ensure your organisation is ready and able to adapt when it needs to.
Data analysis methods
It’s important to understand that there are many different types of data analysis. Each type has its uses, and your choice ultimately depends on what kind of information you want to get out of the process — and if you want to get qualitative or quantitative data.
Here’s a quick breakdown of some the main types of data analysis you can use and what they’re best for:
Descriptive analysis
Descriptive analysis is a form of data analysis that uses responses from a data set to establish patterns or understand the average of one variable (both in isolation and how it compares to other variables in the study).
Descriptive analysis is typically used as a means of understanding occurrences or preferences. For example, you would use descriptive analysis when trying to determine the most popular type of exercise people did in the last year.
In your survey, you’d present a range of responses (running, weight lifting, swimming). Once the survey results were collected, you could use descriptive analysis to understand the popularity of each activity, the averages among the variables and how each variable compares to the other.
Diagnostic analysis
Where descriptive analysis is about understanding trends, diagnostic analysis is the next stage in uncovering the causes of those trends and highlighting any correlation between the variables in your study.
Diagnostic analysis usually starts with a hypothesis that you’re trying to prove or disprove. For example, your hypothesis could be that the number of people signing up to a gym in August is caused by the hot weather.
You’ll use this hypothesis to guide your data analysis and keep you focused on what you’re looking at.
Another thing to keep in mind with diagnostic analysis is understanding the distinction between correlation and causation.
Misunderstanding these two concepts could lead to you making incorrect interpretations of your data. When we talk about correlation, there can are two types you likely see:
1. Positive correlation
Let’s say we have two variables. A positive correlation means that as one variable increases, so does the other.
2. Negative correlation
In this case, as one variable increases, the other decreases.
However, just because the variables are correlated, it doesn’t always mean that one change is caused by the other.
When doing diagnostic analysis, causation is the ideal insight to gain, but correlation can still provide useful insights too.
3. Causation
In research, causation is when one factor (or variable) causes another. In other words, there is a cause-and-effect relationship between the two. Correlation doesn’t imply causation, but causation always implies correlation.
For example, a lack of graphics card memory can cause visual processes on a computer to freeze or not work entirely. Visual process failures and an inoperable graphics card are correlated, but they don’t highlight the cause. Similarly, a lack of random access memory (RAM) might cause your phone to freeze or lock up — the lack of RAM is the cause and the two issues (the phone freezing and locking up) are correlated, but neither causes the other.
Causation is important because it brings you to the root of all issues and enables you to see how other variables are influenced in the process.
Exploratory analysis
Exploratory analysis is used by data analysts to assess raw data and understand its primary characteristics, and then determine how to manipulate the data sources to get different answers.
Exploratory analysis is primarily used to prove the validity of results gathered from data and that they apply to any goals or objectives. Essentially it’s used as a way to use data before making any assumptions about a situation.
Once the raw data is collected, data analysts can then manipulate the data sources to test the impact of changing variables on the overall results. It can be particularly useful when checking assumptions, uncovering anomalies and discovering patterns.
Exploratory analysis can also be used for more complex studies and modelling, like machine learning.
Predictive analysis
As the name suggests, predictive analysis is a data analysis process that uses historical data, algorithms and even machine learning to try to predict what will happen in the future based on previous trends.
Predictive analysis has been rapidly growing in popularity in businesses and organisations as the data analysis tools used to map the future predictions – and better advances in machine learning – have made predictions more accurate.
It also has multiple business applications, which is another reason it’s so popular.
For example, predictive analysis is becoming a key part of cyber security and crime prevention — particularly when it comes to fraud.
By compiling vast amounts of data in real-time and analysing results and trends to uncover patterns, predictive analysis can help data analysts detect abnormalities in behaviour or actions based on previous events and take the necessary actions.
Reducing consumer risk is another major area for predictive analytics and it’s often used when assessing credit scores and predicting whether customers can afford to take on expensive financial products – like a mortgage or loan – based on their previous history.
Leisure businesses like airlines and hotels also use predictive analytics by using data from previous years to predict usage when setting prices.
Find out more about predictive analytics
Prescriptive analysis
Prescriptive analysis is one of the more advanced data analysis techniques and is often used by businesses and organisations trying to work out what decisions to make, or what steps they need to take to make something happen, such as increasing sales in Q4 compared to the previous year.
It involves data mining from multiple sources like resources, historical data and past performances and using advanced analysis techniques like machine learning to model the data and provide insights to guide future decisions.
It’s a relatively new type of data analysis because it relies on the collection and analysis of huge amounts of data and advanced technology like artificial intelligence or machines to process and analyse the data effectively.
As more data is provided and analysed, the models will become more accurate and change based on the variables being input.
Prescriptive analysis is often accompanied by data visualisation tools to help decision-makers understand what they’re looking at and take appropriate actions.
It does, however, require businesses and organisations to know the types of questions to ask to gain the correct information and stop people from making decisions based on the wrong assumptions. It also requires the ability to make the right judgments based on the data models provided.
The data analysis process
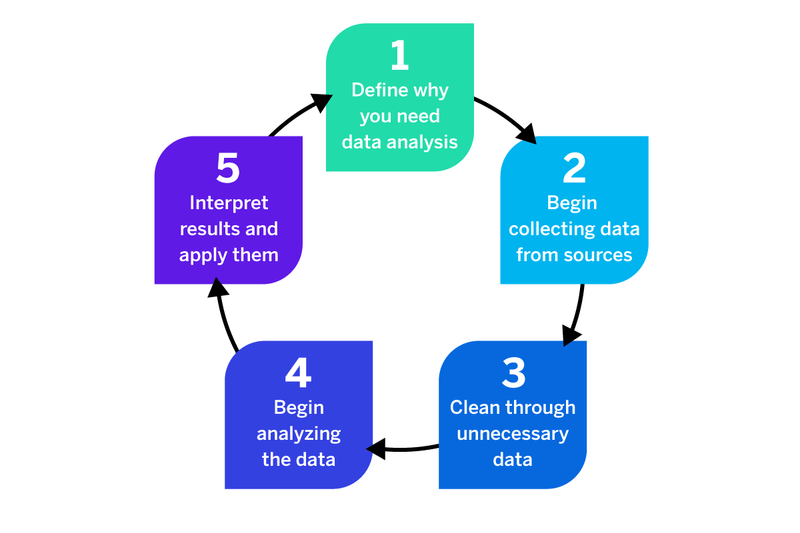
The data analysis process is a fairly straightforward one regardless of the data analysis techniques being used.
But you do need to follow it properly if you want to capture the right data and glean meaningful insights that you can use.
You can see the outline of the data analysis process in the graphic above, but this is a quick rundown of the data analysis steps you’ll take:
1. What’s the goal of the objective?
The first question to ask before embarking on any data analysis is why are you looking to analyse data in the first place?
Do you need it to guide strategic business decisions or update business processes? Are you trying to find an answer to a specific question or do you want to test a hypothesis? Or do you need to make improvements to operational processes but don’t know where to start?
Why you need data can help you figure out the right data analysis methods to choose and also guide key decisions like whether you need qualitative data analysis or quantitative data analysis (or a combination of the two).
Then there’s the what of your data analysis — what data should you be collecting? What conclusions do you want to draw from the data? Clearly defining the what will help you to select the appropriate tools and methodology to capture the data for the why.
2. Collecting raw data
Once you’ve decided why you need the data and what method of data analysis is best, you can start the process of collecting your raw data.
This could be devising and sending out surveys for quantitative data analysis, emailing customers questionnaires or running focus groups for qualitative data analysis.
3. Data cleaning
Regardless of how you collect your data, you have to account for errors and put measures in place to prevent them. For example, preventing participants from submitting the same survey twice to avoid duplication. Instead, allow them to modify their answers (if it’s an online survey).
For incomplete surveys, questionnaires or interviews, ensure that participants can only submit them once they’ve filled in the required fields. If they don’t have an answer, encourage them to put N/A, for instance.
Incorrect, incomplete and duplicate responses can affect the quality, consistency and usability of your data, preventing you from making accurately informed decisions.
4. Begin analysing data
Once you’ve collected and cleansed your data, you can begin the process of data analysis. As you’re analysing your data you’ll be able to identify patterns in your data that you can use to inform your business decisions.
The most common data analysis techniques
(Predictive) Regression analysis: used to estimate the relationship between a set of variables. The idea is to find a correlation between a dependent variable (the outcome you want to measure or predict) and any number of independent variables.
For example, if you’ve been planting trees in an area at the same rate every day for a year, it can predict how many trees you’ll have planted in 5 or 10 year’s time.
(Predictive) Time series analysis: Time series analysis is a statistical technique used to identify trends and cycles over time, e.g. sales forecasts such as weekly or monthly profits, or fluctuations based on seasonality.
For example, time series analysis is helpful when it comes to industry forecasts, weather data and rainfall measurements, and stock prices. This is because rather than collecting data over time, analysts record data points at specific intervals, giving a complete, constantly evolving picture of the data.
(Predictive and prescriptive) Monte Carlo simulation: this is a complex, computerised technique designed to generate models of possible outcomes and their probability distributions. It measures a range of possibilities and calculates their likelihood.
This simulation is used for outcomes that are difficult to predict due to the intervention of random variables. It helps to understand the impact of risk and uncertainty in predictions and forecasting models. It’s also referred to as a multiple probability simulation.
For example, you could use Monte Carlo simulation to determine which moves to play in chess (of which there are between 10111 and 10123 positions (including illegal moves), which is more than the number of atoms in the world. The computer essentially calculates
all these possible moves (with the most powerful computers doing trillions of calculations per second) and continuously plays until it satisfies a set end condition, e.g. a win.
(Exploratory) Factor analysis: Factor analysis is used to reduce a large number of variables to a smaller number of impactful factors. It condenses large datasets into smaller, manageable chunks and helps to uncover hidden patterns.
For example, say you conduct a survey of 500 townspeople, resulting in a dataset of 500 variables. You could work to find which variables are correlated and put them into groups, e.g. income, education, family size. These groups are factors. From there, it becomes easier to analyse the data.
(Exploratory) Cohort analysis: Cohort analysis is a subset of behavioural analytics that takes the data from a given dataset and breaks it into groups for analysis. These related groups (or cohorts) usually share common characteristics or experiences.
For example, you could use cohort analysis to understand customer expenditure over time. You can analyse trends in purchase behaviour and then gauge whether or not the quality of the average customer is increasing throughout the lifecycle.
(Exploratory) Cluster analysis: This exploratory technique seeks to identify structures and patterns within a data set. It sorts data points into groups (or clusters) that are internally similar and externally dissimilar.
For example, in medicine and healthcare, you can use cluster analysis to identify groups of patients with similar symptoms. From there, you can alter your method of care. You can also use cluster analysis in areas like marketing to identify homogeneous groups of customers that have similar needs and attitudes.
(Exploratory) Sentiment analysis: A qualitative technique that belongs to a broad category of text analysis. Sentiment analysis looks at, assesses and classifies emotions conveyed through text data.
For example, you can use it to determine how customers feel about your brand, product or service based on feedback.
5. Data interpretation
Once you’ve finished analysing data from your study, you can begin your data interpretation and begin to apply actions based on what the results are telling you.
There are plenty of business intelligence tools you can use to model your data to make this interpretation easier and ensure you can make decisions quickly. We’ll outline a few of those tools shortly — but first, here are a few mistakes to avoid.
Common mistakes in data analysis
Diligence is essential when it comes to data analysis — but when you’re running complex studies at scale, it’s sometimes hard to keep on top of the quality and assurance process. Here are just a few of the most common data analysis mistakes researchers make and how to avoid them:
Sample bias
Sample bias is when you choose a sample that is non-representative of the wider population you’re trying to assess.
Any bias in your sample can result in data skewing more to one side and not providing reliable results.
A simple example of this is sampling 1,000 people to assess political preferences but oversampling one political allegiance.
One of the most effective ways to avoid sampling bias is to use simple random sampling. This ensures that samples are chosen by chance — and every person in the population has an equal chance of being selected.
Intentional data manipulation
This happens in data science when data analysts try to fit their data to support a particular theory or hypothesis. It can occur by accident, but is typically an intentional act and can have a serious impact on the validity of the study. Data manipulation also applies when participants can submit a survey more than once, skewing the overall results if you don’t double-check duplicate contact data.
You can avoid data manipulation by:
- Ensuring participants use contact information that can be verified and cannot submit using those same details twice (but give them the option to amend their responses)
- Using a system designed for market research and capable of highlighting duplicate submissions/errors
- Using multiple contact methods — so if you’re collecting data at point of service or contact, ensure you run an online element as well. For example, you could ask customers to take a survey in store (or as they’re leaving) and then email other customers or engage with them via social media channels.
- Allowing customers to remain anonymous
- Vetting and assessing surveys and questionnaires before they’re submitted to participants to prevent any bias or leading questions
Disclosing your study’s metrics
The respondents of your study should never be aware of the metrics you’re measuring your study with, because once they do you could end up in a situation where they try to tell you what you want to know.
That said, it’s helpful to provide respondents with guidance and the context of the study — why it’s important and relevant and how their honest responses can contribute to its validity. This includes a preface about the questions that are going to be asked.
Fitting the data to your model
This is a very common problem in data science when you find that data only shows you a result because it fits the data modelling you’re using it with. If you move the data over to another model, you could find it doesn’t then show any results.
For example, you might focus so heavily on the accuracy of a particular model that it can only fit a particular use case, e.g. measuring sales trends based on seasonality. Analysts typically build and use machine learning models to apply them to general scenarios — not incredibly specific ones. Overfitting the model will mean that it only works for one situation and subsequently fails others.
This particular problem is like comparing apples with oranges. If you create a time series model specifically for seasonal sales trends, that model will only give you that data. You can’t suddenly apply the data to other models and expect to get the same results, because they won’t account for the same variables.
Focusing only on quantitative data
Numbers can only tell you part of the story, and making decisions on numbers alone can result in negative consequences.
While quantitative data can produce some useful insights it must also be used in the context of the wider market or environment and, ideally, aided with some qualitative insights.
Having solution bias to your products
Solution bias can be a big risk for businesses who are convinced they have a good product or service, and are trying to find data to support their theory at any cost.
In these circumstances, you could end up with data analysis that you’re using simply to confirm your own assumptions, rather than properly testing your theory.
What data analysis tools can you use?
There are several tools available that can make analysing raw data easier and improve your data visualisation so you can easily interpret your information and make decisions.
Here are some of the most common and best data analysis tools available:
R
R is a free, open-source data analysis tool that can be used for a range of data science, statistical analysis and data visualisation studies.
Using R, data analysts can set up and run data models, which can be automatically updated as new information is added.
SAS
SAS is one of the most widely used software packages for data analysis. It’s primarily used for statistical analysis and data visualisation.
As well as quantitative analysis, SAS can be used for qualitative analysis, is highly customisable based on the data analysis you want to use, and offers a range of statistical methods and algorithms.
Python
Python is an effective tool for every stage of data analytics and is widely used by data analysts. It’s an easy software language to learn and use and is highly effective for data mining — particularly when scraping large amounts of data from multiple sources.
Java
Java is one of the most versatile statistical programming languages as well as coding languages that can be used for numerous types of data analysis. Java can be connected to SQL and MySQL databases. It’s also highly customisable and can be used for mass data scraping, analysis, and visualisation.
SQL
SQL is a relatively simple processing language that can be used to interact with multiple data sources at once, making it highly effective. It can also perform complex data analysis which, when combined with the data sources used, make it a highly accessible and effective data analysis tool for data analysts.
Using data analysis to improve your ROI
Data analytics is a highly effective tool for improving ROI because you can be sure you’re making decisions based on data, rather than instinct.
This is particularly true when it comes to using data analytics to gain customer insights, but also for improving specific aspects of your business. For example, you could carry out an employee engagement survey and use data analytics to uncover trends and areas for improvement. Your analysis of the survey results might find that your employees want more remote working/hybrid working options — you can then implement new flexible and hybrid working policies to support them. This in turn will improve productivity and engagement, which in turn can support your bottom line.
Here’s another example — let’s say you run a conjoint analysis survey to determine the optimal bundle of benefits and features, including price. You can readily test product options, features and pricing to find out what customers are most likely to buy and therefore what product variants will contribute to your bottom line.
You can even apply data analytics to product concept testing to uncover whether or not your product ideas are up to scratch and marketable to your target audience. This ensures you spend less time investing in ideas that won’t work, and more time on ideas that will.
The possibilities are endless and data analysis applies to every area of your business. By taking the time to analyse trends within your data, you can start to create better experiences and outcomes for all.
Free eBook: Start maximising your research ROI