
What is factor analysis?
Factor analysis is the practice of condensing many variables into just a few, so that your research data is easier to work with.
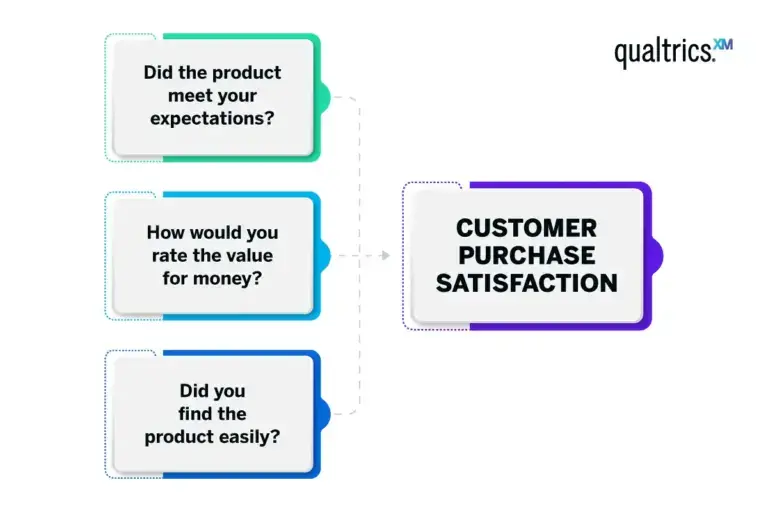
For example, a retail business trying to understand customer buying behaviours might consider variables such as ‘did the product meet your expectations?’, ‘how would you rate the value for money?’ and ‘did you find the product easily?’. Factor analysis can help condense these variables into a single factor, such as ‘customer purchase satisfaction’.
The theory is that there are deeper factors driving the underlying concepts in your data, and that you can uncover and work with them instead of dealing with the lower-level variables that cascade from them. Know that these deeper concepts aren’t necessarily immediately obvious – they might represent traits or tendencies that are hard to measure, such as extraversion or IQ.
Factor analysis is also sometimes called “dimension reduction”: you can reduce the “dimensions” of your data into one or more “super-variables,” also known as unobserved variables or latent variables. This process involves creating a factor model and often yields a factor matrix that organises the relationship between observed variables and the factors they’re associated with.
As with any kind of process that simplifies complexity, there is a trade-off between the accuracy of the data and how easy it is to work with. With factor analysis, the best solution is the one that yields a simplification that represents the true nature of your data, with minimum loss of precision. This often means finding a balance between achieving the variance explained by the model and using fewer factors to keep the model simple.
Factor analysis isn’t a single technique, but a family of statistical methods that can be used to identify the latent factors driving observable variables. Factor analysis is commonly used in market research, as well as other disciplines like technology, medicine, sociology, field biology, education, psychology and many more.
What is a factor?
In the context of factor analysis, a factor is a hidden or underlying variable that we infer from a set of directly measurable variables.
Take ‘customer purchase satisfaction’ as an example again. This isn’t a variable you can directly ask a customer to rate, but it can be determined from the responses to correlated questions like ‘did the product meet your expectations?’, ‘how would you rate the value for money?’ and ‘did you find the product easily?’.
While not directly observable, factors are essential for providing a clearer, more streamlined understanding of data. They enable us to capture the essence of our data’s complexity, making it simpler and more manageable to work with, and without losing lots of information.
Free eBook: This Year’s Global Market Research Trends Report
Key concepts in factor analysis
These concepts are the foundational pillars that guide the application and interpretation of factor analysis.
Variance
Central to factor analysis, variance measures how much numerical values differ from the average. In factor analysis, you’re essentially trying to understand how underlying factors influence this variance among your variables. Some factors will explain more variance than others, meaning they more accurately represent the variables they consist of.
Eigenvalue
The eigenvalue expresses the amount of variance a factor explains. If a factor solution (unobserved or latent variables) has an eigenvalue of 1 or above, it indicates that a factor explains more variance than a single observed variable, which can be useful in reducing the number of variables in your analysis. Factors with eigenvalues less than 1 account for less variability than a single variable and are generally not included in the analysis.
Factor score
A factor score is a numeric representation that tells us how strongly each variable from the original data is related to a specific factor. Also called the component score, it can help determine which variables are most influenced by each factor and are most important for each underlying concept.
Factor loading
Factor loading is the correlation coefficient for the variable and factor. Like the factor score, factor loadings give an indication of how much of the variance in an observed variable can be explained by the factor. High factor loadings (close to 1 or -1) mean the factor strongly influences the variable.
When to use factor analysis
Factor analysis is a powerful tool when you want to simplify complex data, find hidden patterns, and set the stage for deeper, more focused analysis.
It’s typically used when you’re dealing with a large number of interconnected variables, and you want to understand the underlying structure or patterns within this data. It’s particularly useful when you suspect that these observed variables could be influenced by some hidden factors.
For example, consider a business that has collected extensive customer feedback through surveys. The survey covers a wide range of questions about product quality, pricing, customer service and more. This huge volume of data can be overwhelming, and this is where factor analysis comes in. It can help condense these numerous variables into a few meaningful factors, such as ‘product satisfaction’, ‘customer service experience’ and ‘value for money’.
Factor analysis doesn’t operate in isolation – it’s often used as a stepping stone for further analysis. For example, once you’ve identified key factors through factor analysis, you might then proceed to a cluster analysis – a method that groups your customers based on their responses to these factors. The result is a clearer understanding of different customer segments, which can then guide targeted marketing and product development strategies.
By combining factor analysis with other methodologies, you can not only make sense of your data but also gain valuable insights to drive your business decisions.
Factor analysis assumptions
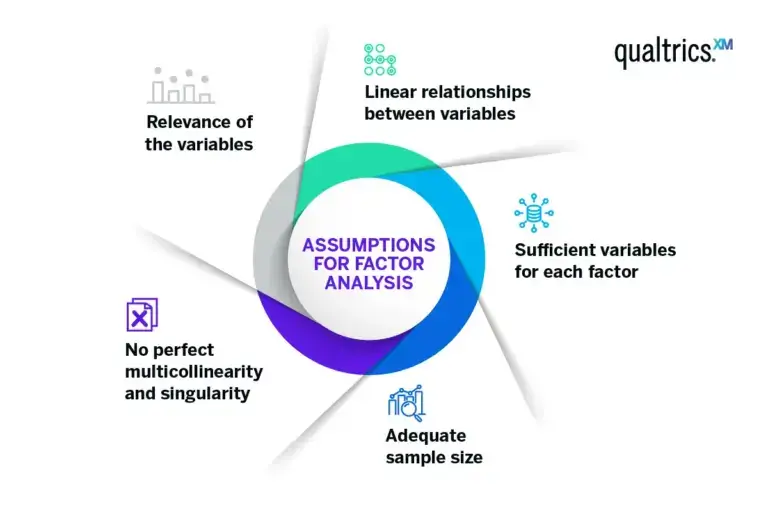
Factor analysis relies on several assumptions for accurate results. Violating these assumptions may lead to factors that are hard to interpret or misleading.
Linear relationships between variables
This ensures that changes in the values of your variables are consistent.
Sufficient variables for each factor
Because if only a few variables represent a factor, it might not be identified accurately.
Adequate sample size
The larger the ratio of cases (respondents, for instance) to variables, the more reliable the analysis.
No perfect multicollinearity and singularity
No variable is a perfect linear combination of other variables, and no variable is a duplicate of another.
Relevance of the variables
There should be some correlation between variables to make a factor analysis feasible.
Types of factor analysis
There are two main factor analysis methods: exploratory and confirmatory. Here’s how they are used to add value to your research process.
Confirmatory factor analysis
In this type of analysis, the researcher starts out with a hypothesis about their data that they are looking to prove or disprove. Factor analysis will confirm – or not – where the latent variables are and how much variance they account for.
Principal component analysis (PCA) is a popular form of confirmatory factor analysis. Using this method, the researcher will run the analysis to obtain multiple possible solutions that split their data among a number of factors. Items that load onto a single particular factor are more strongly related to one another and can be grouped together by the researcher using their conceptual knowledge or pre-existing research.
Using PCA will generate a range of solutions with different numbers of factors, from simplified 1-factor solutions to higher levels of complexity. However, the fewer number of factors employed, the less variance will be accounted for in the solution.
Exploratory factor analysis
As the name suggests, exploratory factor analysis is undertaken without a hypothesis in mind. It’s an investigatory process that helps researchers understand whether associations exist between the initial variables, and if so, where they lie and how they are grouped.
How to perform factor analysis: A step-by-step guide
Performing a factor analysis involves a series of steps, often facilitated by statistical software packages like SPSS, Stata and the R programming language. Here’s a simplified overview of the process.
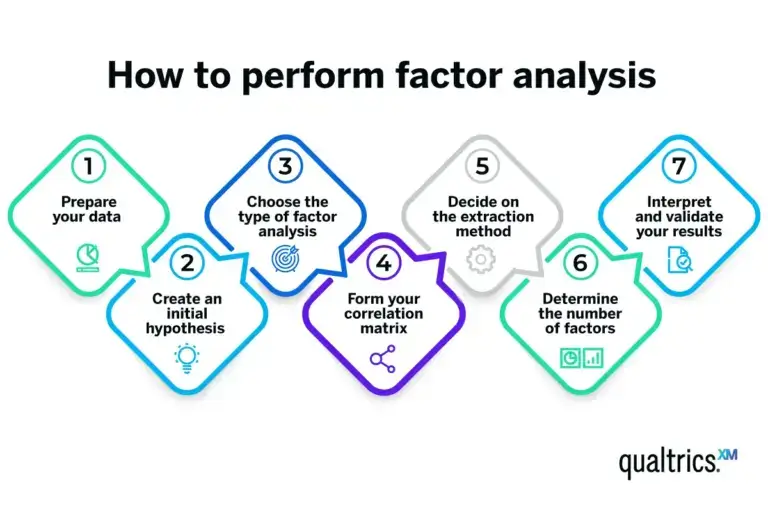
Prepare your data
Start with a dataset where each row represents a case (for example, a survey respondent), and each column is a variable you’re interested in. Ensure your data meets the assumptions necessary for factor analysis.
Create an initial hypothesis
If you have a theory about the underlying factors and their relationships with your variables, make a note of this. This hypothesis can guide your analysis, but keep in mind that the beauty of factor analysis is its ability to uncover unexpected relationships.
Choose the type of factor analysis
The most common type is exploratory factor analysis, which is used when you’re not sure what to expect. If you have a specific hypothesis about the factors, you might use confirmatory factor analysis.
Form your correlation matrix
After you’ve chosen the type of factor analysis, you’ll need to create the correlation matrix of your variables. This matrix, which shows the correlation coefficients between each pair of variables, forms the basis for the extraction of factors. This is a key step in building your factor analysis model.
Decide on the extraction method
Principal component analysis is the most commonly used extraction method. If you believe your factors are correlated, you might opt for principal axis factoring, a type of factor analysis that identifies factors based on shared variance.
Determine the number of factors
Various criteria can be used here, such as Kaiser’s criterion (eigenvalues greater than 1), the scree plot method or parallel analysis. The choice depends on your data and your goals.
Interpret and validate your results
Each factor will be associated with a set of your original variables, so label each factor based on how you interpret these associations. These labels should represent the underlying concept that ties the associated variables together.
Validation can be done through a variety of methods, like splitting your data in half and checking if both halves produce the same factors.
How factor analysis can help you
As well as giving you fewer variables to navigate, factor analysis can help you understand grouping and clustering in your input variables, since they’ll be grouped according to the latent variables.
Say you ask several questions all designed to explore different, but closely related, aspects of customer satisfaction:
- How satisfied are you with our product?
- Would you recommend our product to a friend or family member?
- How likely are you to purchase our product in the future?
But you only want one variable to represent a customer satisfaction score. One option would be to average the three question responses. Another option would be to create a factor dependent variable. This can be done by running a principal component analysis (PCA) and keeping the first principal component (also known as a factor). The advantage of a PCA over an average is that it automatically weights each of the variables in the calculation.
Say you have a list of questions and you don’t know exactly which responses will move together and which will move differently; for example, purchase barriers of potential customers. The following are possible barriers to purchase:
- Price is prohibitive
- Overall implementation costs
- We can’t reach a consensus in our organisation
- Product is not consistent with our business strategy
- I need to develop an ROI, but cannot or have not
- We are locked into a contract with another product
- The product benefits don’t outweigh the cost
- We have no reason to switch
- Our IT department cannot support your product
- We do not have sufficient technical resources
- Your product does not have a feature we require
- Other (please specify)
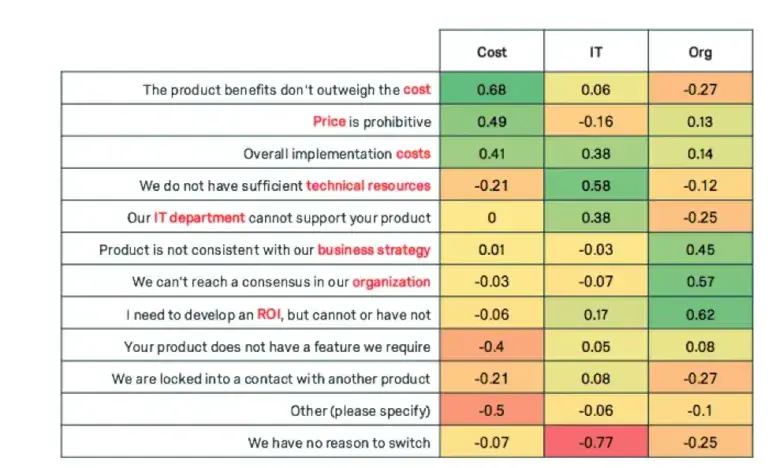
Factor analysis can uncover the trends of how these questions will move together. The following are loadings for 3 factors for each of the variables.
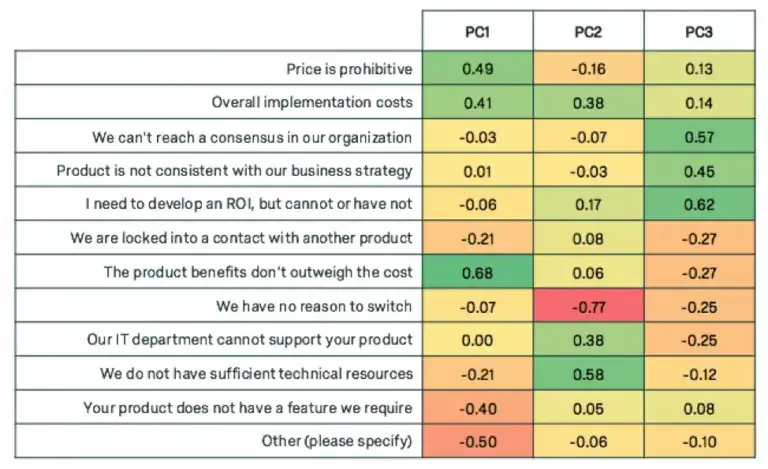
Notice how each of the principal components have high weights for a subset of the variables. Weight is used interchangeably with loading, and high weight indicates the variables that are most influential for each principal component. +0.30 is generally considered to be a heavy weight.
The first component displays heavy weights for variables related to cost, the second weights variables related to IT, and the third weights variables related to organisational factors. We can give our new super variables clever names.
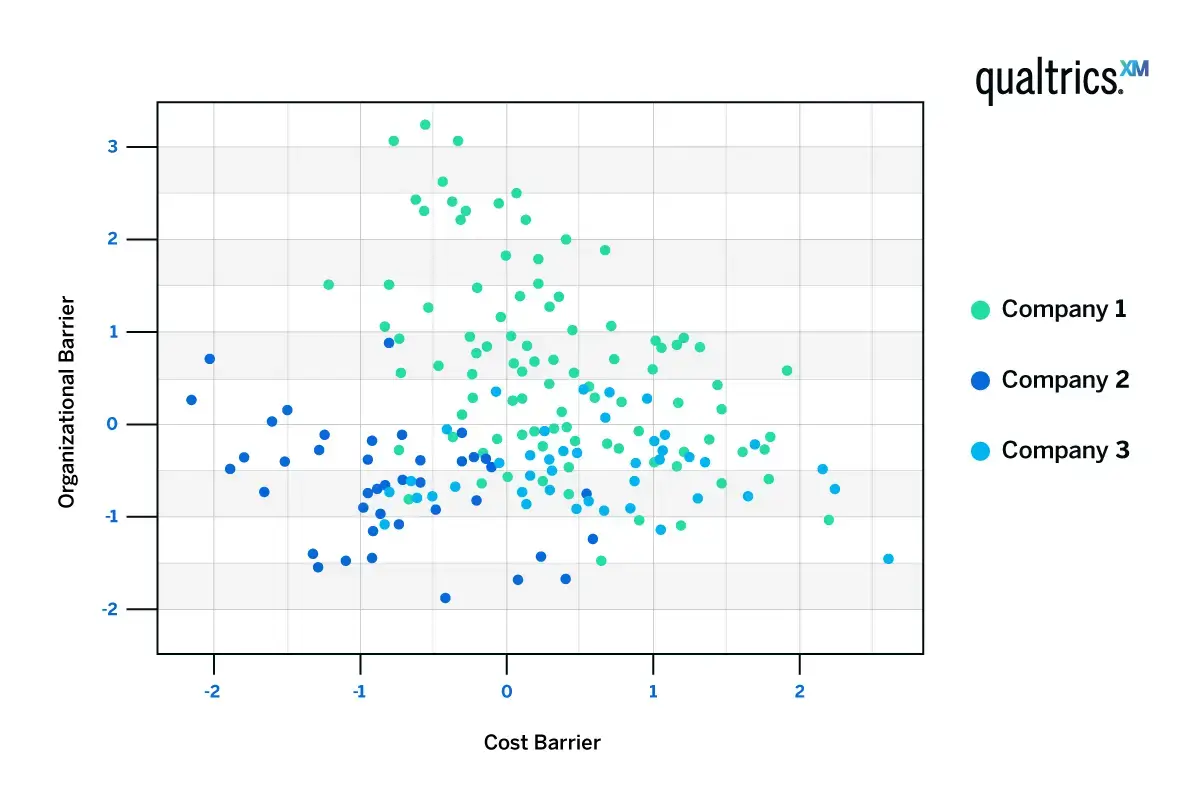
If we were to cluster the customers based on these three components, we can see some trends. Customers tend to be high in cost barriers or organisational barriers, but not both.
The red dots represent respondents who indicated they had higher organisational barriers; the green dots represent respondents who indicated they had higher cost barriers
Considerations when using factor analysis
Factor analysis is a tool, and like any tool its effectiveness depends on how you use it. When employing factor analysis, it’s essential to keep a few key considerations in mind.
Oversimplification
While factor analysis is great for simplifying complex data sets, there’s a risk of oversimplification when grouping variables into factors. To avoid this you should ensure the reduced factors still accurately represent the complexities of your variables.
Subjectivity
Interpreting the factors can sometimes be subjective, and requires a good understanding of the variables and the context. Be mindful that multiple analysts may come up with different names for the same factor.
Supplementary techniques
Factor analysis is often just the first step. Consider how it fits into your broader research strategy and which other techniques you’ll use alongside it.
Examples of factor analysis studies
Factor analysis, including PCA, is often used in tandem with segmentation studies. It might be an intermediary step to reduce variables before using KMeans to make the segments.
Factor analysis provides simplicity after reducing variables. For long studies with large blocks of Matrix Likert scale questions, the number of variables can become unwieldy. Simplifying the data using factor analysis helps analysts focus and clarify the results, while also reducing the number of dimensions they’re clustering on.
Sample questions for factor analysis
Choosing exactly which questions to perform factor analysis on is both an art and a science. Choosing which variables to reduce takes some experimentation, patience and creativity. Factor analysis works well on Likert scale questions and Sum to 100 question types.
Factor analysis works well on matrix blocks of the following question genres:
Psychographics (Agree/Disagree):
- I value family
- I believe brand represents value
Behavioural (Agree/Disagree):
- I purchase the cheapest option
- I am a bargain shopper
Attitudinal (Agree/Disagree):
- The economy is not improving
- I am pleased with the product
Activity-Based (Agree/Disagree):
- I love sports
- I sometimes shop online during work hours
Behavioural and psychographic questions are especially suited for factor analysis.
Sample output reports
Factor analysis simply produces weights (called loadings) for each respondent. These loadings can be used like other responses in the survey.