
Intro
When you rely on data to drive and guide business decisions, as well as predict market trends, just gathering and analysing what you find isn’t enough — you need to ensure it’s relevant and valuable.
The challenge, however, is that so many variables can influence business data: market conditions, economic disruption, even the weather! As such, it’s essential you know which variables are affecting your data and forecasts, and what data you can discard.
And one of the most effective ways to determine data value and monitor trends (and the relationships between them) is to use regression analysis, a set of statistical methods used for the estimation of relationships between independent and dependent variables.
In this guide, we’ll cover the fundamentals of regression analysis, from what it is and how it works to its benefits and practical applications.
Free eBook: This Year’s Global Market Research Trends Report
What is regression analysis?
Regression analysis is a statistical method. It’s used for analysing different factors that might influence an objective – such as the success of a product launch, business growth, a new marketing campaign – and determining which factors are important and which ones can be ignored.
Regression analysis can also help leaders understand how different variables impact each other and what the outcomes are. For example, when forecasting financial performance, regression analysis can help leaders determine how changes in the business can influence revenue or expenses in the future.
Running an analysis of this kind, you might find that there’s a high correlation between the number of marketers employed by the company, the leads generated, and the opportunities closed.
This seems to suggest that a high number of marketers and a high number of leads generated influences sales success. But do you need both factors to close those sales? By analysing the effects of these variables on your outcome, you might learn that when leads increase but the number of marketers employed stays constant, there is no impact on the number of opportunities closed, but if the number of marketers increases, leads and closed opportunities both rise.
Regression analysis can help you tease out these complex relationships so you can determine which areas you need to focus on in order to get your desired results, and avoid wasting time with those that have little or no impact. In this example, that might mean hiring more marketers rather than trying to increase leads generated.
How does regression analysis work?
Regression analysis starts with variables that are categorised into two types: dependent and independent variables. The variables you select depend on the outcomes you’re analysing.
Understanding variables:
1. Dependent variable
This is the main variable that you want to analyse and predict. For example, operational (O) data such as your quarterly or annual sales, or experience (X) data such as your net promoter score (NPS) or customer satisfaction score (CSAT).
These variables are also called response variables, outcome variables, or left-hand-side variables (because they appear on the left-hand side of a regression equation).
There are three easy ways to identify them:
- Is the variable measured as an outcome of the study?
- Does the variable depend on another in the study?
- Do you measure the variable only after other variables are altered?
2. Independent variable
Independent variables are the factors that could affect your dependent variables. For example, a price rise in the second quarter could make an impact on your sales figures.
You can identify independent variables with the following list of questions:
- Is the variable manipulated, controlled, or used as a subject grouping method by the researcher?
- Does this variable come before the other variable in time?
- Are you trying to understand whether or how this variable affects another?
Independent variables are often referred to differently in regression depending on the purpose of the analysis. You might hear them called:
Explanatory variables
Explanatory variables are those which explain an event or an outcome in your study. For example, explaining why your sales dropped or increased.
Predictor variables
Predictor variables are used to predict the value of the dependent variable. For example, predicting how much sales will increase when new product features are rolled out.
Experimental variables
These are variables that can be manipulated or changed directly by researchers to assess the impact. For example, assessing how different product pricing (USD 10 vs USD 15 vs USD 20) will impact the likelihood to purchase.
Subject variables (also called fixed effects)
Subject variables can’t be changed directly, but vary across the sample. For example, age, gender, or income of consumers.
Unlike experimental variables, you can’t randomly assign or change subject variables, but you can design your regression analysis to determine the different outcomes of groups of participants with the same characteristics. For example, ‘how do price rises impact sales based on income?’
Carrying out regression analysis
So regression is about the relationships between dependent and independent variables. But how exactly do you do it?
Assuming you have your data collection done already, the first and foremost thing you need to do is plot your results on a graph. Doing this makes interpreting regression analysis results much easier as you can clearly see the correlations between dependent and independent variables.
Let’s say you want to carry out a regression analysis to understand the relationship between the number of ads placed and revenue generated.
On the Y-axis, you place the revenue generated. On the X-axis, the number of digital ads. By plotting the information on the graph, and drawing a line (called the regression line) through the middle of the data, you can see the relationship between the number of digital ads placed and revenue generated.
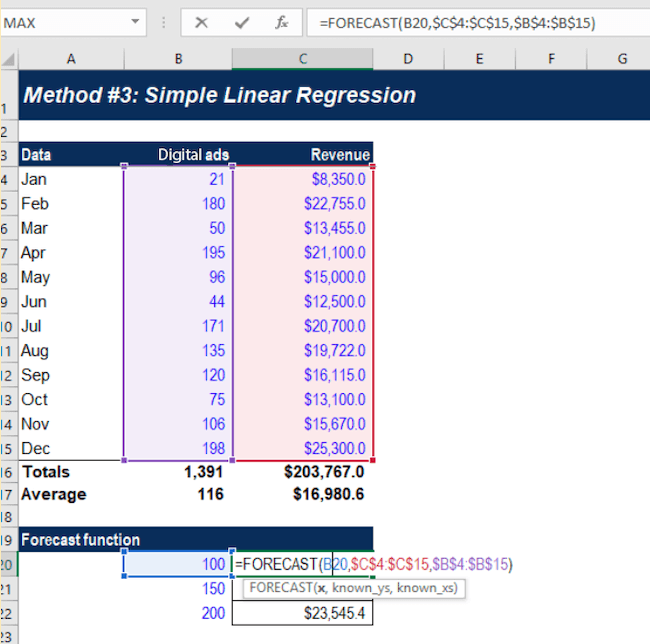
This regression line is the line that provides the best description of the relationship between your independent variables and your dependent variable. In this example, we’ve used a simple linear regression model.
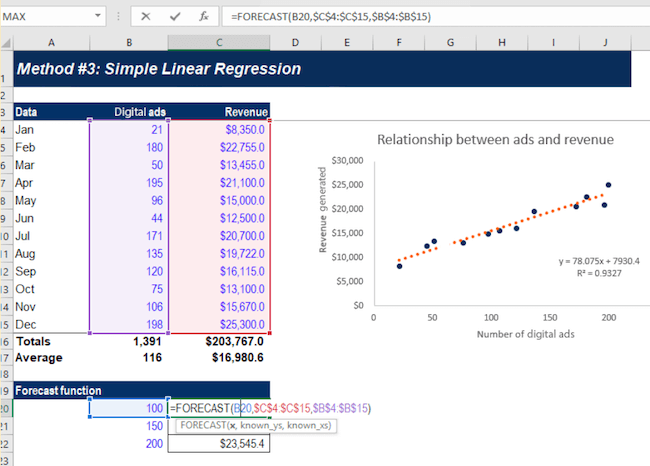
Statistical analysis software can draw this line for you and precisely calculate the regression line. The software then provides a formula for the slope of the line, adding further context to the relationship between your dependent and independent variables.
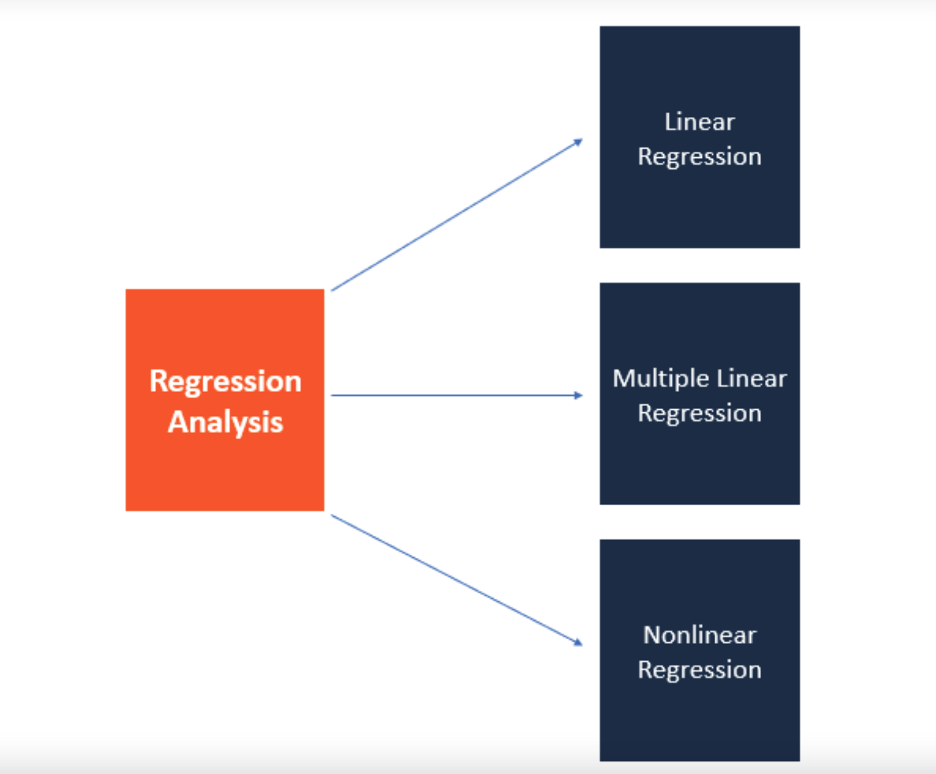
Simple linear regression analysis
A simple linear model uses a single straight line to determine the relationship between a single independent variable and a dependent variable.
This regression model is mostly used when you want to determine the relationship between two variables (like price increases and sales) or the value of the dependent variable at certain points of the independent variable (for example the sales levels at a certain price rise).
While linear regression is useful, it does require you to make some assumptions.
For example, it requires you to assume that:
- the data was collected using a statistically valid sample collection method that is representative of the target population
- The observed relationship between the variables can’t be explained by a ‘hidden’ third variable – in other words, there are no spurious correlations.
- the relationship between the independent variable and dependent variable is linear – meaning that the best fit along the data points is a straight line and not a curved one
Multiple regression analysis
As the name suggests, multiple regression analysis is a type of regression that uses multiple variables. It uses multiple independent variables to predict the outcome of a single dependent variable. Of the various kinds of multiple regression, multiple linear regression is one of the best-known.
Multiple linear regression is a close relative of the simple linear regression model in that it looks at the impact of several independent variables on one dependent variable. However, like simple linear regression, multiple regression analysis also requires you to make some basic assumptions.
For example, you will be assuming that:
- there is a linear relationship between the dependent and independent variables (it creates a straight line and not a curve through the data points)
- the independent variables aren’t highly correlated in their own right
An example of multiple linear regression would be an analysis of how marketing spend, revenue growth, and general market sentiment affect the share price of a company.
With multiple linear regression models you can estimate how these variables will influence the share price, and to what extent.
Multivariate linear regression
Multivariate linear regression involves more than one dependent variable as well as multiple independent variables, making it more complicated than linear or multiple linear regressions. However, this also makes it much more powerful and capable of making predictions about complex real-world situations.
For example, if an organisation wants to establish or estimate how the COVID-19 pandemic has affected employees in its different markets, it can use multivariate linear regression, with the different geographical regions as dependent variables and the different facets of the pandemic as independent variables (such as mental health self-rating scores, proportion of employees working at home, lockdown durations and employee sick days).
Through multivariate linear regression, you can look at relationships between variables in a holistic way and quantify the relationships between them. As you can clearly visualise those relationships, you can make adjustments to dependent and independent variables to see which conditions influence them. Overall, multivariate linear regression provides a more realistic picture than looking at a single variable.
However, because multivariate techniques are complex, they involve high-level mathematics that require a statistical program to analyse the data.
Logistic regression
Logistic regression models the probability of a binary outcome based on independent variables.
So, what is a binary outcome? It’s when there are only two possible scenarios, either the event happens (1) or it doesn’t (0). e.g. yes/no outcomes, pass/fail outcomes, and so on. In other words, if the outcome can be described as being in either one of two categories.
Logistic regression makes predictions based on independent variables that are assumed or known to have an influence on the outcome. For example, the probability of a sports team winning their game might be affected by independent variables like weather, day of the week, whether they are playing at home or away and how they fared in previous matches.
What are some common mistakes with regression analysis?
Across the globe, businesses are increasingly relying on quality data and insights to drive decision-making — but to make accurate decisions, it’s important that the data collected and statistical methods used to analyse it are reliable and accurate.
Using the wrong data or the wrong assumptions can result in poor decision-making, lead to missed opportunities to improve efficiency and savings, and — ultimately — damage your business long term.
Assumptions
When running regression analysis, be it a simple linear or multiple regression, it’s really important to check that the assumptions your chosen method requires have been met. If your data points don’t conform to a straight line of best fit, for example, you need to apply additional statistical modifications to accommodate the non-linear data. For example, if you are looking at income data, which scales on a logarithmic distribution, you should take the Natural Log of Income as your variable then adjust the outcome after the model is created.
Correlation vs. causation
It’s a well-worn phrase that bears repeating – correlation does not equal causation. While variables that are linked by causality will always show correlation, the reverse is not always true. Moreover, there is no statistic that can determine causality (although the design of your study overall can).
If you observe a correlation in your results, such as in the first example we gave in this article where there was a correlation between leads and sales, you can’t assume that one thing has influenced the other. Instead, you should use it as a starting point for investigating the relationship between the variables in more depth.
Choosing the wrong variables to analyse
Before you use any kind of statistical method, it’s important to understand the subject you’re researching in detail. Doing so means you’re making informed choices of variables and you’re not overlooking something important that might have a significant bearing on your dependent variable.
Model building
The variables you include in your analysis are just as important as the variables you choose to exclude. That’s because the strength of each independent variable is influenced by the other variables in the model. Other techniques, such as Key Drivers Analysis, are able to account for these variable interdependencies.
Benefits of using regression analysis
There are several benefits to using regression analysis to judge how changing variables will affect your business and to ensure you focus on the right things when forecasting.
Here are just a few of those benefits:
Make accurate predictions
Regression analysis is commonly used when forecasting and forward planning for a business. For example, when predicting sales for the year ahead, a number of different variables will come into play to determine the eventual result.
Regression analysis can help you determine which of these variables are likely to have the biggest impact based on previous events and help you make more accurate forecasts and predictions.
Identify inefficiencies
Using a regression equation a business can identify areas for improvement when it comes to efficiency, either in terms of people, processes, or equipment.
For example, regression analysis can help a car manufacturer determine order numbers based on external factors like the economy or environment.
Using the initial regression equation, they can use it to determine how many members of staff and how much equipment they need to meet orders.
Drive better decisions
Improving processes or business outcomes is always on the minds of owners and business leaders, but without actionable data, they’re simply relying on instinct, and this doesn’t always work out.
This is particularly true when it comes to issues of price. For example, to what extent will raising the price (and to what level) affect next quarter’s sales?
There’s no way to know this without data analysis. Regression analysis can help provide insights into the correlation between price rises and sales based on historical data.
How do businesses use regression? A real-life example
Marketing and advertising spending are common topics for regression analysis. Companies use regression when trying to assess the value of ad spend and marketing spend on revenue.
A typical example is using a regression equation to assess the correlation between ad costs and conversions of new customers. In this instance,
- our dependent variable (the factor we’re trying to assess the outcomes of) will be our conversions
- the independent variable (the factor we’ll change to assess how it changes the outcome) will be the daily ad spend
- the regression equation will try to determine whether an increase in ad spend has a direct correlation with the number of conversions we have
The analysis is relatively straightforward — using historical data from an ad account, we can use daily data to judge ad spend vs conversions and how changes to the spend alter the conversions.
By assessing this data over time, we can make predictions not only on whether increasing ad spend will lead to increased conversions but also what level of spending will lead to what increase in conversions. This can help to optimise campaign spend and ensure marketing delivers good ROI.
This is an example of a simple linear model. If you wanted to carry out a more complex regression equation, we could also factor in other independent variables such as seasonality, GDP, and the current reach of our chosen advertising networks.
By increasing the number of independent variables, we can get a better understanding of whether ad spend is resulting in an increase in conversions, whether it’s exerting an influence in combination with another set of variables, or if we’re dealing with a correlation with no causal impact – which might be useful for predictions anyway, but isn’t a lever we can use to increase sales.
Using this predicted value of each independent variable, we can more accurately predict how spend will change the conversion rate of advertising.
Regression analysis tools
Regression analysis is an important tool when it comes to better decision-making and improved business outcomes. To get the best out of it, you need to invest in the right kind of statistical analysis software.
The best option is likely to be one that sits at the intersection of powerful statistical analysis and intuitive ease of use, as this will empower everyone from beginners to expert analysts to uncover meaning from data, identify hidden trends and produce predictive models without statistical training being required.
To help prevent costly errors, choose a tool that automatically runs the right statistical tests and visualisations and then translates the results into simple language that anyone can put into action.
With software that’s both powerful and user-friendly, you can isolate key experience drivers, understand what influences the business, apply the most appropriate regression methods, identify data issues, and much more.
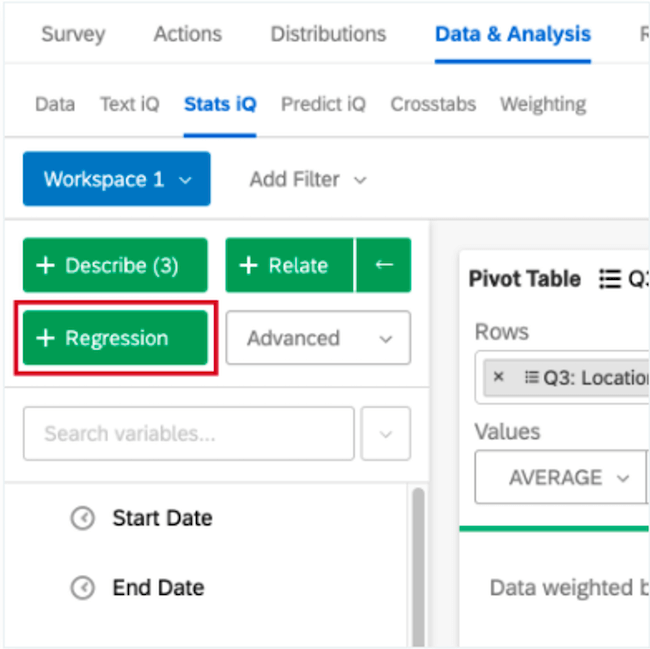
With Qualtrics XM for Strategy & Research, you don’t have to worry about the regression equation because our statistical software will run the appropriate equation for you automatically based on the variable type you want to monitor. You can also use several equations, including linear regression and logistic regression, to gain deeper insights into business outcomes and make more accurate, data-driven decisions.