What is a t-test?
The t-test, also known as t-statistic or sometimes t-distribution, is a popular statistical tool used to test differences between the means (averages) of two groups, or the difference between one group’s mean and a standard value. Running a t-test helps you to understand whether the differences are statistically significant (i.e. they didn’t just happen by a fluke).
For example, let’s say you surveyed two sample groups of 500 customers in two different cities about their experiences at your stores. Group A in Los Angeles gave you on average 8 out of 10 for customer service, while Group B in Boston gave you an average score of 5 out of 10. Was your customer service really better in LA, or was it just chance that your LA sample group happened to contain a lot of customers who had positive experiences?
T-tests give you an answer to that question. They tell you what the probability is that the differences you found were down to chance. If that probability is very small, then you can be confident that the difference is meaningful (or statistically significant).
In a t-test, you start with a null hypothesis – an assumption that the two populations are the same and there is no meaningful difference between them. The t-test will prove or disprove your null hypothesis.
Free IDC report: The new era of market research is about intelligence
Different kinds of t-tests
So far we’ve talked about testing whether there’s a difference between two independent populations, aka a 2-sample t-test. But there are some other common variations of the t-test worth knowing about too.
1-sample t-test
Instead of a second population, you run a test to see if the average of your population is significantly different from a certain number or value.
Example: Is the average monthly spend among my customers significantly more or less than USD 50?
2-sample t-test
The classic example we’ve described above, where the means of two independent populations are compared to see if there is a significant difference.
Example: Do Iowan shoppers spend more per store visit than Alaskan ones?
Paired t-test
With a paired t-test, you’re testing two dependent (paired) groups to see if they are significantly different. This can be useful for “before and after” scenarios.
Example: Did the average monthly spend per customer significantly increase after I ran my last marketing campaign?
You can also choose between one-tailed or two-tailed t-tests.
- Two-tailed t-tests tell you only whether or not the difference between the means is significant.
- One-tailed t-tests tell you which mean is the greater of the two.
When should I use a t-test?
A t-test is used when there are two or fewer groups. If you have more than two groups, another option, such as ANOVA, may be a better fit.
There are a couple more conditions for using a 2 sample t-test, which are:
- Your data is expressed on an interval or ordinal scale (such as ranking or numerical scores)
- The two groups you’re comparing are independent of each other (one doesn’t affect the other). This one doesn’t apply if you’re doing a paired t-test.
- Your sample is random
- The distribution is normal (the results form a bell curve with the average in the middle)
- There is a similar amount of variance in each group (i.e. how far the data points are scattered from the average is similar for each group)
You also need to have a big enough sample size to make sure the results are sound. However, one of the benefits of the t-test is that it allows you to work with relatively small quantities of data, since it relies on the mean and variance of the sample, not the population as a whole.
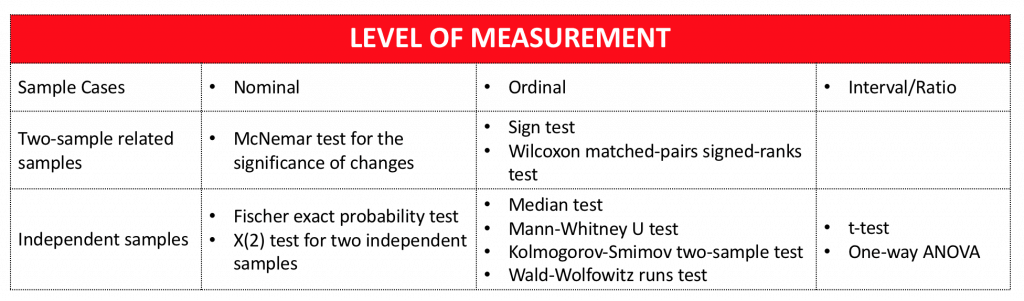
The table shows alternative statistical techniques that can be used to analyse this type of data when different levels of measurement are available.
Why is it called the Student’s t-test?
You may sometimes hear the t-test referred to as the “Student’s t-test”. Although it is regularly used by students, that’s not where the name comes from.
The t-distribution was developed by W. S. Gosset (1908), an employee of the Guinness brewery in Dublin. Gosset was not allowed to publish research findings in his own name, so he adopted the pseudonym “Student”. The t-distribution, as it was first designated, has been known under a variety of names, including the Student’s distribution and Student’s t-distribution.
How to run a t-test
In order to run a t-test, you need 5 things:
- The difference between the mean values of your data sets (known as the mean difference)
- The standard deviation for each one (that’s the amount of variance)
- The number of data values in each group
- An 𝝰 (alpha) value. This is a parameter for how much risk of getting it wrong you’re prepared to accept. An 𝝰 of 0.05 means a 5% risk.
- For manual calculations, you’ll need a critical value table, which will help you interpret your results. These are widely available online, for example from university websites.
From there, you can either use formulae to run your t-test manually (we’ve provided formulae at the end of this article), or use a stats software package such as SPSS or Minitab to compute your results.
The outputs of a t-test are:
a) t-value
This is made up of two elements: the difference between the means in your two groups, and the variance between them. These two elements are expressed as a ratio. If it’s small, there isn’t much difference between the groups. If it’s larger, there is more difference.
b) Degrees of freedom
This relates to the size of the sample and how much the values within it could vary while still maintaining the same average. Numerically, it’s the sample size minus one. You can also think of it as the number of values you’d need to find out in order to know all of the values. (The final one could be deduced by knowing the others and the total.)
Going the manual route, with these two numbers in hand, you can use your critical value table to find:
c) the p-value
This is the heart of the matter – it tells you the probability of your t-value happening by chance. The smaller the p-value, the surer you can be of the statistical significance of your results.
Stats iQ – statistically backed results in plain English
We know not everyone running survey software is a statistician, or wants to spend time learning statistical concepts and methods. That’s why we developed Stats iQ. It’s a powerful computational tool that gives you results equivalent to methods like the t-test, expressed in a few simple sentences.
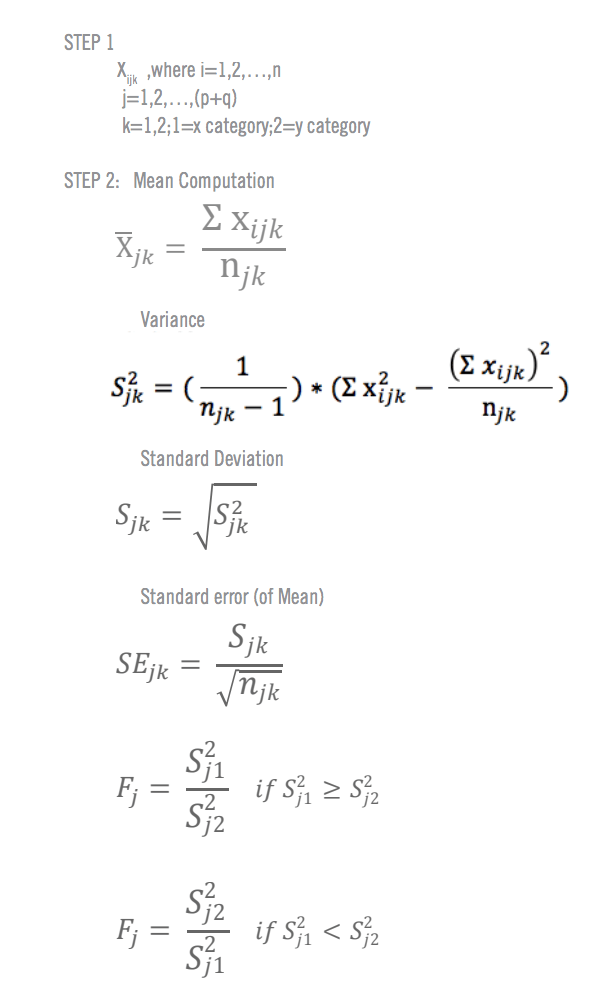
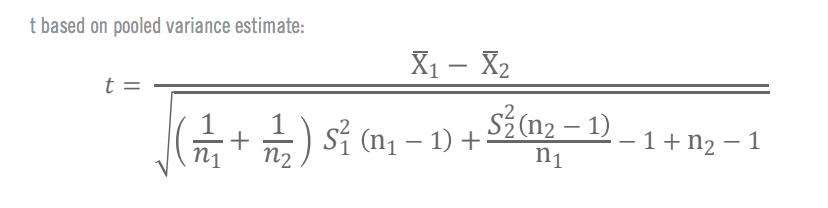
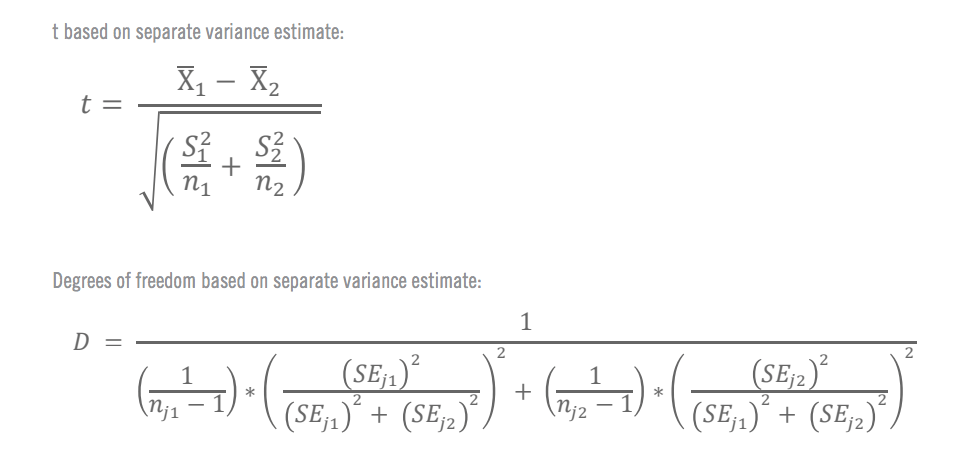
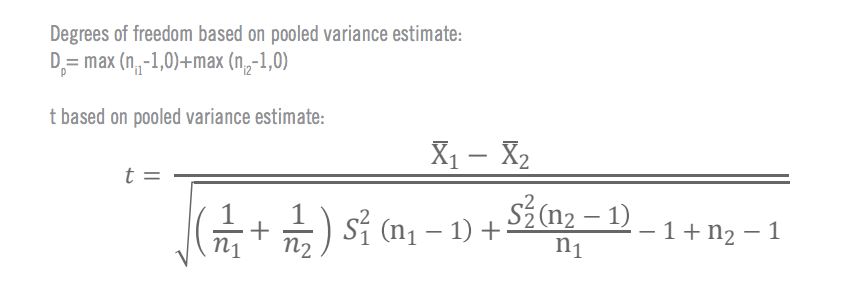
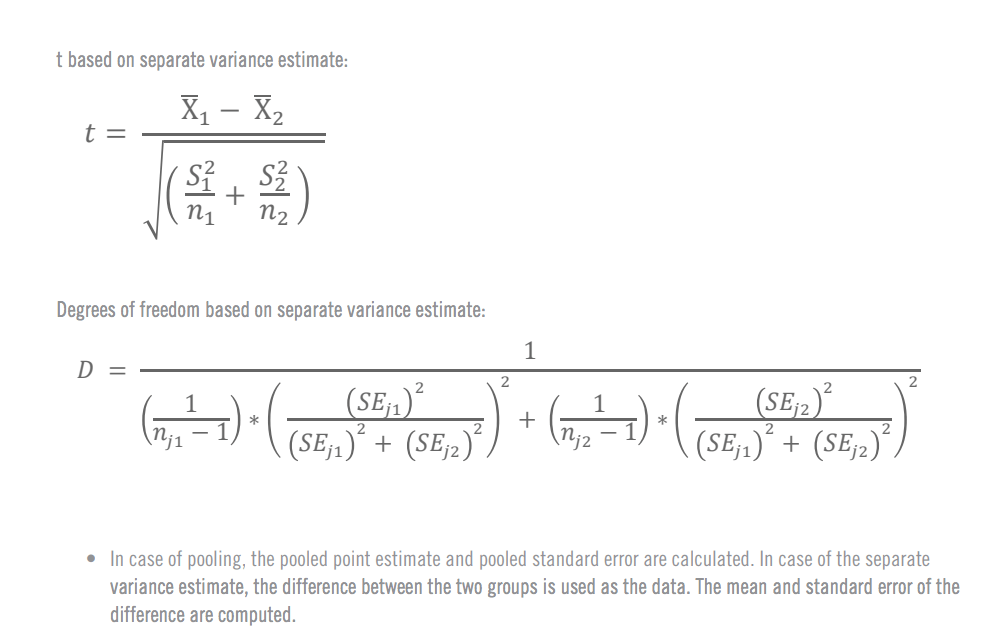
Formulae for manual t-test calculation