What is causal research?
Causal research, also known as explanatory research or causal-comparative research, identifies the extent and nature of cause-and-effect relationships between two or more variables.
It’s often used by companies to determine the impact of changes in products, features, or services process on critical company metrics. Some examples:
- How does rebranding of a product influence intent to purchase?
- How would expansion to a new market segment affect projected sales?
- What would be the impact of a price increase or decrease on customer loyalty?
To maintain the accuracy of causal research, ‘confounding variables’ or influences — e.g. those that could distort the results — are controlled. This is done either by keeping them constant in the creation of data, or by using statistical methods. These variables are identified before the start of the research experiment.
As well as the above, research teams will outline several other variables and principles in causal research:
- Independent variables
The variables that may cause direct changes in another variable. For example, the effect of truancy on a student’s grade point average. The independent variable is therefore class attendance.
- Control variables
These are the components that remain unchanged during the experiment so researchers can better understand what conditions create a cause-and-effect relationship.
- Causation
This describes the cause-and-effect relationship. When researchers find causation (or the cause), they’ve conducted all the processes necessary to prove it exists.
- Correlation
Any relationship between two variables in the experiment. It’s important to note that correlation doesn’t automatically mean causation. Researchers will typically establish correlation before proving cause-and-effect.
- Experimental design
Researchers use experimental design to define the parameters of the experiment — e.g. categorising participants into different groups.
- Dependent variables
These are measurable variables that may change or are influenced by the independent variable. For example, in an experiment about whether or not terrain influences running speed, your dependent variable is the terrain.
Why is causal research useful?
It’s useful because it enables market researchers to predict hypothetical occurrences and outcomes while improving existing strategies. This allows businesses to create plans that benefit the company. It’s also a great research method because researchers can immediately see how variables affect each other and under what circumstances.
Also, once the first experiment has been completed, researchers can use the learnings from the analysis to repeat the experiment or apply the findings to other scenarios. Because of this, it’s widely used to help understand the impact of changes in internal or commercial strategy to the business bottom line.
Some examples include:
- Understanding how overall training levels are improved by introducing new courses
- Examining which variations in wording make potential customers more interested in buying a product
- Testing a market’s response to a brand-new line of products and/or services
So, how does causal research compare and differ from other research types?
Well, there are a few research types that are used to find answers to some of the examples above:
1. Exploratory research
As its name suggests, exploratory research involves assessing a situation (or situations) where the problem isn’t clear. Through this approach, researchers can test different avenues and ideas to establish facts and gain a better understanding.
Researchers can also use it to first navigate a topic and identify which variables are important. Because no area is off-limits, the research is flexible and adapts to the investigations as it progresses.
Finally, this approach is unstructured and often involves gathering qualitative data, giving the researcher freedom to progress the research according to their thoughts and assessment. However, this may make results susceptible to researcher bias and may limit the extent to which a topic is explored.
2. Descriptive research
Descriptive research is all about describing the characteristics of the population, phenomenon or scenario studied. It focuses more on the “what” of the research subject than the “why”.
For example, a clothing brand wants to understand the fashion purchasing trends amongst buyers in California — so they conduct a demographic survey of the region, gather population data and then run descriptive research. The study will help them to uncover purchasing patterns amongst fashion buyers in California, but not necessarily why those patterns exist.
As the research happens in a natural setting, variables can cross-contaminate other variables, making it harder to isolate cause and effect relationships. Therefore, further research will be required if more causal information is needed.
How is causal research different from the other two methods above?
Well, causal research looks at what variables are involved in a problem and ‘why’ they act a certain way. As the experiment takes place in a controlled setting (thanks to controlled variables) it’s easier to identify cause-and-effect amongst variables.
Furthermore, researchers can carry out causal research at any stage in the process, though it’s usually carried out in the later stages once more is known about a particular topic or situation.
Finally, compared to the other two methods, causal research is more structured, and researchers can combine it with exploratory and descriptive research to assist with research goals.
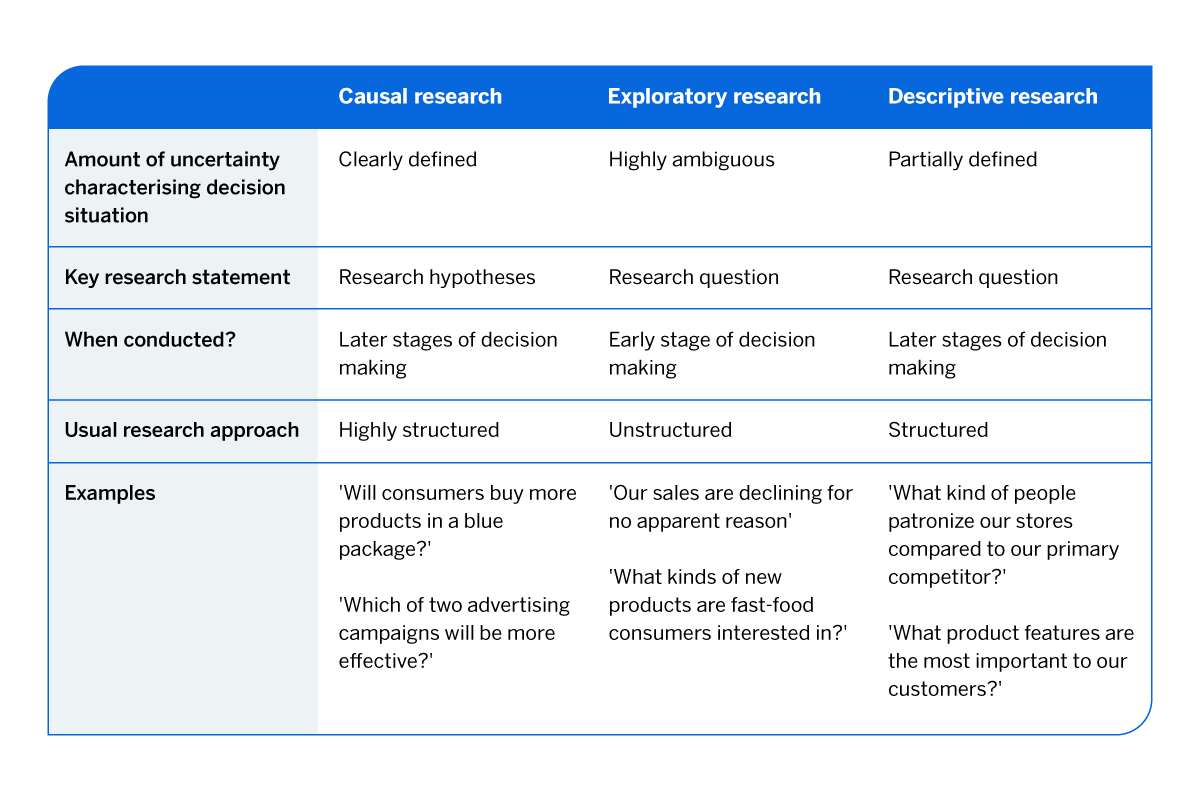
Summary of three research types
What are the advantages of causal research?
- Improve experiences
By understanding which variables have positive impacts on target variables (like sales revenue or customer loyalty), businesses can improve their processes, return on investment, and the experiences they offer customers and employees.
- Help companies improve internally
By conducting causal research, management can make informed decisions about improving their employee experience and internal operations. For example, understanding which variables led to an increase in staff turnover.
- Repeat experiments to enhance reliability and accuracy of results
When variables are identified, researchers can replicate cause-and-effect with ease, providing them with reliable data and results to draw insights from.
- Test out new theories or ideas
If causal research is able to pinpoint the exact outcome of mixing together different variables, research teams have the ability to test out ideas in the same way to create viable proof of concepts.
- Fix issues quickly
Once an undesirable effect’s cause is identified, researchers and management can take action to reduce the impact of it or remove it entirely, resulting in better outcomes.
What are the disadvantages of causal research?
- Provides information to competitors
If you plan to publish your research, it provides information about your plans to your competitors. For example, they might use your research outcomes to identify what you are up to and enter the market before you.
- Difficult to administer
Causal research is often difficult to administer because it’s not possible to control the effects of extraneous variables.
- Time and money constraints
Budgetary and time constraints can make this type of research expensive to conduct and repeat. Also, if an initial attempt doesn’t provide a cause and effect relationship, the ROI is wasted and could impact the appetite for future repeat experiments.
- Requires additional research to ensure validity
You can’t rely on just the outcomes of causal research as it’s inaccurate. It’s best to conduct other types of research alongside it to confirm its output.
- Trouble establishing cause and effect
Researchers might identify that two variables are connected, but struggle to determine which is the cause and which variable is the effect.
- Risk of contamination
There’s always the risk that people outside your market or area of study could affect the results of your research. For example, if you’re conducting a retail store study, shoppers outside your ‘test parameters’ shop at your store and skew the results.
How can you use causal research effectively?
To better highlight how you can use causal research across functions or markets, here are a few examples:
Market and advertising research
A company might want to know if their new advertising campaign or marketing campaign is having a positive impact. So, their research team can carry out a causal research project to see which variables cause a positive or negative effect on the campaign.
For example, a cold-weather apparel company in a winter ski-resort town may see an increase in sales generated after a targeted campaign to skiers. To see if one caused the other, the research team could set up a duplicate experiment to see if the same campaign would generate sales from non-skiers. If the results reduce or change, then it’s likely that the campaign had a direct effect on skiers to encourage them to purchase products.
Improving customer experiences and loyalty levels
Customers enjoy shopping with brands that align with their own values, and they’re more likely to buy and present the brand positively to other potential shoppers as a result. So, it’s in your best interest to deliver great experiences and retain your customers.
For example, the Harvard Business Review found that an increase in customer retention rates by 5% increased profits by 25% to 95%. But let’s say you want to increase your own, how can you identify which variables contribute to it?Using causal research, you can test hypotheses about which processes, strategies or changes influence customer retention. For example, is it the streamlined checkout? What about the personalised product suggestions? Or maybe it was a new solution that solved their problem? Causal research will help you find out.
Discover how to use analytics to improve customer retention.
Improving problematic employee turnover rates
If your company has a high attrition rate, causal research can help you narrow down the variables or reasons which have the greatest impact on people leaving. This allows you to prioritise your efforts on tackling the issues in the right order, for the best positive outcomes.
For example, through causal research, you might find that employee dissatisfaction due to a lack of communication and transparency from upper management leads to poor morale, which in turn influences employee retention.
To rectify the problem, you could implement a routine feedback loop or session that enables your people to talk to your company’s C-level executives so that they feel heard and understood.
How to conduct causal research first steps to getting started are:
1. Define the purpose of your research
What questions do you have? What do you expect to come out of your research? Think about which variables you need to test out the theory.
2. Pick a random sampling if participants are needed
Using a technology solution to support your sampling, like a database, can help you define who you want your target audience to be, and how random or representative they should be.
3. Set up the controlled experiment
Once you’ve defined which variables you’d like to measure to see if they interact, think about how best to set up the experiment. This could be in-person or in-house via interviews, or it could be done remotely using online surveys.
4. Carry out the experiment
Make sure to keep all irrelevant variables the same, and only change the causal variable (the one that causes the effect) to gather the correct data. Depending on your method, you could be collecting qualitative or quantitative data, so make sure you note your findings across each regularly.
5. Analyse your findings
Either manually or using technology, analyse your data to see if any trends, patterns or correlations emerge. By looking at the data, you’ll be able to see what changes you might need to do next time, or if there are questions that require further research.
6. Verify your findings
Your first attempt gives you the baseline figures to compare the new results to. You can then run another experiment to verify your findings.
7. Do follow-up or supplemental research
You can supplement your original findings by carrying out research that goes deeper into causes or explores the topic in more detail. One of the best ways to do this is to use a survey. See ‘Use surveys to help your experiment’.
Identifying causal relationships between variables
To verify if a causal relationship exists, you have to satisfy the following criteria:
- Nonspurious association
A clear correlation exists between one cause and the effect. In other words, no ‘third’ that relates to both (cause and effect) should exist.
- Temporal sequence
The cause occurs before the effect. For example, increased ad spend on product marketing would contribute to higher product sales.
- Concomitant variation
The variation between the two variables is systematic. For example, if a company doesn’t change its IT policies and technology stack, then changes in employee productivity were not caused by IT policies or technology.
How surveys help your causal research experiments?
There are some surveys that are perfect for assisting researchers with understanding cause and effect. These include:
- Employee Satisfaction Survey – An introductory employee satisfaction survey that provides you with an overview of your current employee experience.
- Manager Feedback Survey – An introductory manager feedback survey geared toward improving your skills as a leader with valuable feedback from your team.
- Net Promoter Score (NPS) Survey – Measure customer loyalty and understand how your customers feel about your product or service using one of the world’s best-recognised metrics.
- Employee Engagement Survey – An entry-level employee engagement survey that provides you with an overview of your current employee experience.
- Customer Satisfaction Survey – Evaluate how satisfied your customers are with your company, including the products and services you provide and how they are treated when they buy from you.
- Employee Exit Interview Survey – Understand why your employees are leaving and how they’ll speak about your company once they’re gone.
- Product Research Survey – Evaluate your consumers’ reaction to a new product or product feature across every stage of the product development journey.
- Brand Awareness Survey – Track the level of brand awareness in your target market, including current and potential future customers.
- Online Purchase Feedback Survey – Find out how well your online shopping experience performs against customer needs and expectations.
That covers the fundamentals of causal research and should give you a foundation for ongoing studies to assess opportunities, problems, and risks across your market, product, customer, and employee segments.
If you want to transform your research, empower your teams and get insights on tap to get ahead of the competition, maybe it’s time to leverage Qualtrics CoreXM.
Qualtrics CoreXM provides a single platform for data collection and analysis across every part of your business — from customer feedback to product concept testing. What’s more, you can integrate it with your existing tools and services thanks to a flexible API.
Qualtrics CoreXM offers you as much or as little power and complexity as you need, so whether you’re running simple surveys or more advanced forms of research, it can deliver every time.
Want to transform your market and product research?