
Understanding customer sentiment towards your brand, product or service is complex. You have to account for attitudes, opinions and perceptions, all of which influence how much a customer likes (or dislikes) what you offer.
You need a more comprehensive way to measure customer sentiment — one of the best ways to do so is with Likert scale questions.
Get started with our free survey maker tool today
Likert scale definition
A Likert scale, or rating system, is a measurement method used in research to evaluate attitudes, opinions and perceptions.
Likert scale questions are highly adaptable and can be used across a range of topics, from a customer satisfaction survey, to employment engagement surveys, to market research.
For each question or statement, subjects choose from a range of answer options. For example:
- Strongly agree
- Agree
- Neutral
- Disagree
- Strongly disagree
In studies where answer options are coded numerically, ‘Strongly agree’ would be rated 1 or 5, respectively increasing or decreasing for each response, e.g. in the above example, 5, 4, 3, 2 and 1.
Some likert scales use a seven-point likert scale with 1 being ‘Strongly Agree’ and 7 being ‘Strongly disagree’ (or reversed). In the middle, a neutral statement like ‘neither agree nor disagree’.
As well as judging positive and negative statements, a likert scale survey question can judge frequency, quality, or feelings of importance. You could use a likert scale to understand how customers view product features, or what product upgrades they’d most like to see next.
The granularity it provides over simple yes or no responses means you can uncover degrees of opinion, giving an accurate and representative understanding of feedback.
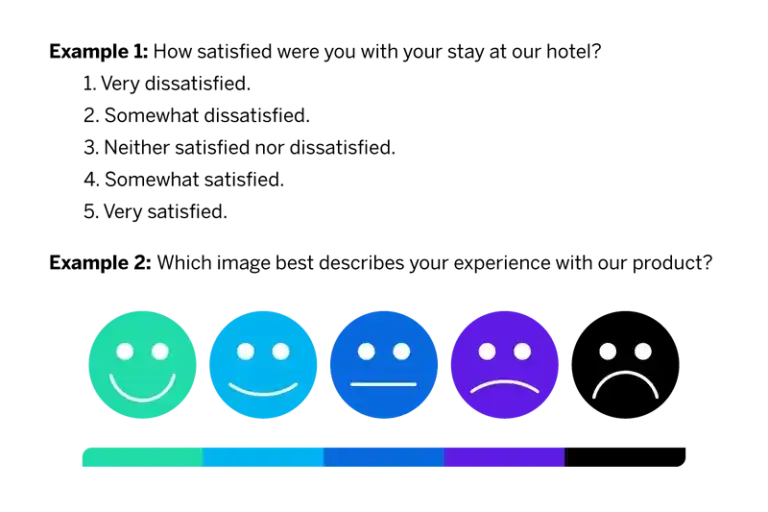
Here are a few Likert scale examples:

Benefits of using Likert scale questions
Likert scale options have several benefits, especially if you want to align data to a specific scale. Here’s a few benefits:
1. They’re easy to understand
A likert scale is easy to understand as responders simply rank their preference based on the point likert scale you choose.
For example, depending on whether they strongly agree or strongly disagree, they just select their response. This is sometimes referred to as a symmetric agree disagree scale.
A likert scale is also easy to analyse based on the responses given using a rating scale, as they can be collated numerically and filtered based on responses.
2. Ideal for single topic surveys
A likert scale question is ideal for single topic surveys, as the data can be easily analysed to judge sentiment or feelings towards particular things.
NPS surveys often use a Likert scale to judge sentiment towards customer service.
Rather than ranging from strongly agree to strongly disagree, you’d use ‘highly satisfied’ to ‘highly dissatisfied’.
You can use likert scales to judge customers’ feelings about specific parts of your service, product or brand, then follow-up with a more detailed study.
3. Likert scale questionnaires are versatile
Likert scale questionnaires help you evaluate preferences, sentiment, perspectives, behaviours or opinions.
You can implement them in a standard questionnaire, or use site intercepts on specific pages. You could have a likert scale questionnaire pop up after a webinar to get feedback on content and ideas.
4. They don’t force specific responses
Rather than extreme response categories, e.g. giving respondents only two options when discussing polarising topics, likert scales provide flexibility.
However, for difficult topics, respondents may feel they have to answer a certain way to avoid being seen as ‘extreme’. Just remind them survey responses are anonymous.
5. Likert scale questions are great for sentiment analysis
A likert scale is effective when trying to assess sentiments towards your business, brand, product or service.
Likert scale responses can judge sentiment, along with reasons for the sentiment. For example, you could collate data in a statistical analysis platform, filtering responses to see what percentage of customers are satisfied, versus those that aren’t.
You could go a step further and break the percentages down, e.g. those who are highly satisfied versus those who’re just satisfied. How can you convert those customers into true evangelists?
It’s important you only use a likert scale questionnaire when asking about a singular topic, otherwise you risk confusing respondents and damaging the legitimacy of your study.
6. They keep respondents happy
One of the pitfalls with conventional survey design is that researchers can use overly broad questions, limited to yes or no answers. These sorts of questions can frustrate respondents (as they give them no real way to provide context or accurate answers), leading to them rushing through surveys, affecting the quality of your data.
What are the limitations of Likert scales?
While likert scaling is highly effective at measuring opinions and sentiments, it does have some limitations:
1. Response choices limit real understanding
While likert scales help determine sentiment, they aren’t as effective helping understand why people feel a certain way. There’s also no interpretation of the sentiment between each choice, whether positive or negative.
For example, a respondent might ‘slightly agree’ with a statement, but why? What made them feel that way, what influences their responses? This kind of granularity can only be achieved with qualitative methods.
With this in mind, to increase the accuracy of your survey data, it’s worth running any likert-based questionnaires in conjunction with qualitative research methods.
2. Respondents might focus on one side of the sentiment
Depending how questions are written, respondents might focus on one side of the scale. If they feel their answers might somehow affect their reputation, lifestyle or portray them negatively, they’ll pick positive responses.
Also, depending on the topic, respondents may be less likely to take extreme sides of the likert scale, instead agreeing, disagreeing or remaining neutral.
3. Previous questions can influence responses
With any quantitative survey, respondents can get into a ‘rhythm’ of answering questions. The result is that they start to respond a certain way (this can be exacerbated by poor questioning, long surveys and/or flicking between themes).
When to use a Likert scale question
A likert scale question works best when assessing responses based on variables, e.g. sentiment, satisfaction, quality, importance, likelihood.
For example, you might ask a respondent: “How would you rate the quality of our products?”, and provide a response scale of:
- Excellent
- Good
- Fair
- Poor
- Very poor
Respondents get a range to which they agree or disagree, rather than a simple yes or no answer which is often insufficient. Ultimately, you’ll use likert scales to measure sentiment about something in more detail.
Get started with our free survey software today
How to write Likert scale survey questions
When writing Likert scale questions, to ensure you get accurate responses, there are several things to consider:
1. Keep them simple
The best way to get accurate results is asking simple, specific questions. Be crystal clear what you’re asking respondents to judge, whether it’s their preference, opinion or otherwise.
For example: “How satisfied are you with our service?” and providing a standard scale, from very satisfied to very dissatisfied, provides no room for confusion.
2. Make sure they’re consistent
Respondents should fully understand the likert scale they’re recording answers against, this means answers on either side of the scale should be consistent.
For example, if you say “completely agree” at one extreme, the other extreme should be “completely disagree”.
3. Use appropriate scaling – unipolar scales and bipolar scales
Any Likert scale will use either a unipolar scale or bipolar scale.
A bipolar scale should be used when you want respondents to answer with either an extremely positive or negative opinion. Sometimes, an even-point scale is used, where the middle option of “neither agree nor disagree” or “neutral” is unavailable. This is sometimes referred to as a “forced choice” method.
A unipolar scale works in the same way, but it starts from zero at one end, while an extreme is at the other. For example, if you ask how appealing your product is, your unipolar responses would go from “not appealing at all” to “extremely appealing”.
You should also aim to keep your scales odd because scales with an odd number of values ensure there’s a midpoint. Keep your scales limited to 5 or 7 points.
4. Don’t make statements, ask questions
Creating an effective likert scale means asking questions, not statements. This way, you avoid bias.
This is because people tend to automatically agree with positive or established statements, or unconsciously respond in a positive way (acquiescence bias). This can damage your study.
Asking questions rather than making statements encourages less biased responses because respondents have to think about their answers.
For example, asking “How satisfied are you with the quality of this service?” provides respondents with a chance to answer truthfully.
5. Switch your scale points
Switching your rating scale prevents respondents from falling into a rhythm and giving biased responses.
For example, if your point scale starts at 1, ‘completely agree’ and ends with 5, ‘completely disagree’, then you switch these around for a few questions so 1 is completely disagree and 5 becomes completely agree. This keeps respondents on their toes and engaged with the survey.
Here are some Likert scale examples:
How to analyse likert scale survey data
Unlike many survey types, you can’t use the ‘mean’ as a measure of tendency because the mean response to likert survey questions has no meaning. In other words, understanding the average of those who strongly agree or disagree tells you nothing.
Instead, when analysing likert scale data, measure the most frequent response to understand the overall sentiment of respondents.
For example, 87% ‘strongly agree’ that you offer a good service.
You can also compare the percentages for each response to see where respondents ultimately fall.
This is incredibly useful when you want to nurture customers — perhaps there’s something you can do for those who answered ‘agree’ rather than ‘strongly agree’.
The easiest way to present likert scale survey results is using a simple bar or pie chart showing the distribution of response types or answer options.
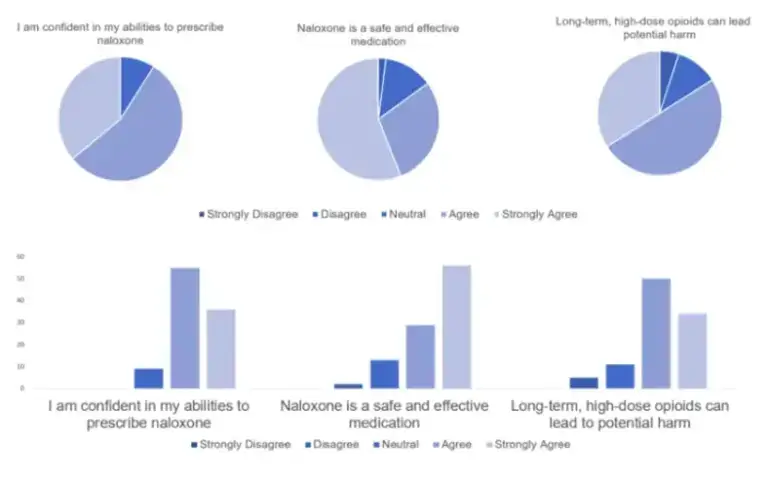
Image Source: mbounthavong
You could also visualise your responses using a diverging stacked bar chart:
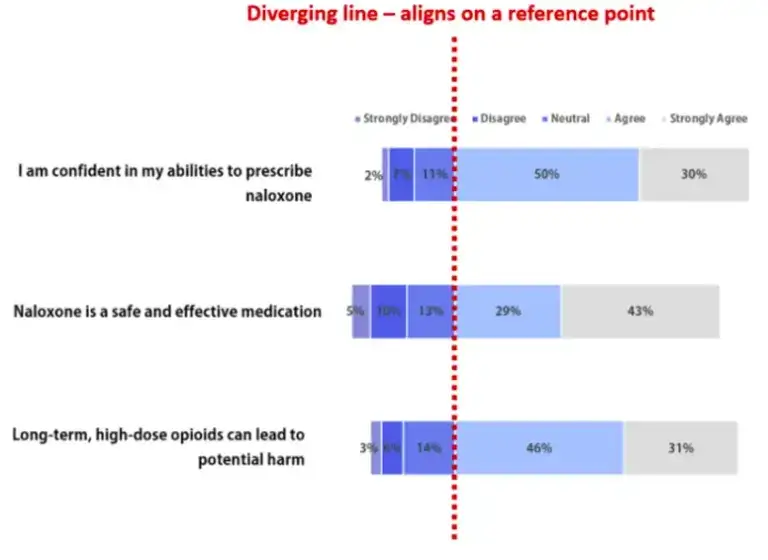
Image Source: mbounthavong
Likert scale questions
One of the biggest benefits of using likert scale survey questions is they can be used for a variety of topics to gather quantitative data
Below are some Likert scale examples to give you an idea when you can use them in market research, and what kind of insights you can generate using Likert scale surveys.
Customer satisfaction surveys
How do you rate the quality of service you received?
- Exceptional
- Excellent
- Very good
- Good
- Fair
- Poor
- Very poor
This kind of Likert scale question can benefit from further qualitative questions to gather valuable feedback on why survey respondents feel the way they do.
Employee engagement survey
How satisfied do you feel in your current position?
- Extremely happy
- Happy
- Somewhat happy
- Neither happy nor unhappy
- Somewhat unhappy
- Unhappy
- Extremely unhappy
Education engagement survey
How would you rate your satisfaction with your child’s education?
- Completely satisfied
- Satisfied
- Moderately satisfied
- Neither satisfied nor unsatisfied
- Unsatisfied
- Moderately unsatisfied
- Completely unsatisfied
Marketing engagement survey
A business’ social responsibility score is more important than price
- Completely agree
- Somewhat agree
- Neither agree nor disagree
- Somewhat disagree
- Completely disagree
Go beyond standard Likert scale questions with Qualtrics
Understanding engagement or sentiment towards your products or services is an essential part of collecting data to improve your business. And with Qualtrics CoreXM — you can go even further.
Designed to empower everyone to gather experience insights and take action, Qualtrics XM for Strategy & Research is an all-in-one solution to carry out customer, product, marketing and brand research, and then implement effective strategies.
From customer satisfaction surveys and event feedback to product concept testing and simple polls, create and deploy the research projects you need to enhance every aspect of your business.
Listen to everyone wherever they are providing feedback — whether directly in surveys and chatbot windows or indirectly via online reviews. Capture experience data across more than 125 resources and use that data for more targeted research and highly personalised experiences.
Use advanced analytics to interpret the feedback data and then automatically alert the right people to tell them what actions to take. All in real-time, with no legwork required. It’s time to go from measuring to acting and start closing experience gaps across your business.