
Results-Reports Basic Overview
What's on this page
Qtip: There is a new version of Results available. To opt in to the new Results Dashboards, navigate to the Results tab and click Try it now.

About Results-Reports
Results-reports are designed to give you a quick and simple visualization of your survey results. Each question in your survey will have a visualization pre-made for it. However, there are many customization options available to you to help you build a report to fit your needs.
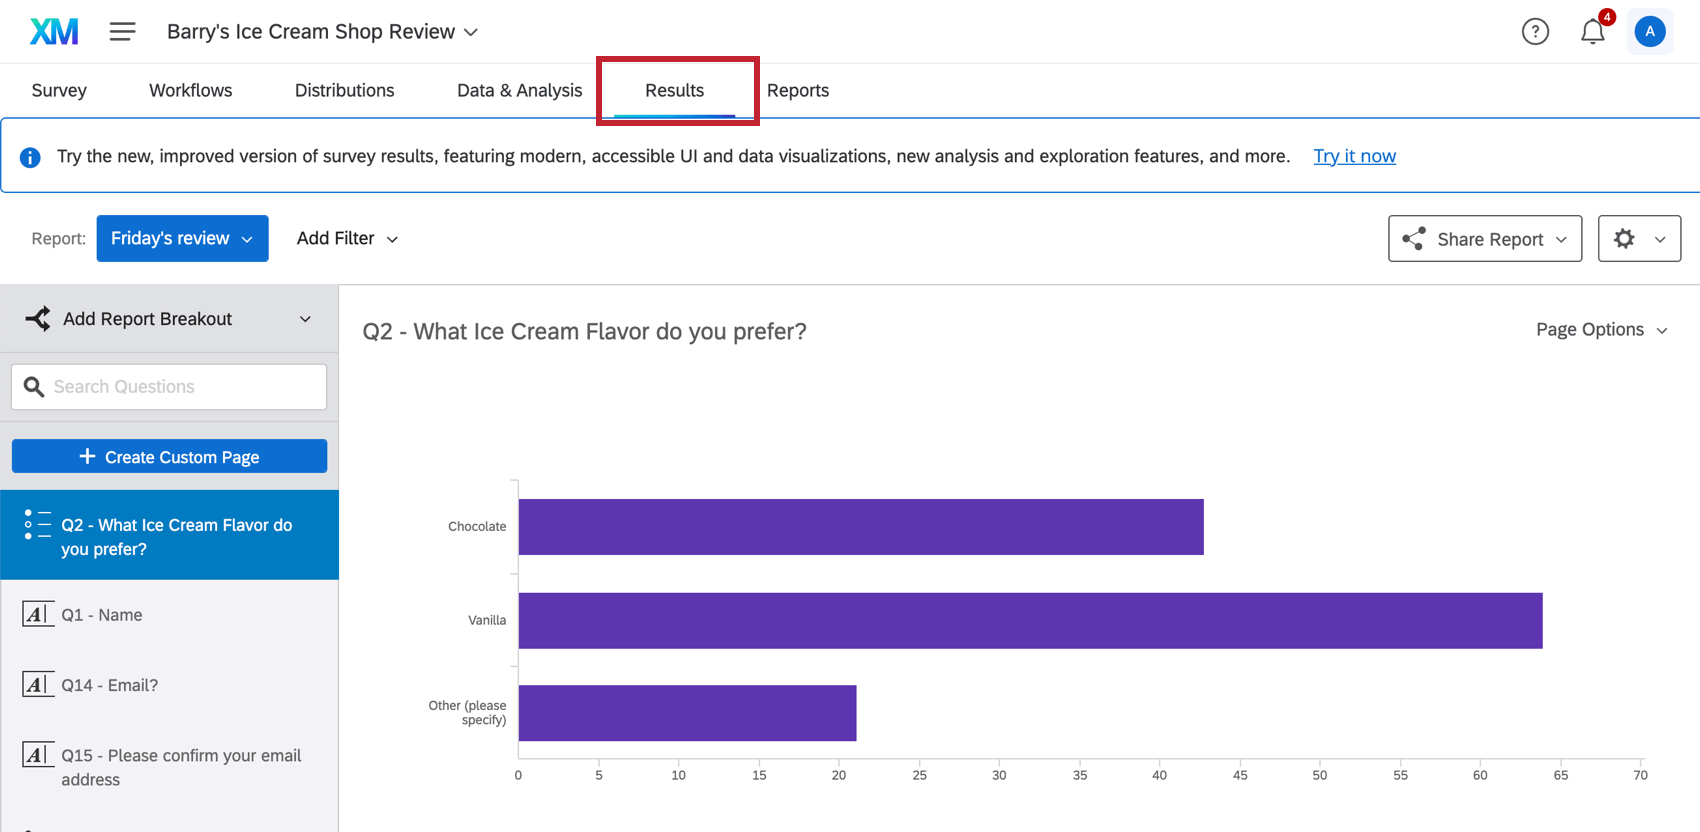
To access results-reports, click Results in your survey project.

Types of Projects
Legacy Results are available in a few different types of project. This includes:
- Survey projects Qtip: This includes survey projects within programs, such as surveys within Brand programs.

- Conjoint and MaxDiff projects Qtip: Read more about Results functionality specific to Conjoints and MaxDiff.
- Many guided XM Solutions
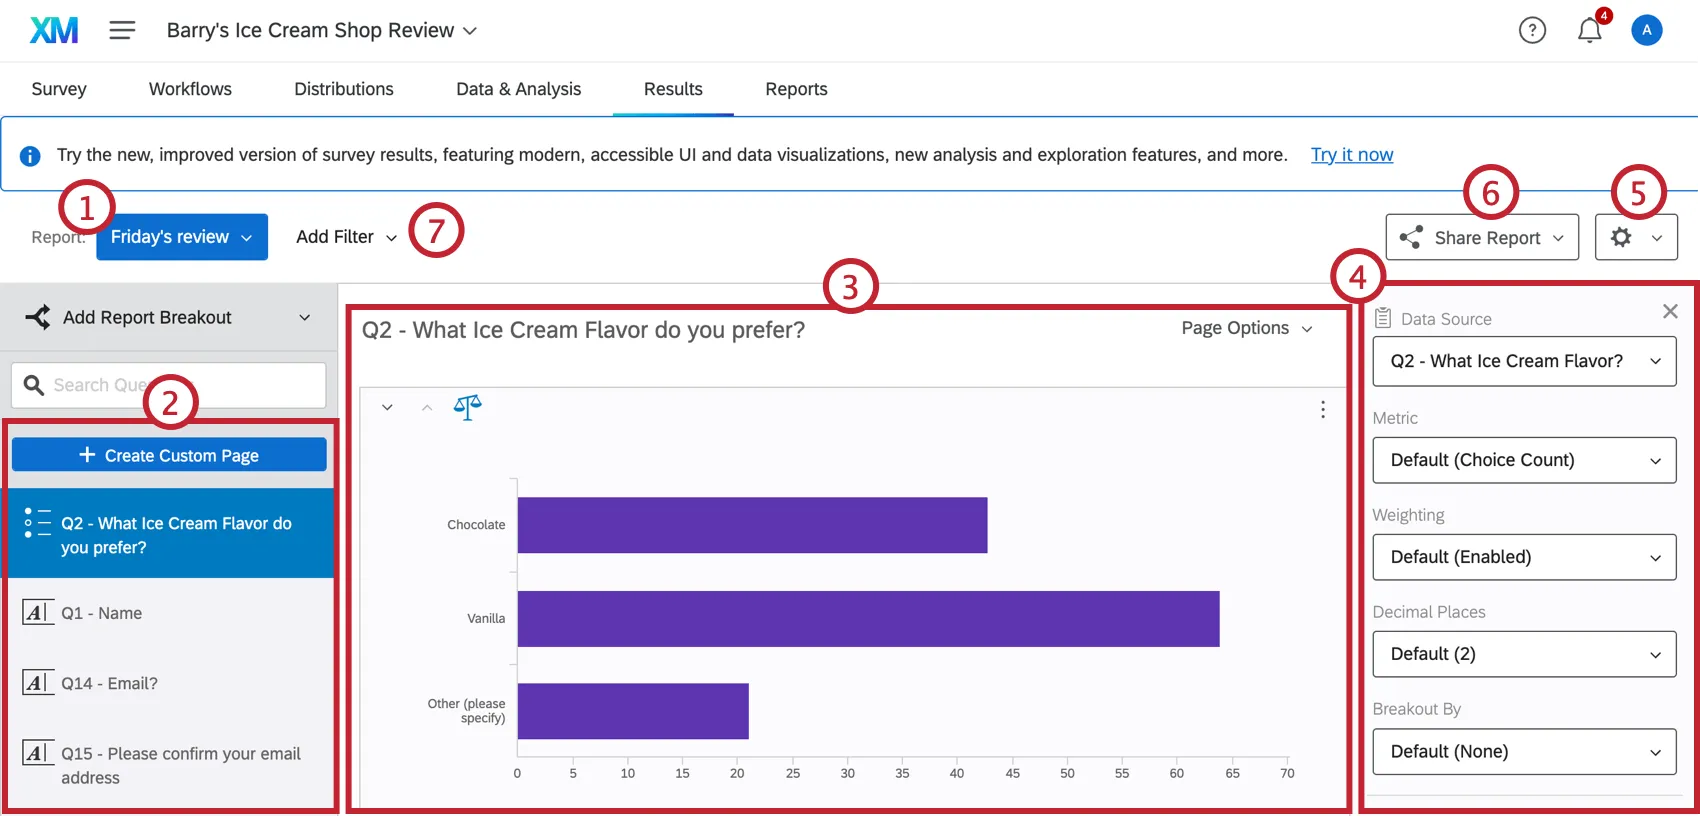
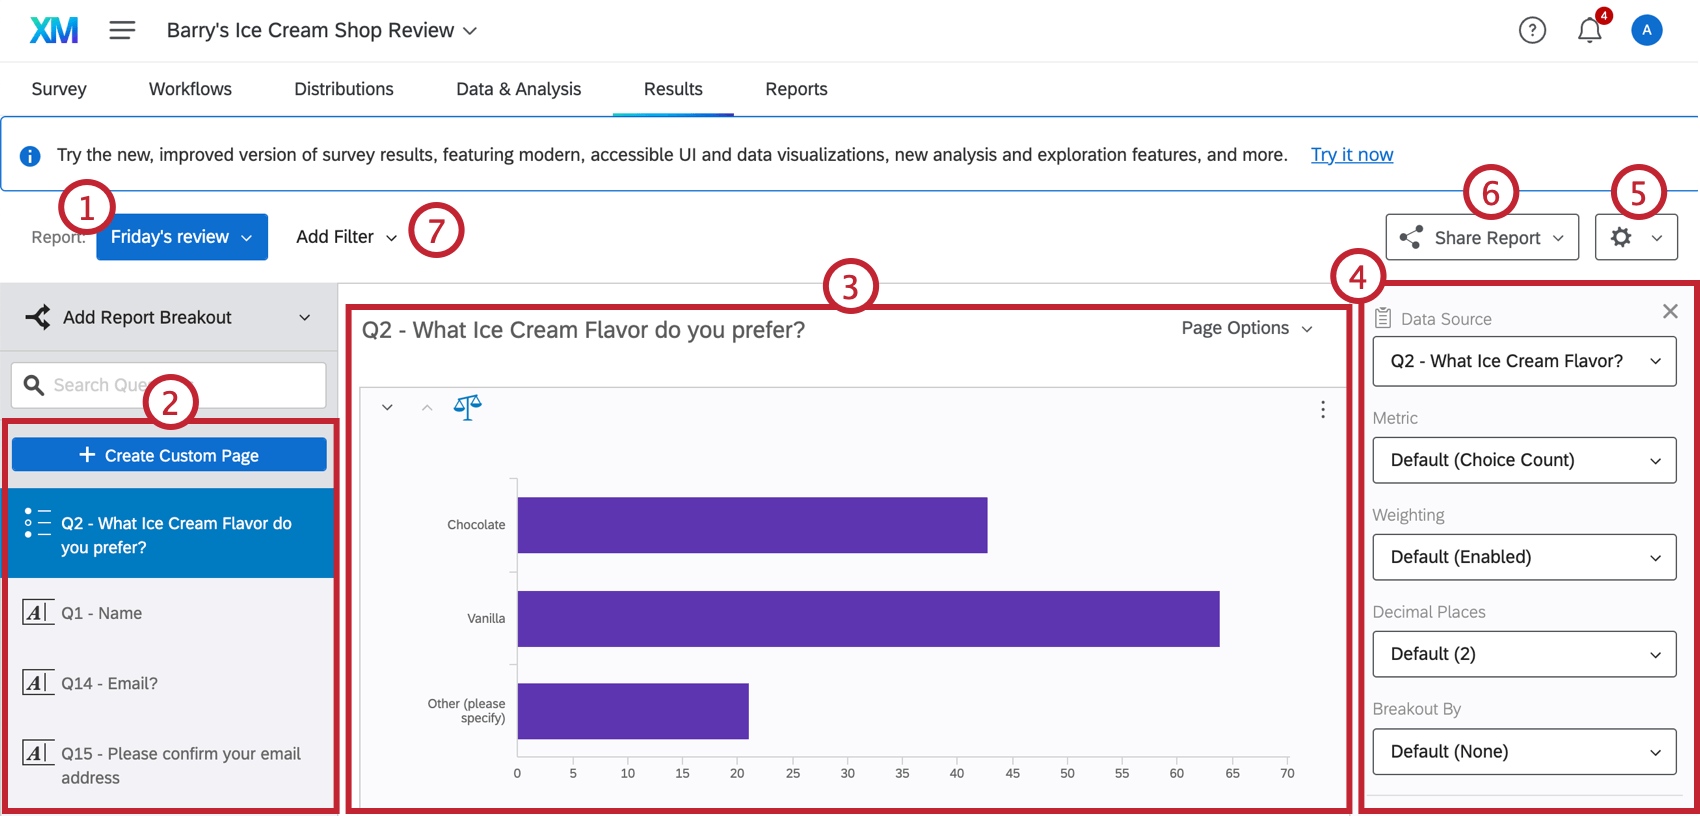
Navigating Results-Reports
The main features of results-reports include:
Creating and Copying Results-Reports
If you want to create a new report, you can make a copy of your existing report or start from scratch.
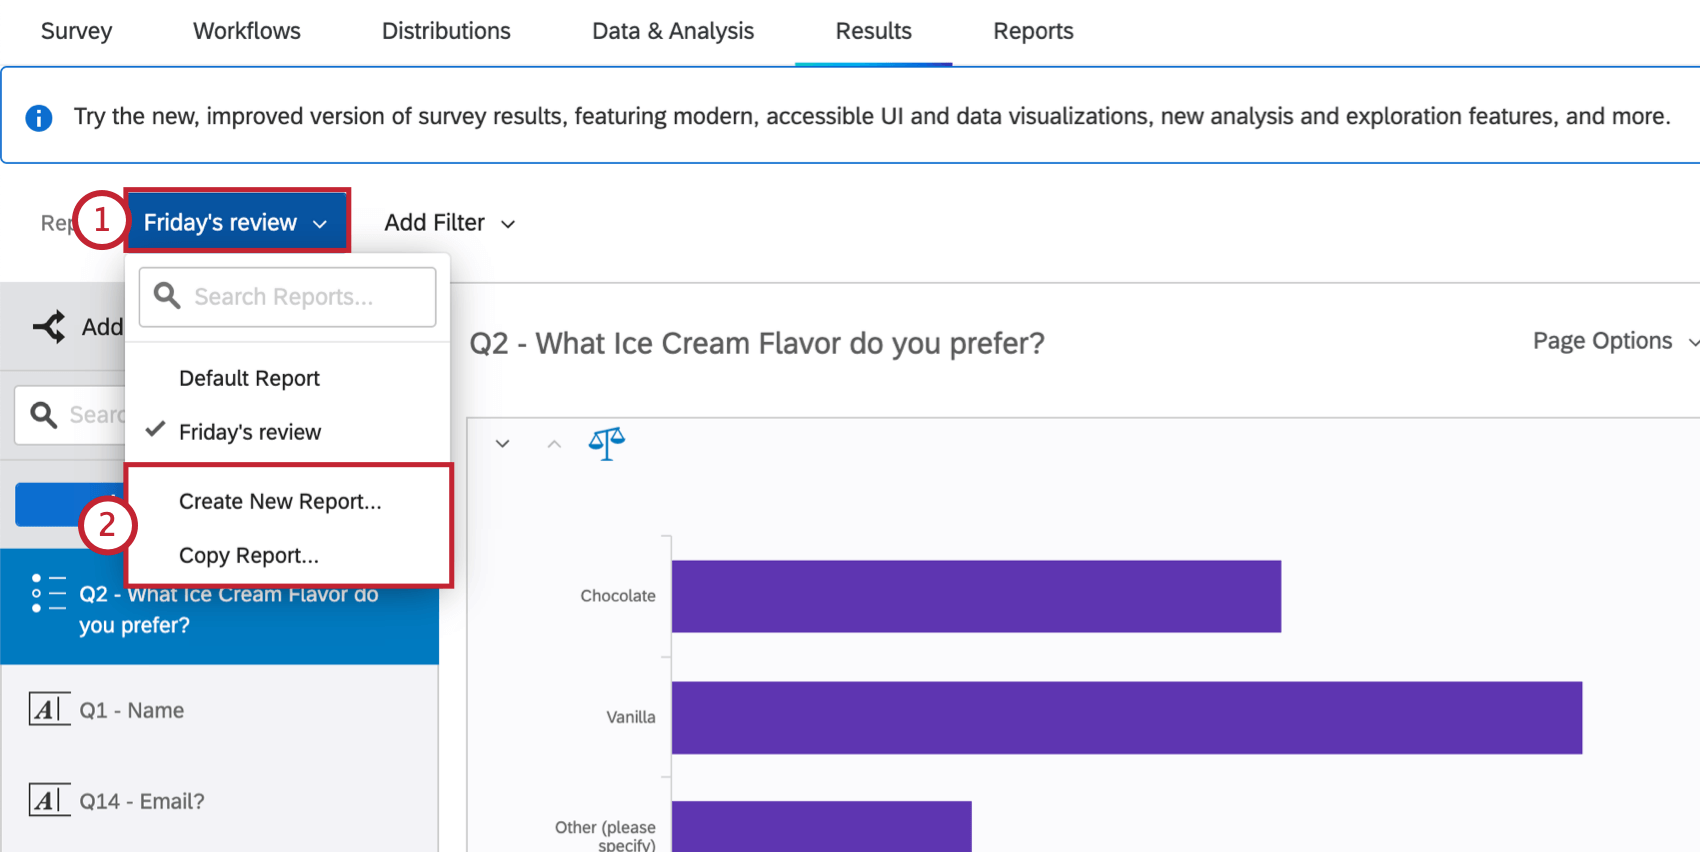
- Create New Report: Generates a new default report.
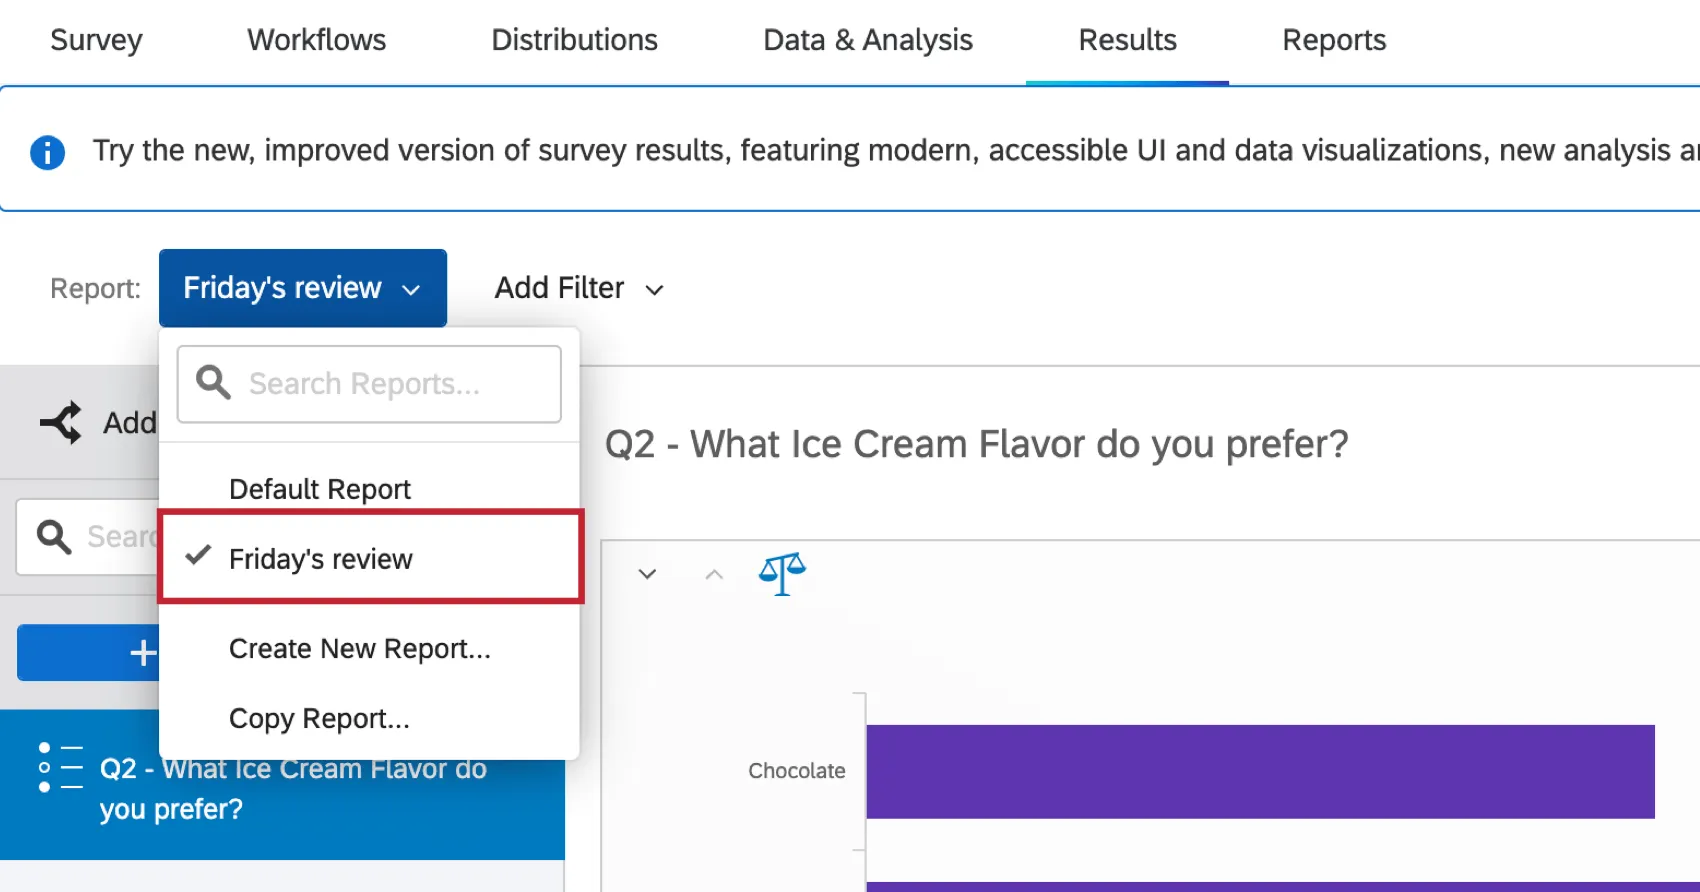
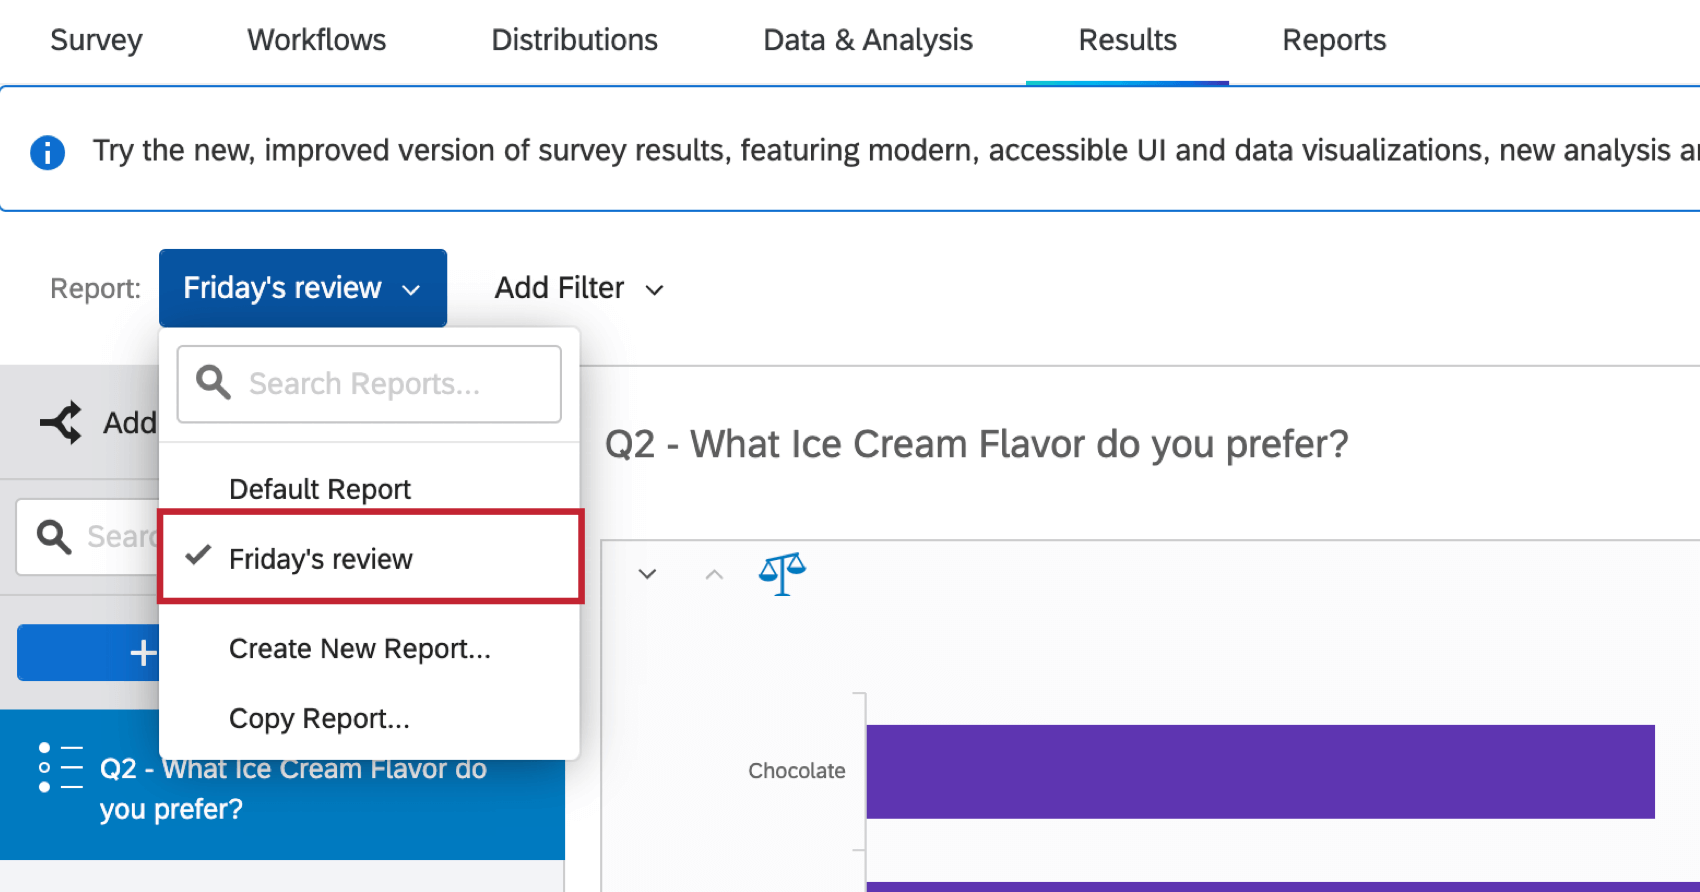
- Copy Report: Generates a new report using your active report as a template. You can figure out which report is the active report by looking at which report has a checkmark next to its name in the dropdown menu.
Editing Results-Reports Pages & Adding Visualizations
Visit the linked pages to learn more about editing results-reports pages.
- Custom vs. Question Pages: This page describes the difference between default (i.e. question) pages and custom pages.
- Creating Custom Pages: Create new pages in your report where you have full control over the page content.
- Page Options: The page options that are used to export, move, hide, and delete pages.
- Adding Visualizations: Add visualizations to your results-reports pages.
- Adding Images and Text: Add images and text to your results-reports pages.
- Moving and Managing Pages: Rearrange and hide the pages and visualizations in your results-reports.
Using Results-Reports Filters
You can filter your entire results-report to remove data you don’t need. For example, in the below image, we filter our results to show NPS Detractors since we are interested in analyzing only their data.
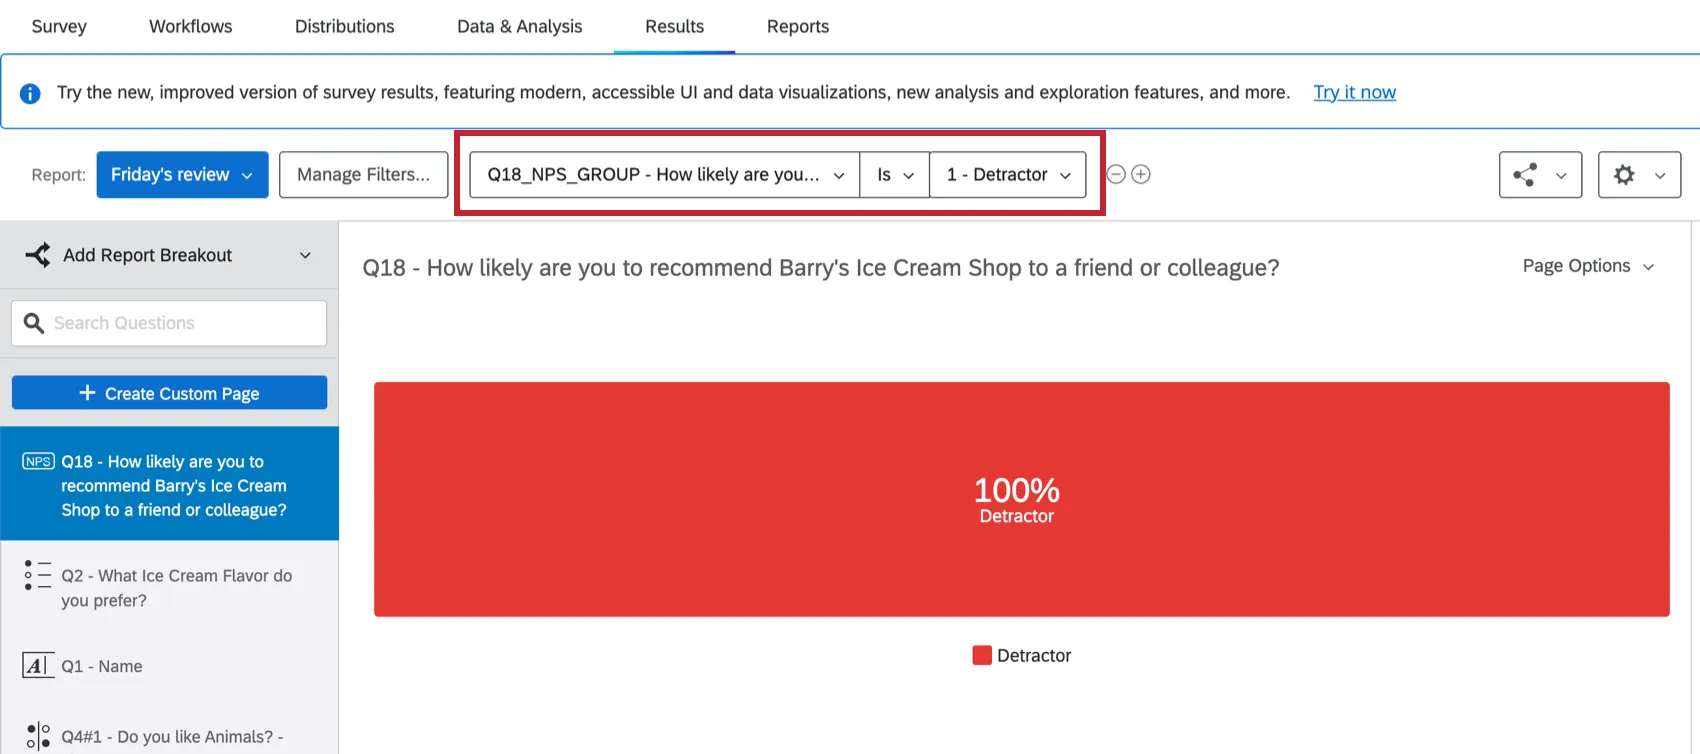
For help with results-reports filters, see Filtering Results-Reports. This page contains all the information you will need to filter your results-report, including how to add a filter, building filter logic, and saving and reusing filters.
Sharing Results-Reports
There are many ways to share a Results-Report. To share your results-report, click Share Report in the top right and then select how you want to share your report.
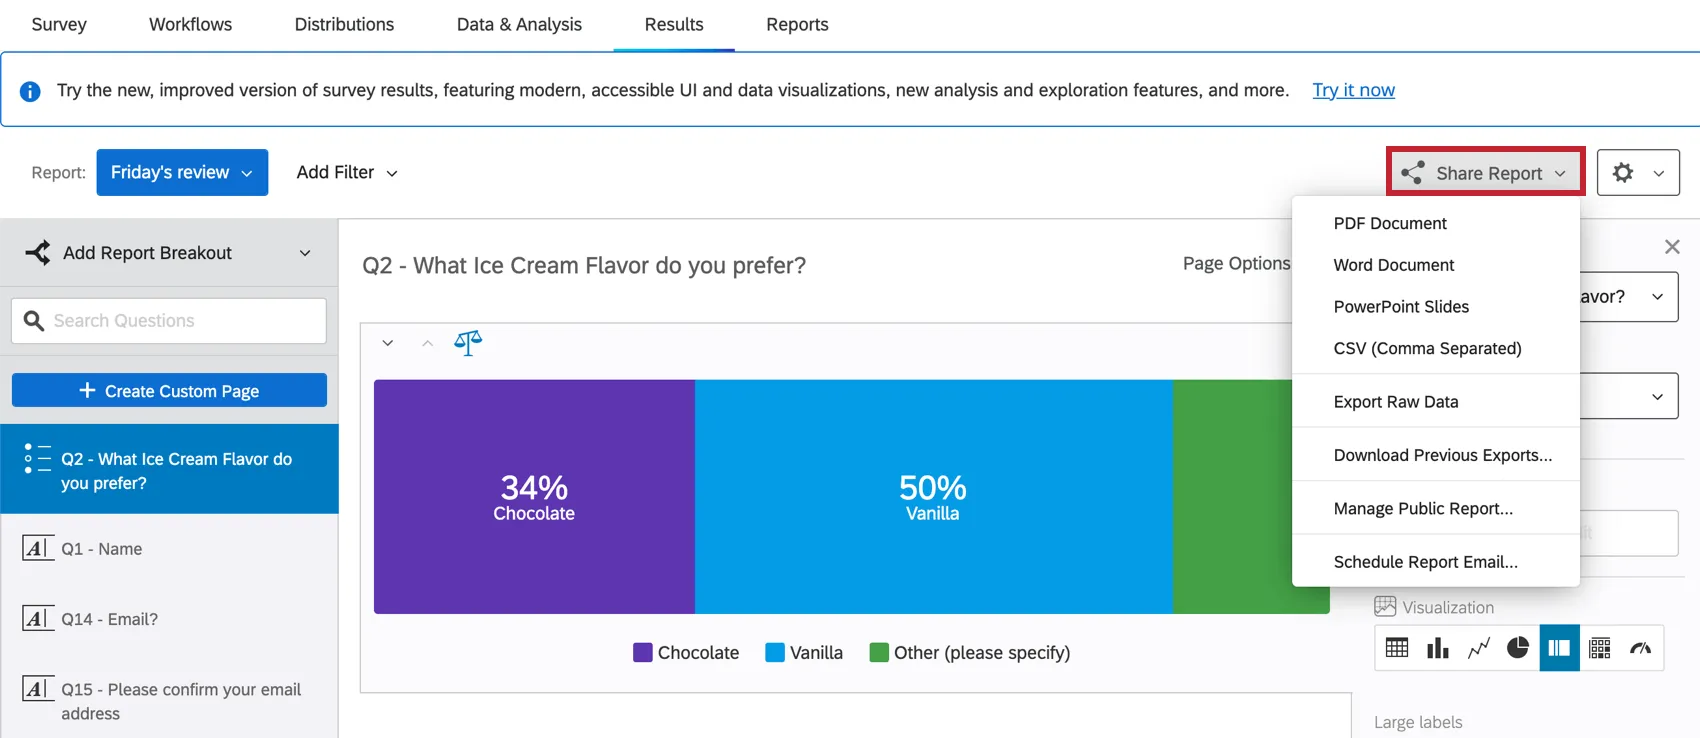
The methods for sharing your report include:
- Sharing a Project: Share a project (survey) with a colleague’s Qualtrics account and grant access to your results-reports. Visit the linked page for more information. Note, this sharing option is found on the projects page, not within the results-report.
- Exporting Results-Reports: Generate and share a digital copy of your report in a PDF, Word, PowerPoint, or CSV format. See the Exporting Results-Reports support page for more details.
- Managing Public Results-Reports: Create a version of your report that is available via a public web link. You can lock your report with an access code. See the Managing Public Results-Reports support page for more details.
- Scheduling Results-Report Emails: Send your results-report as an email attachment. See the Scheduling Results-Report Emails support page for more details.
Using Results-Reports Breakouts
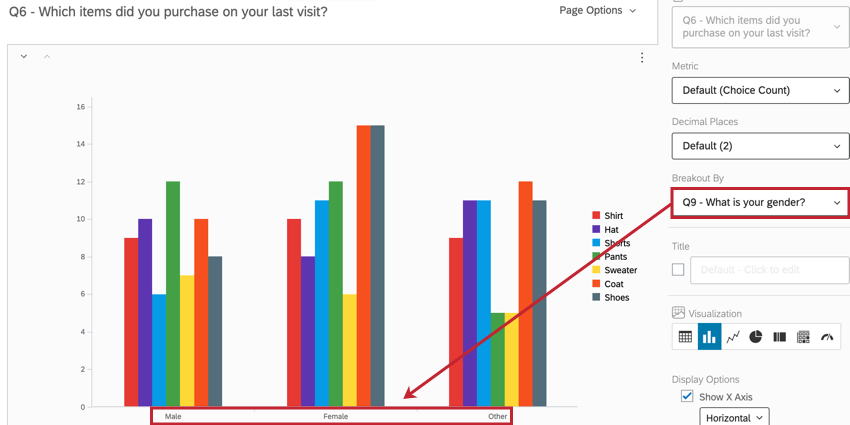
Breakouts allow you to display data from different samples side by side. In the below example, we asked survey respondents to indicate the last clothing item they purchased. We then added a breakout for gender to see how people of different genders responded. By using breakouts, we can see how different demographics answer the same question.
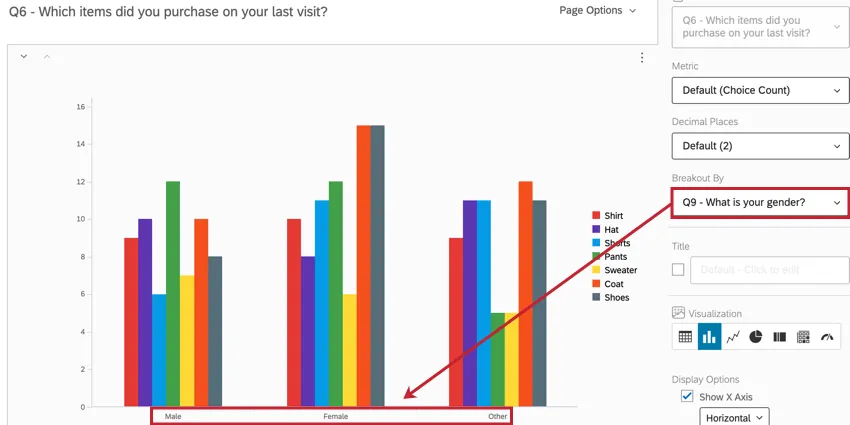
For an in-depth guide on using breakouts, see Results-Reports Breakouts.
Editing Report Settings
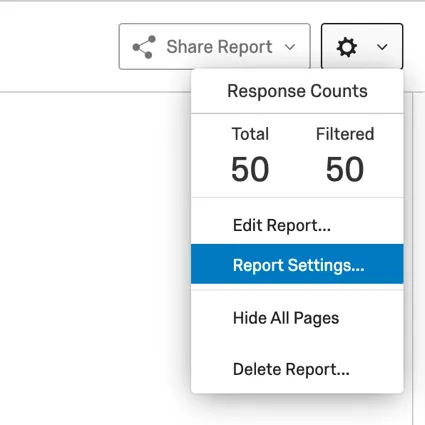
To access your global results-reports setting, click the Settings (gear) icon and then select Report Settings.
Your global results-reports settings control the following aspects of your report:
- Choose what metric is selected by default in visualizations.
- Choose the default number of decimal places in visualizations.
- Choose the default color palette used in visualizations. You may choose from a library of prebuilt palettes, or build your own.
- Determine the default font and spacing for any text in your report.
- Determine what visualizations are included in your report by default.
- Enable response weighting in your report.
- Determine other visualization customization options, such as what totals are included in tables.
You can save your settings so that you can easily reuse them in a future report. For more information about every option in global settings, see Global Results-Reports Settings.
FAQs
Why am I receiving the error message "Data source misconfigured for this visualization"?
Why am I receiving the error message "Data source misconfigured for this visualization"?
- The question was originally a different question type. Click on the visualization. If this doesn't resolve the issue, re-select the data source (e.g., the question linked to the visualization).
- A breakout was applied that the visualization did not accept. Change the visualization to a different type, and then change it back to the original visualization type.
- An incomplete results filter can cause this. Removing or finishing the filter can solve the issue. See Filtering Results for more details.
Why is my contact list information not appearing in any of my reports?
Why is my contact list information not appearing in any of my reports?
If you forgot to put Embedded Data in the Survey Flow, you can add it to your data retroactively, so long as there are values in the contact list. See the Embedded Data support page for further instruction.
Note that if the contact list information you’re trying to download was not included in the contact list at the time the members took the survey, retroactively adding the Embedded Data fields to the Survey Flow will not add that information to the reports later.
I want to use a certain visualization for my data, but that visualization option isn’t appearing when I choose my data source. Why?
I want to use a certain visualization for my data, but that visualization option isn’t appearing when I choose my data source. Why?
Some question types offer more than one data source (i.e., more than one way to represent their data), so you might be able to pick an alternative data source and use the desired visualization.
Can I change the default settings on a report instead of editing each visualization one at a time?
Can I change the default settings on a report instead of editing each visualization one at a time?
You can learn how to change your default settings on Results-Reports on the Global Results-Reports Settings support page, and you can learn how to change the default settings for Advanced-Reports on the Global Advanced-Reports Settings support page.
My visualizations from different questions are all on different pages in my Results-Report. Can I put them on the same page?
My visualizations from different questions are all on different pages in my Results-Report. Can I put them on the same page?
Note that in Advanced-Reports, you customize every page.
Can I add other columns of information to my visualizations?
Can I add other columns of information to my visualizations?
In the visualization editing pane for either visualization, you will be able to select Add Additional Columns.
No other visualization can add additional columns like this.
Can I break down the information in a visualization into groups based on other data?
Can I break down the information in a visualization into groups based on other data?
See Breakouts for Advanced-Reports or Breakouts for Results-Reports, depending on the reporting you are using.
Can I hide pages in my Results-Report without deleting them so I can use them later?
Can I hide pages in my Results-Report without deleting them so I can use them later?
How do I rename my report?
How do I rename my report?
- Results-Reports: Click the gear in the upper-right and select Edit Report. A new window will open with a field for the name.
- Advanced-Reports: Go to File and choose Rename.
I don't have the tab described on this page! What do I do?
I don't have the tab described on this page! What do I do?
That's great! Thank you for your feedback!
Thank you for your feedback!