What is ANOVA?
ANOVA, or Analysis of Variance, is a test used to determine differences between research results from three or more unrelated samples or groups.
You might use ANOVA when you want to test a particular hypothesis between groups, determining – in using one-way ANOVA – the relationship between an independent variable and one quantitative dependent variable.
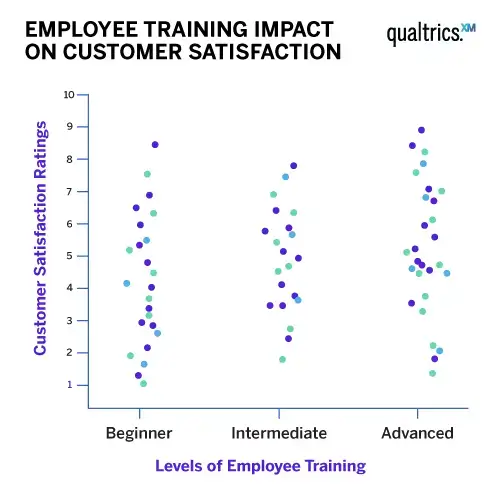
An example could be examining how the level of employee training impacts customer satisfaction ratings. Here the independent variable is the level of employee training; the quantitative dependent variable is customer satisfaction.
You would use ANOVA to help you understand how employees of different training levels – for example, beginner, intermediate and advanced – with the null hypothesis for the test being that they have the same customer satisfaction ratings. If there is a statistically significant result, it means the null hypothesis is rejected – meaning the employee groups performed differently.
The key word in ‘Analysis of Variance’ is the last one. ‘Variance’ represents the degree to which numerical values of a particular variable deviate from its overall mean. You could think of the dispersion of those values plotted on a graph, with the average being at the centre of that graph. The variance provides a measure of how scattered the data points are from this central value.
Free eBook: The guide to modern agile research
While a one-way ANOVA is the most basic form, other variations exist that can be used in different situations:
- Two-way ANOVA
- Factorial ANOVA
- Welch’s F-test ANOVA
- Ranked ANOVA
- Games-Howell pairwise test
How does ANOVA work?
ANOVA works by analysing the levels of variance within more than two groups through samples taken from each of them.
In an ANOVA test you first examine the variance within each group defined by the independent variable – this variance is calculated using the values of the dependent variable within each of these groups. Then, you compare the variance within each group to the overall variance of the group means.
In general terms, a large difference in means combined with small variances within the groups signifies a greater difference between the groups. Here the independent variable significantly varies by dependent variable, and the null hypothesis is rejected.
On the flip side, a small difference in means combined with large variances in the data suggests less variance between the groups. In this case, the independent variable does not significantly vary by the dependent variable, and the null hypothesis is accepted.

Types of ANOVA
There are various approaches to using ANOVA for your data analysis. Here’s an introduction to some of the most common ones.
One-way ANOVA
One-way ANOVA is its most simple form – testing differences between three or more groups based on one independent variable. For example, comparing the sales performance of different stores in a retail chain.
Two-way ANOVA
Used when there are two independent variables, two-way ANOVA allows for the evaluation of the individual and joint effects of the variables. For example, it could be used to understand the impact of both advertising spend and product placement on sales revenue.
This is defined by how many independent variables are included in the ANOVA test. One-way means the analysis of variance has one independent variable, two-way means the test has two independent variables.
Factorial ANOVA
This variant of ANOVA is used when there are more than two independent variables. For example, a business might use a factorial ANOVA to examine the combined effects of age, income and education level on consumer purchasing habits.
Welch’s F-test ANOVA
This type of ANOVA is used when the assumption of equal variances is not met. For example, a company might use Welch’s F-test to compare the job satisfaction levels of employees in different departments, where each department has a different variance in job satisfaction scores.
Stats iQ from Qualtrics recommends an unranked Welch’s F test if two assumptions about the data hold:
- The sample size is greater than 10 times the number of groups in the calculation (groups with only one value are excluded)
- There are few or no outliers in the continuous/discrete data
Ranked ANOVA
This version of ANOVA is used with ordinal data, or when the assumptions are violated. For instance, a business might use it to compare customer satisfaction ratings (e.g., from ‘very unsatisfied’ to ‘very satisfied’) across different product lines.
Stats iQ rank-transforms the data (replaces values with their rank ordering) and then runs a ranked ANOVA on that transformed data.
Games-Howell pairwise test
This is essentially a t-test but is used when the assumption of homogeneity of variances has been violated, which means different groups have different variances. For example, a company might use the Games-Howell test to compare the effectiveness of different training methods on employee performance, where the variances in performance are different between the methods.
Stats iQ runs Games-Howell tests regardless of the outcome of the ANOVA test (as per Zimmerman, 2010). Stats iQ shows unranked or ranked Games-Howell pairwise tests based on the same criteria as those used for ranked vs. unranked ANOVA, so if you see ‘Ranked ANOVA’ in the advanced output, the pairwise tests will also be ranked.
Additionally, while Stats iQ does not show results of pairwise tests for any group with less than four values, those groups are included in calculating the degrees of freedom for the other pairwise tests.
ANOVA assumptions
Like other types of statistical methods, ANOVA compares the means of different groups and shows you if there are any statistical differences between the means. ANOVA is classified as an omnibus test statistic. This means that it can’t tell you which specific groups were statistically significantly different from each other, only that at least two of the groups were.
ANOVA relies on three main assumptions that must be met for the test results to be valid.
Normality
The first assumption is that the groups each fall into what is called a normal distribution. This means that the groups should have a bell-curve distribution with few or no outliers.
Homogeneity of variance
Also known as homoscedasticity, this means that the variances between each group are the same.
Independence
The final assumption is that each value is independent from each other. This means, for example, that unlike a conjoint analysis the same person shouldn’t be measured multiple times.
Why use ANOVA?
ANOVA is a versatile and powerful statistical technique, and the essential tool when researching multiple groups or categories. The one-way ANOVA can help you know whether or not there are significant differences between the means of your independent variable.
Why is that useful? Because when you understand how the means of each group in your independent variable differ, you can begin to understand which of them has a connection to your dependent variable (such as landing page clicks) and begin to learn what is driving that behaviour.
You could also repeat this test multiple times to see whether or not a single independent variable (such as temperature) affects multiple dependent variables (such as purchase rates of suncream, attendance at outdoor venues and likelihood to hold a cook-out) and if so, which ones.
Benefits of ANOVA for businesses
ANOVA has a wide range of applications in research across numerous fields, from social sciences to medicine, and industrial research to marketing.
Its unique benefits make ANOVA particularly valuable to businesses. Here are its three main use cases in the business world.
Informing decision making
Businesses can use ANOVA to inform decisions about product development, marketing strategies and more.
Using resources
By identifying which variables have the most significant impact on a particular outcome, businesses can better allocate resources to those areas.
Understanding different variables
ANOVA doesn’t just tell you that differences exist between groups – it can also reveal the interaction between different variables. This can help businesses better understand complex relationships and dynamics, leading to more effective interventions and strategies.
ROI from ANOVA
The Return on Investment (ROI) from using ANOVA can be significant.
It helps businesses to focus their resources on the most effective strategies by helping them make more informed decisions – potentially leading to increased efficiency, productivity and even profitability.
For instance, if ANOVA shows that one marketing strategy is significantly more effective than others, resources can be shifted to that strategy, potentially leading to increased sales and revenue.
ANOVA examples: When might you use it?
Here’s how different types of ANOVA test can be used to solve different questions a business could face.
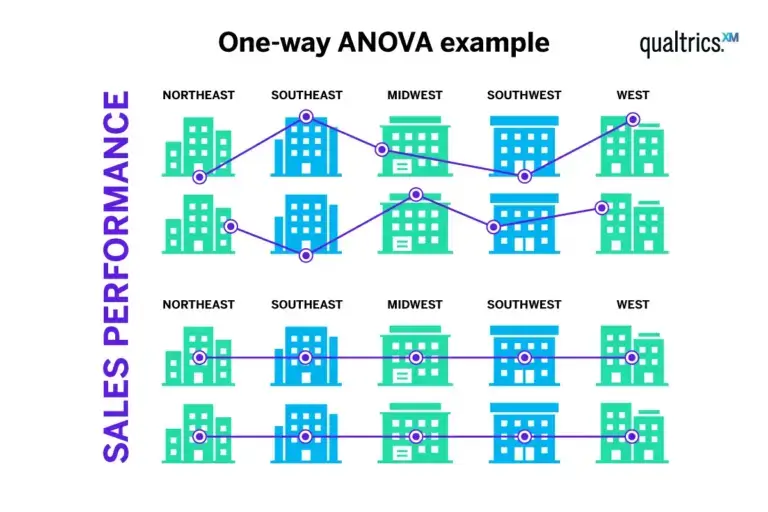
Does the geographical region have an effect on the sales performance of a retail chain?
A one-way ANOVA can be used to answer this question, as you have one independent variable (region) and one dependent variable (sales performance).
You’ll need to collect data for different geographical regions where your retail chain operates – for example, the USA’s Northeast, Southeast, Midwest, Southwest and West regions. A one-way ANOVA can then assess the effect of these regions on your dependent variable (sales performance) and determine whether there is a significant difference in sales performance across these regions.
Does the time of year and type of product have an effect on the sales of a company?
To answer this question, a two-way ANOVA can be used, as you have two independent variables (time of year and product type) and one dependent variable (sales).
You’ll need to collect data for different times of the year (such as Q1, Q2, Q3, Q4) and for the different types of products your company sells (like electronics, clothing, home goods, etc.). A two-way ANOVA can then simultaneously assess the effect of these variables on your dependent variable (sales) and determine whether there is an interaction effect between the time of the year and the type of product on the company’s sales.
Do age, sex or income have an effect on how much someone spends in your store per month?
To answer this question, a factorial ANOVA can be used, since you have three independent variables and one dependent variable.
You’ll need to collect data for different age groups (such as 0-20, 21-40, 41-70, 71+), different income brackets, and all relevant sexes. A factorial ANOVA can then simultaneously assess the effect of these variables on your dependent variable (spending) and determine whether they make a difference.
How to conduct an ANOVA test
As with many of the older statistical tests, it’s possible to do ANOVA using a manual calculation based on formulas. However, you can run ANOVA tests much quicker using any number of popular stats software packages and systems, such as R, SPSS or Minitab.
A more recent development is to use automated tools such as Stats iQ from Qualtrics, which makes statistical analysis more accessible and straightforward than ever before.
Stats iQ and ANOVA
When you select one categorical variable with three or more groups and one continuous or discrete variable, Stats iQ runs a one-way ANOVA (Welch’s F test) and a series of pairwise ‘post hoc’ tests (Games-Howell tests).
The one-way ANOVA tests for an overall relationship between the two variables, and the pairwise tests test each possible pair of groups to see if one tends to have higher values than the other.
How to run an ANOVA test through Stats iQ
The Overall Stat Test of Averages in Stats iQ acts as an ANOVA, testing the relationship between a categorical and a numeric variable by testing the differences between two or more means. This test produces a p-value to determine whether the relationship is significant or not.
To run an ANOVA in Stats iQ, take the following steps:
- Select a variable with 3+ groups and one with numbers
- Select ‘Relate’
- You’ll then get an ANOVA, a related ‘effect size’ and a simple, easy to understand summary
Qualtrics Crosstabs and ANOVA
You can run an ANOVA test through the Qualtrics Crosstabs feature too. Here’s how:
- Ensure your ‘banner’ (column) variable has 3+ groups and your ‘stub’ (rows) variable has numbers (like Age) or numeric recodes (like ‘Very Satisfied’ = 7)
- Select ‘Overall stat test of averages’
- You’ll see a basic ANOVA p-value
ANOVA analysis
Once you’ve performed your ANOVA test, you now need to analyse the data and capture your findings. There are two main steps to focus on here.
Interpret the output
The F-value, degrees of freedom and the p-value collectively form the backbone of hypothesis testing in ANOVA. They work together to provide a complete picture of your data and allow you to make an informed decision about your research question.
The F-value and degrees of freedom are used together to compute the p-value; the p-value is used to determine whether or not differences between your groups are due to chance or not. Generally, if this p-value is less than 0.05 we say that the results are statistically significant, meaning that it is unlikely that they are due to chance.
F-value
This measures the ratio of the variability between groups to the variability within groups. It’s the fundamental statistic in ANOVA that quantifies the relative extent to which the group means differ.
Degrees of freedom (df)
This is necessary to adjust the F-value for the number of groups and the number of observations. It helps to take into account the sample size and the number of groups in the analysis, which influences the reliability and accuracy of the F-value.
P-value
This translates the F-value (and its degrees of freedom) into a probability that helps you make a decision about the null hypothesis. It provides the statistical significance of the analysis and allows for a more intuitive understanding of the results.
Post-hoc testing
If you find a significant effect using ANOVA, it means that there is a significant difference between at least two of the groups. But it doesn’t specify which groups are significantly different from each other. For this, you’ll need to perform post-hoc tests.
Here are some of the most common types of post hoc test.
Tukey’s Honestly Significant Difference (HSD)
This test compares all possible pairs of means and controls for the familywise error rate. It is most appropriate when all groups have equal sample sizes.
Bonferroni
This is a very conservative test that also compares all possible pairs of means. It adjusts the significance level by dividing it by the number of comparisons. It’s highly robust to type I errors, but increases the chance of type II errors.
Scheffe’s Test
This is a very flexible test that allows for any type of comparison, not just pairwise comparisons. It is also very conservative.
Fisher’s Least Significant Difference (LSD)
This test does not control for familywise error rate, so it tends to be liberal in detecting significant differences.
What are the limitations of ANOVA?
While ANOVA will help you to analyse the difference in means between two independent variables, it won’t tell you which statistical groups were different from each other.
If your test returns a significant F-value (the value you get when you run an ANOVA test), you may need to run an ad hoc test (like the Least Significant Difference test) to tell you exactly which groups had a difference in means.
Furthermore, ANOVA doesn’t provide information on the direction of the relationship between the independent and dependent variables – it only indicates if there is a statistically significant difference between group means.
Additional considerations with ANOVA
ANOVA can be a very useful tool for analysing data, but there are some considerations you should keep in mind before deciding to use it.
Sample size
With smaller sample sizes, data can be visually inspected to determine if it is in fact normally distributed; if it is, unranked t-test results are still valid even for small samples. In practice, this assessment can be difficult to make, so Stats iQ recommends ranked t-tests by default for small samples.
With larger sample sizes, outliers are less likely to negatively affect results. Stats iQ uses Tukey’s ‘outer fence’ to define outliers as points more than three times the interquartile range above the 75th or below the 25th percentile point.
It’s worth highlighting that ANOVA is most reliable when the sample sizes for all groups are equal.
The type of data
ANOVA requires the dependent variable to be continuous (interval/ratio), and the independent variable to be categorical (nominal/ordinal). If your variables do not meet these requirements, then ANOVA may not be the best choice.
Unambiguously ordinal data
Data like ‘Highest level of education completed’ or ‘Finishing order in marathon’ are unambiguously ordinal. While Likert scales (like a 1 to 7 scale, where 1 is ‘very dissatisfied’ and 7 is ‘very satisfied’) are technically ordinal, it is common practice in social sciences to treat them as though they are continuous (i.e., with an unranked t-test).
Read more about additional statistical analysis types:
eBook: 5 practices that improve the impact of research