What is correlation in research?
Correlation (often referred to as correlational study, correlation research, bivariate correlation or correlation analysis) is a core step in understanding your data (such as from survey research) or the relationship between variables in your dataset, typically expressed as x1 and x2.
If a correlation exists, one variable is correlated to another in a pairwise fashion.
Streamline your research processes with Qualtrics
Measuring correlation
To measure the degree to which any two variables are correlated, we use a correlation coefficient (of which there are many).
A correlation coefficient is a statistical value, also known as Pearson’s Correlation Coefficient (or Pearson’s r), and is always between -1 and 1. Note: outliers can make coefficients look statistically significant but not meaningful or insightful.
Data points are plotted on a scatterplot and the shape of the data informs the researcher of the relationship between variables.
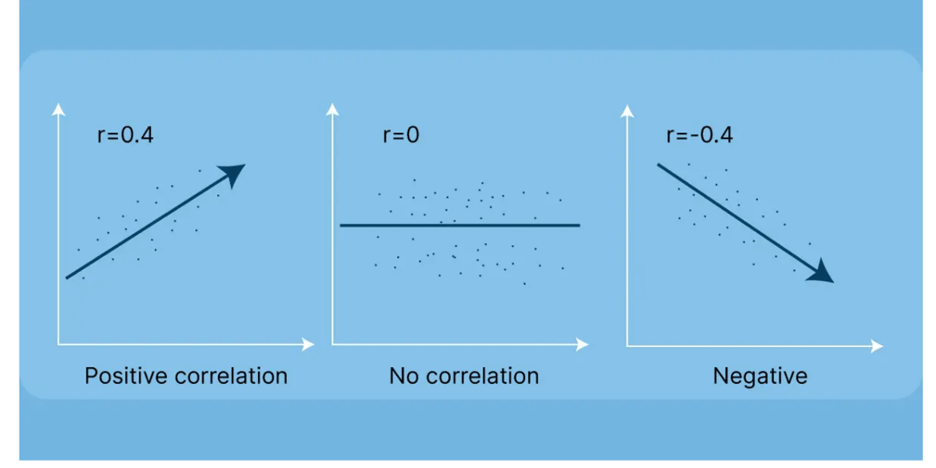
- -1 indicates a perfectly linear negative correlation
- 0 indicates no linear correlation
- 1 indicates a perfectly positive linear correlation
| Correlation type | Correlation coefficients | What it looks like on a scattergraph |
|---|---|---|
| Positive correlation | Between +0.01 and +1.00, with +1.00 indicating the strongest positive correlation relationship | Points are close together, showing a positive slope |
| Negative correlation | Between -0.01 and -1.00, with -1.00 indicating the strongest negative correlation relationship | Points are close together, showing a negative slope |
| Zero correlation | 0.00 | Points are all around and don’t form a shape |
Negative correlation (or negative relationship)
A negative correlation is a relationship between two variables in which an increase in one variable is associated with a decrease in the other. For example, as you spend more money (increase) you save less (decrease).
Positive correlation (or positive relationship)
For positive correlation, both variables either increase or decrease at the same time. Let’s take hours worked versus money earned (assuming no set limit on working hours). As hours worked increases, so too does money earned.
What is a correlation matrix?
Once you’ve plotted your correlation coefficients for different variables, you can build a correlation matrix to display them (or use Stats iQ which can produce one for you). A correlation matrix essentially depicts the correlations between all possible pairs of values in a table. It’s an easy way to summarise large datasets and identify visual patterns across the relationships you are testing.
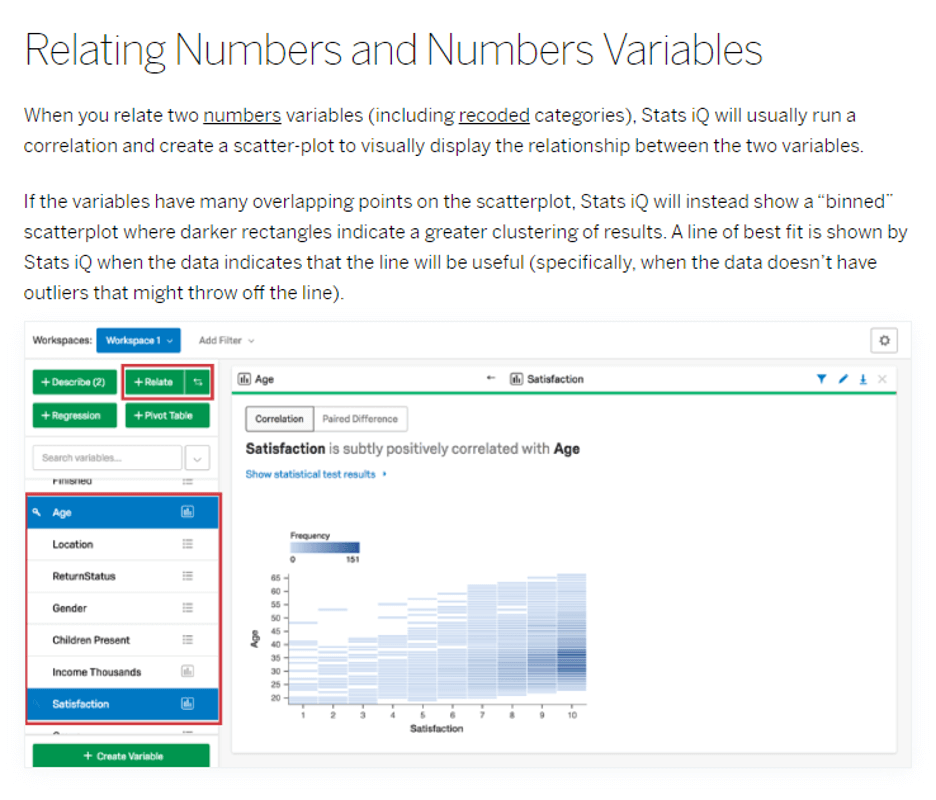
Relate capability in Stats iQ
Relate explores the relationships between variables. When you select two variables and then select Relate, Stats iQ will choose the appropriate statistical test based on the structure of the data, run that test, then translate the results into a simple and clear explanation.
When you select three or more variables, Stats iQ will relate each variable to the one variable that has the key by it, then bring the strongest relationships to the top. You can select dozens of variables at a time, so you can sift through many relationships quickly.
Again, “Descriptive Frequencies” and “Bivariate Correlation” are basic steps that every data analyst should take before they move onto regression.
Note, a correlational analysis only provides information about variables at one specific point in time. The results could change if you repeat the study.
Furthermore, whilst a relationship may exist between variables, any change in one isn’t necessarily the cause of the change in the other. This brings us onto a basic rule and famous maxim: “Correlation does not imply causation.”
Correlation and causation
It’s a well-known saying that correlation doesn’t imply causation, but why?
Well, with correlation, nothing is constant — and this lack of control makes it impossible to determine cause and effect from a simple correlation study.
Correlation and causation exist at the same time, but “causation” is a much higher standard. For example, you find that your child is standing by a table and there’s milk all over the place. So they spilled it. No — the cat did it before you walked in the room.
Causation explicitly applies to time and prior relationships where an action causes an outcome. Put simply: it indicates that one event is the result of another.
Correlation, on the other hand, is simply a reflection of a relationship between two variables — when one changes, so does the other, but it’s not necessarily the cause. The only way to prove or demonstrate a causal relationship is through an appropriately designed and controlled experiment.
As such, there are two basic reasons why correlation doesn’t imply causation:
1. Directionality problem
The directionality problem refers to a possible relationship between two variables — that a change in one will result in a change in the other. This also implies that there’s a correlation between them. However, as correlation doesn’t imply causation, we cannot say with certainty that the change in one of the variables is the cause of the change in the other.
2. Latent variables
A latent variable is a variable that you can’t observe or measure — but you can detect them based on their effects on other observable variables. Consider the psychological construct of happiness or the idea of customer satisfaction: you can’t directly see these variables, but you can measure them indirectly using observed variables.
For example, cities with more grocery stores also tend to have higher crime rates. However, these two variables are only correlated because they have a high correlation with a third variable: population size.
Measuring latent variables
To measure latent variables, we use observed variables and then mathematically estimate the unseen variables. This involves using advanced statistical techniques like factor analysis, latent class analysis (LCA), structural equation modeling (SEM), and Rasch analysis. These techniques rely on the inter-correlations of variables.
The next step is multiple regression/correlation, then casual or predictive modeling. But more on these methods in another topic. So, why use correlation?
Why use correlation?
Correlation is an essential part of any research study as it helps you to understand the relationships between variables, and therefore form hypotheses as the next step of the process.
The advantages of using correlation in research are:
Results are likely to be more truthful to natural occurrences
If no variables are influenced, then the variables are existing and interacting together as they would in ‘real life’, so the findings will be a true and accurate reflection of the variables.
It does identify variables with strong relationships
During statistical analysis of the data, correlational research will be able to indicate whether there is a positive or negative relationship, or no correlation at all, between the variables. This can be invaluable for research teams trying to identify the right variables to be concentrating future research on. Saves time and money
It can be time-consuming and costly to set up experiment conditions to test whether two variables interact with each other in a cause-and-effect way. correlational research provides a stepping-stone to show researchers the potential of variables in their natural setting, and perhaps bringing patterns to light that might not have been identified in the first place.
You should always use correlation in research, but you cannot always make inferences, because:
There is less external validity
If research findings cannot be repeated and are unable to provide conclusive results, because the observations were done in a natural setting where the variables were not isolated and may have been influenced by other factors.
Having a strong correlation does not infer causation
While two variables may be strongly connected, there cannot be a clear assessment of the cause-and-effect to provide a conclusion.
There is little control over the variables
It’s not possible to isolate the variables to confirm that only the two variables are being explored. There is always the possibility of the third variable.
No guarantee of the results not changing
If results are gathered that a researcher wants to replicate, the method of correlational research is backwards-looking, so there is no guarantee that the variable results won’t change in the future.
Use an intelligent statistical tool to streamline the entire process
By using a survey software technology platform to do your correlation analysis and research, you can save time analysing your data yourself, and instead use the tool to conduct start-to-finish correlation analysis across the creation, data collection, analysis and reporting stages.
Qualtrics’ survey software streamlines your data collection methods and correlations, making it easy to access results, measure data trends, and uncover insights without the complexity or need to jump between systems.
What makes Qualtrics so different from other survey providers is that you can consult with trained research professionals, and it includes high-tech statistical software like Qualtrics Stats iQ™. This can handle complicated analyses using these methods:
- Regression analysis – This is vital in correlational research as it measures the degree of influence of independent variables on a dependent variable (the relationship between two variables).
- Analysis of Variance (ANOVA) test – Commonly used with a regression study to find out what effect independent variables have on the dependent variable. It can compare multiple groups simultaneously to see if there is a relationship between them.
- Conjoint analysis – Asks people to make trade-offs when making decisions, then analyses the results to give the most popular outcome. Helps you understand why people make the complex choices they do.
- T-Test – Helps you compare whether two data groups have different mean values and allows the user to interpret whether differences are meaningful or merely coincidental.
- Crosstab analysis – Used in quantitative market research to analyse categorical data – that is, variables that are different and mutually exclusive, and allows you to compare the relationship between two variables in contingency tables.
If you want to learn how the system is set up for conducting and analysing correlational research, try out a Qualtrics survey software demo to see how it works.
Streamline your processes with Qualtrics