
Everyone gets excited when it comes to creating and developing new products. From ideation to project management, everyone on the team has ideas and wants to make things happen.
However, as good as the enthusiasm is, what almost inevitably happens is that teams end up with too many features to consider and, subsequently, you have no idea where to start.
You start questioning which features will be game-changers and which will be disappointing financial drains.
You may also have doubts about the usability of certain features and whether or not they provide value to your customers. To top it off, the time and cost for getting the feature upgrades wrong could set you and your team back months.
This is where kano analysis comes in. In this ultimate guide, we look at how you can use kano analysis to enhance your products and services, the process, and give you best practice support.
Free eBook: This Year’s Global Market Research Trends Report
What is kano analysis?
The Kano Analysis model (pronounced “Kah-no”), also known as the “Customer Delight vs. Implementation Investment” approach, is an analysis tool that enables you to understand how customer emotional responses to products or features can be measured and explored.
Using a Kano model questionnaire (used to conduct customer-focused research), product features are categorised across two-axis scales: satisfaction and functionality. With this, businesses can prioritise features on a product roadmap based on how likely they are to satisfy customers and the implementation investment.
This is a much more strategic, customer-orientated approach to product development.
The origins of Kano analysis: Dr. Noriaki Kano
The kano analysis model was published by Dr. Noriaki Kano, professor of quality management at the Tokyo University of Science, in 1984.
At the time, complaint processing and enhancing popular features was the accepted way of improving customer loyalty. Kano wanted to see if there were other ways for brands to maintain and improve customer loyalty levels.
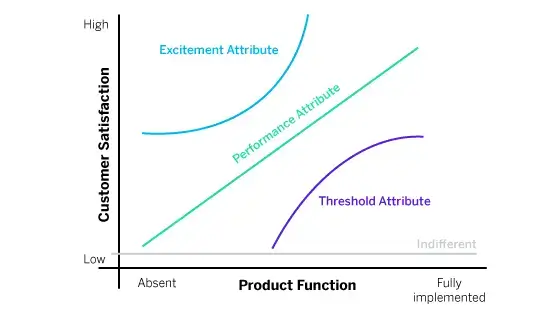
He believed that customer loyalty depended on emotional response levels to features. He hypothesised that there were five emotional response types to features, and conducted a study with 900 participants to explore his theory. With his results, he created the kano reaction graph (below ), which visualises the five emotional responses as curves.
With this reaction graph, he was able to prove that customer satisfaction depends on how sophisticated an available function is, which in turn causes a more emotional response.
Kano’s Five Emotional Response Types
- Must-be (or must have) features
- Performance features
- Attractive features
- Indifferent features
- Reverse features
Why would you use kano analysis?
Kano analysis is very useful for product teams that want to answer these key questions:
- How can we measure customer satisfaction?
- What features can we create to increase customer satisfaction?
- Do our current features cause high customer satisfaction?
- How can we enhance our features so that customer satisfaction is at the optimal level (‘delight customers’)?
By focusing on these questions and addressing customer needs, product teams can identify what it takes for their product to enter, remain, and excel in a target market.
When would you use kano analysis?
Wondering when to use the kano model? Here’s when it would be most effective and useful for your business:
When there is a limited time
When product teams are working to tight deadlines, the kano model is a great tool to speed up decision-making.
When there are limited resources
The simple method for carrying out Kano analysis uses an email questionnaire, meaning that you don’t need expert resources to do the research.
When you want to see what would impress your customers
When you’re looking to ‘think outside of the box or ‘think big, you can use kano analysis to see what features customers would like and find useful.
When you want to enhance a current product
When it’s time to refresh the product or keep it competitive against your market competition, using Kano analysis will assess all your feature options and give you clear choices to pick.
Benefits and advantages of kano analysis
Some key benefits of using the Kano model are:
Save time and money
The kano model prevents wasted time and resources associated with developing features that don’t appeal to target customers.
Identify priority areas
The kano model identifies the priority areas for your current product’s features that need immediate attention to rectify under-performance.
Group your best features
The kano model prioritises your feature ideas into a clear development plan based on performance enhancement and customer satisfaction levels.
Increase customer satisfaction
The kano model avoids feature development on ideas that won’t enhance customer satisfaction so that you can please your customers quicker.
Disadvantages and weaknesses of kano analysis
On the other hand, the disadvantages of using this tool should be considered as well:
Predominantly quantitative
Results provided by the questionnaire tend to provide quantitative (numerical) results, which can’t explore the ‘why’ behind the data. Further research to delve deeper into results may therefore be needed.
Requires analysis
Results from the questionnaire still need to be analysed and require some knowledge to interpret and apply findings.
Can be hard to manage
Manual methods of administering surveys can be hard to manage — they take time and are difficult to compare. A good technology solution would do this work for you and integrate it with your systems.
How does Kano analysis work?
Kano confirms that a product’s customer loyalty level is defined by the customer’s emotional responses to its features. But the functionality of the product isn’t the only factor that makes it ‘good’ – emotions matter too.
In general, products can work well and fulfil the basic need it’s required for (e.g. a customer can use it to complete a task, such as using a car’s key to start its engine), but that may not be enough.
A product that works and fulfils its purpose can still be boring or ‘behind the curve’. For example, a car that has self-driving functionality is more impressive, goes beyond the basic needs, and makes a customer think ‘wow’.
Taking this approach, product teams can quickly increase their customers’ satisfaction level by launching a few great, new features, rather than lots of basic ones. The kano model helps you to prioritise which of these ideas are most valuable, so you can make effective business decisions on which to move forward with.
Satisfaction and functionality in the kano analysis model categories
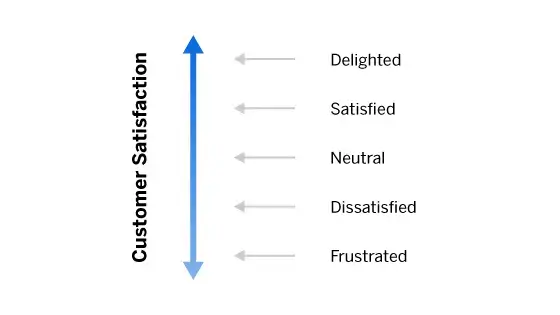
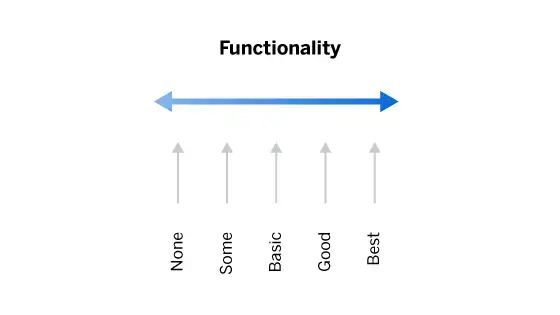
To understand how the kano reaction graph works, it’s important to understand satisfaction and functionality. The two below appear within the model as measurement scales to understand the customer’s response to a feature.
Kano created a satisfaction scale to run from ‘Delighted’ (indicating high satisfaction or excitement) to ‘Frustrated’ (indicating low or no satisfaction).
In addition, Kano created a functionality scale (also known as the Investment, Sophistication, or Implementation scale) that runs from ‘None’ to ‘Best’. This represents what level of function the customer thinks a feature provides. Has the feature been implemented to the highest level? Is this feature emotionally well-received by the customer?
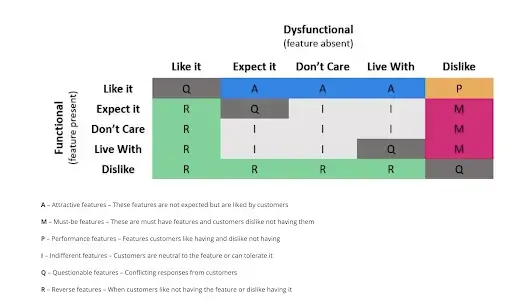
Based on responses from the kano questionnaire, features can be plotted on the kano reaction graph based on its satisfaction and function level:
The five categories of features in kano analysis
Now that we know the scales of measurement for each feature, next is the feature categories.
There are five categories of features that represent five potential customer reactions to a feature
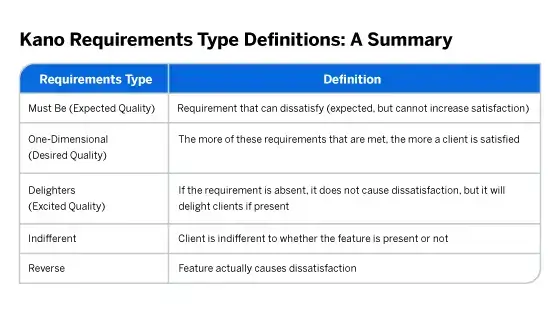
Must-have features
- Associated with the Threshold Attribute line on the Kano graph
- Must-be are basic features that customers expect a product or service to have.
- These are considered basic features that are expected to be part of the product or service by default. E.g. A customer expects that their hotel room will be clean and have a comfortable bed.
- If these features are there, the customer is likely to be neutral about them. Having these features won’t likely add more satisfaction.
- The absence of these qualities will cause dissatisfaction.
Performance features
- Associated to the Performance Attribute line on the Kano graph
- Performance features are desired features that customers want to have to add to their enjoyment of the product or feature, e.g. A car that has a large petrol storage tank is considered to store more petrol at one time, meaning it performs better than a car that has a smaller petrol storage tank.
- If there are a lot of performance features, then customer satisfaction increases in response. Kano described performance features as ‘one-directional, as they increase the satisfaction and functionality upwards.
Attractive features
- Associated to the Excitement Attribute line on the Kano graph
- Attractive features are features that cause excitement or delight customers, which sets your product or service above your competition, e.g. Getting a free second product as part of purchasing the first product is not expected but is a delightfully attractive offer that the customer can’t get from other competitors.
- Attractive features give satisfaction when they are there, but they don’t cause dissatisfaction when they aren’t there as they aren’t expected to be part of the product in the first place.
Indifferent features
- Associated to the Indifferent Attribute line on the Kano graph
- Indifferent features are features that customers think are neither good nor bad. They can be unimportant features to the customer, e.g. The font-face type used on a product’s logo.
- Indifferent features don’t create satisfaction or dissatisfaction. They’re features that are hardly noticed and don’t make a difference to the customer.
Reverse features
- Not associated with any lines on the Kano graph, but has the power to impact satisfaction levels.
- Reverse features are features that can cause dissatisfaction and can be considered undesired features by some people, e.g. The visual formatting in an instruction manual can cause dissatisfaction with customers that prefer a step-by-step text instruction format.
A product team should include more must-be, performance, and attractive features and try to avoid indifferent and reverse features.
Perceptions change over time
All features will shift and change over time:
Customer expectations of a product can change over time as more competitive products may enter the market
Product industry leader, Daniel Zacarias calls this occurrence “the natural decay of delight.” Delight levels increase as products have more exciting features year on year, like Apple phones.
Customer needs can change according to the environment they’re in
For example, with business becoming more remote following the COVID-19 pandemic, hotel rooms increasingly needed to come with free WiFi as a basic feature (when in the past it would be seen as an attractive feature).
Attitudes may change
What was seen as an indifferent feature in the past, like the amount of plastic used in sandwich wrapping, becomes more important as interest in recycling grows. The indifferent feature can become a reverse feature, actually putting off customers from buying the product.
Therefore, it’s important to remember to update your feature insights regularly and consider your customer’s environment.
Kano analysis tutorial
Kano analysis uses a standardised questionnaire to help customers feedback about their responses to features. It offers a way to measure opinions in a quantifiable way.
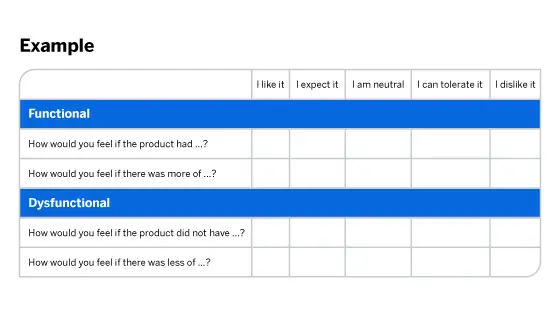
In the questionnaire, list each feature separately. You can even aid understanding of that feature by providing context or a demonstration of the feature.
For each feature, two sets of questions are asked:
- How do you feel if you have this feature?
- How would you feel if there were more of…?
(requesting a response based on a positive, or functional, situation)
- How do you feel if you do not have this feature?
- How would you feel if there were less of…?
(requesting a response based on a negative, or dysfunctional, situation)
The answers are chosen from this range of responses:
- I like it
- I expect it
- I am neutral
- I can tolerate it
- I dislike it
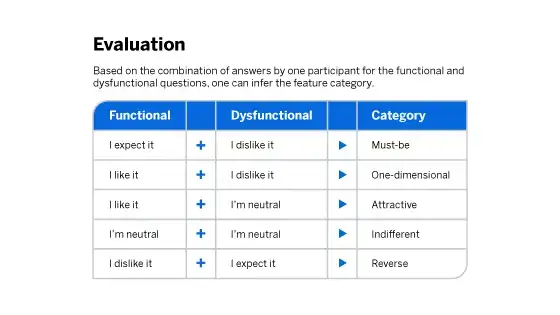
Evaluating the responses from the kano model questionnaire
Based on the responses, you can figure out which of the five Kano feature categories closely aligns with each feature investigated. You do this by looking at the combination of answers to see how they score against this marking table:
Site Source: Sapioresearch.com
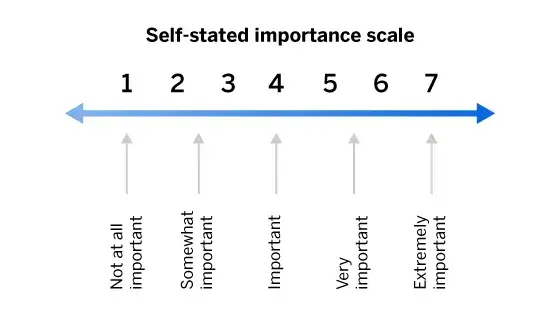
You can even add in a third question, which was an additional measure about how important a feature is (suggested by John Hauser of MIT, to help prioritise the order of important results).
Ask how important it is for the product/service to have a specific feature, and provide a Likert scale for responses. For example,
In general, the results from the kano model questionnaire will provide you with:
- A sense of how your features are perceived in terms of usefulness and functionality.
- How urgently these features are needed
How to apply kano analysis results to your business
There are several ways you can apply kano analysis to your business to improve customer satisfaction levels:
Improve your products and services
You could start off using kano analysis with this simple five-step method:
- Gather feature ideas: Collect existing feature ideas or create ideas for features that you think you would like to implement in your products or services.
- Conduct a kano model survey assessment for each: Use our tutorial section to get started.
- Apply the Kano feature categories to each feature in question: Using your customer results and your judgement, take each feature and classify these according to the five categories of must be, performance, attractive, indifferent and reverse.
- Position the features on the kano graph to see what features would work best, and where there are quick wins.
- Look at the features by category group and work on how you can improve your product or service (you want to look at how each category can be positively productive to the product or service).
- For example, increase the number of excitement attributes while removing or softening the reverse features so they aren’t as offensive to different customer tastes. It’s good practice to get the basic features implemented and then focus on the ‘must be’ features to encourage competitiveness.
Persona traits emerge from kano results
Once you have the information about categories for each feature, you could align the likes and dislikes from the questionnaire to your marketing personas.
If there is overlap with the attitudes towards certain features (e.g. features that encourage recycling) and personas (e.g. a young demographic that is environmentally conscious), then you can update marketing messages to these groups and sell your features as benefits.
These features will likely be seen as attractive to aligned audiences, leading to you having a better chance of selling more products and services.
Benefit vs cost modelling
As you’ll have a prioritised list of features at the end of the five-step method, you could follow up your planning with a benefit and cost model for each feature.
This could help understand which features, if implemented, could create a high return on investment by increasing sales.
Knowing this will help inform your product development cycle, especially if time and money resources are short.
Using in conjunction with NPS or customer reviews or feedback
Net Promoter Score is a metric used in customer experience programmes. NPS measures the loyalty of customers to a company. NPS scores are measured with a single-question survey and reported with a number from -100 to +100, and a higher score is desirable.
By creating positive features and increasing the customer’s satisfaction level towards a product or service, you can help your marketers to impact the overall NPS.
Best practice advice and tips for Kano analysis
Choose the right features
It’s advisable to test up to 20 features with the kano model. More will make the questionnaire too long.
Choose the right customers
Choose a sample size that is representative of your customer segmentation, your market segmentation, and your target marketing personas. Don’t forget about diversity as well! Approximately 15-20 is a good size to go ahead with, as there will be a lot of data coming back to analyse.
Get the best data
Ensure you get the best responses by making sure your questions are clear. Give the draft questionnaire to another team member for a fresh pair of eyes on it.
Consider follow-on qualitative interviews
Alongside the kano model questionnaire, try to get the ‘why’ and context behind the responses with qualitative interviews.