When you conduct research about a group of people or a population, especially at scale, it’s often not possible (nor practical) to obtain information from every person in that group.
Instead, you select a random sample; a group of individuals that will actually participate in the research, and provide proportionate representation in your results. This way you can scale your findings and make educated analyses across a population.
Use AI and automation to turn your research into actionable insights with our free eBook
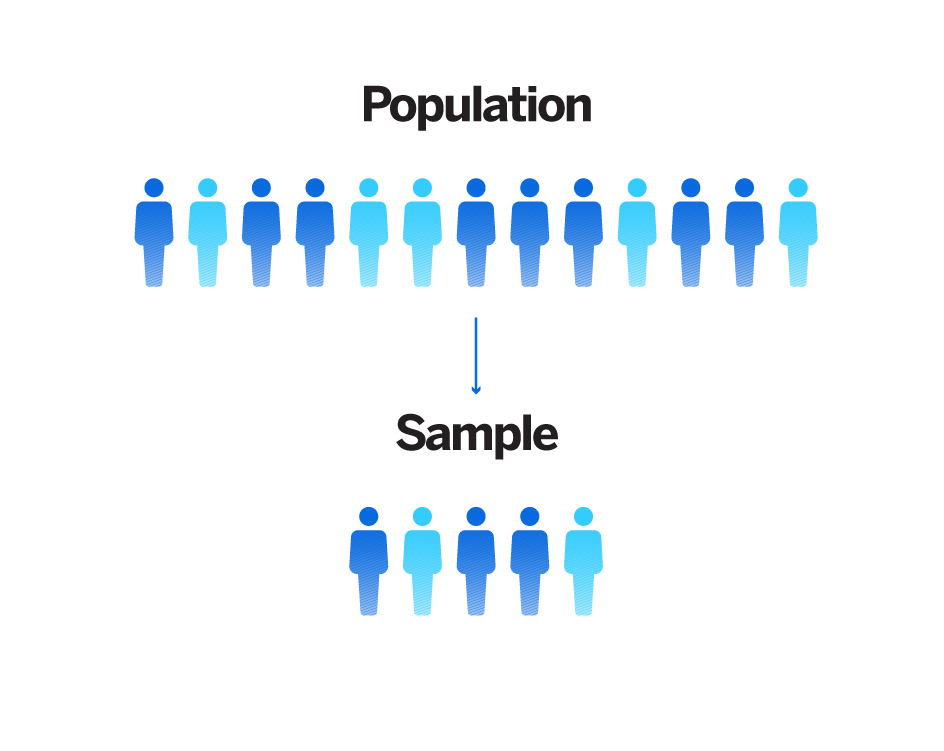
What’s the difference between a population and a sample?
The population is the entire group that you want to draw conclusions about. The sample is the specific group of individuals that you will collect data from. A population can be defined in terms of geographical location, age, income or any other key characteristic.
You also have something called a sampling frame. The sampling frame is the actual list of individuals that your sample will be drawn from. Ideally, it should include your entire target population.
Finally, you have your sample size – the number of individuals you include in your sample to aid your research. This will, of course, depend on what information you want to capture, your information design, population size, and much more.
Now, back to sampling. To ensure that your results are valid and representative, you need to choose a systematic sampling method – and this brings us to probability sampling and non-probability sampling.
In this article, we’re going to address probability sampling, including the types of probability sampling and how each type can be used to draw conclusions.
What is probability sampling?
Probability sampling isn’t anything new; from pulling names out of a hat to drawing straws, we’ve long practised it in different forms. In the simplest terms, probability sampling refers to any sampling method that utilises some form of random selection. Random selection is when processes or procedures are set up to ensure that the different units in a population have an equal chance of being chosen. For example, a random selection process in a sporting event, such as football, would mean that every participant has an equal chance of playing.
The purpose of random selection? To ensure a fair and unbiased result when using probability sampling. Nowadays, however, we use a computer as a random number generator to automate the process.
What’s the difference between probability sampling and non-probability sampling?
This one’s simple. The main difference between probability sampling and non-probability sampling is that probability sampling involves random selection sampling methods, while non-probability sampling does not.
In other words, probability sampling will always involve some kind of randomisation, whereas non-probability sampling has no specific probability that any individual will be in the sample set.
Also, if you’re worried about sampling and non-sampling errors, check out our handy guide on how to minimise them, here.
Types of probability sampling methods/probability sampling methods
There are four main probability sampling techniques or sampling methods:
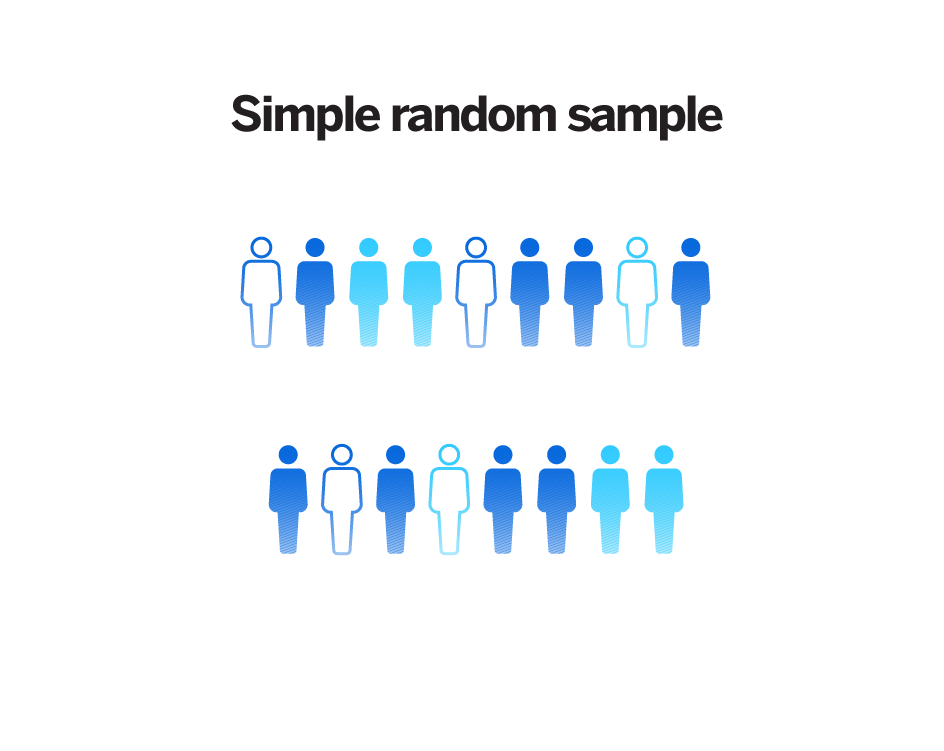
1) Simple random sampling
In a simple random sample, every member of the population has an equal chance of being selected. As mentioned above, your sample frame should include your entire target population. For example, you might prepare a list of all the population members and assign each one a number (i.e. 1-100). From this population, you choose random samples either through the use of random number generation (such as a lottery) or a random number table.
In the lottery example, you draw numbers from a box to randomly choose your sample.
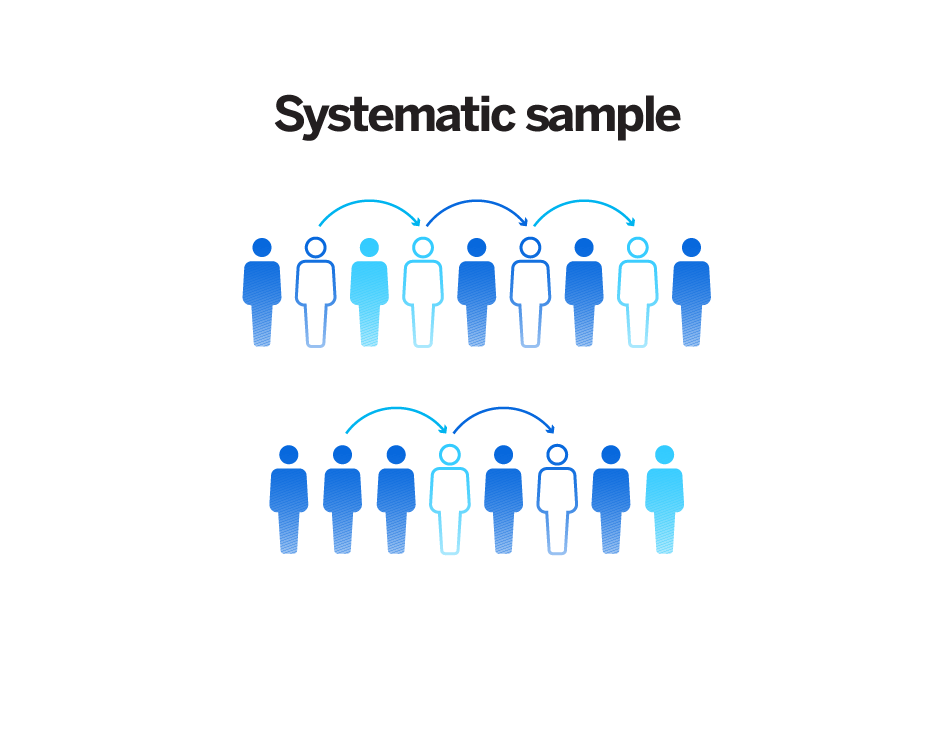
2) Systematic sampling
The systematic sampling method is similar to simple random sampling but often easier to conduct. With systematic sampling, each member of the population is given a number, but instead of a random selection process, individuals are chosen at regular intervals.
For example, you set a starting point – say number 5 – and select every 10th person on the list (5, 15, 25, 35).
One downfall with this approach is that if a pattern exists in the population, e.g. there are more senior staff than junior staff or greater wage disparities, depending on your research, your sample could be skewed and not necessarily representative of the entire population. It’s important to strike a balance, so take the time to assess your random sample.
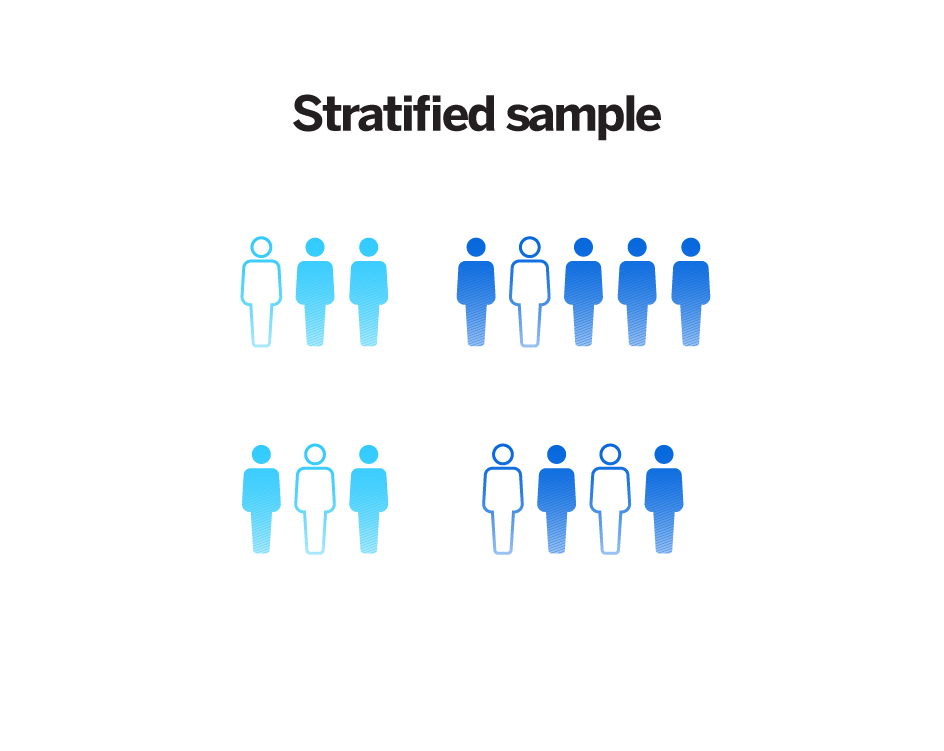
3) Stratified sampling
Stratified random sampling involves dividing your population into subpopulations that differ in several key ways. By separating your population like this, you can draw more precise conclusions as every subgroup is properly represented in your sample.
For example, if you wanted to analyse food consumption behaviour in a group of people, it might be helpful to separate those who are meat-eaters from those who are vegetarian or vegan. This will give you a better understanding of food consumption overall.
But while stratified random sampling provides more granular information, it can also introduce bias as you start to think about how to segment a population.
You can find out more about stratified random sampling here.
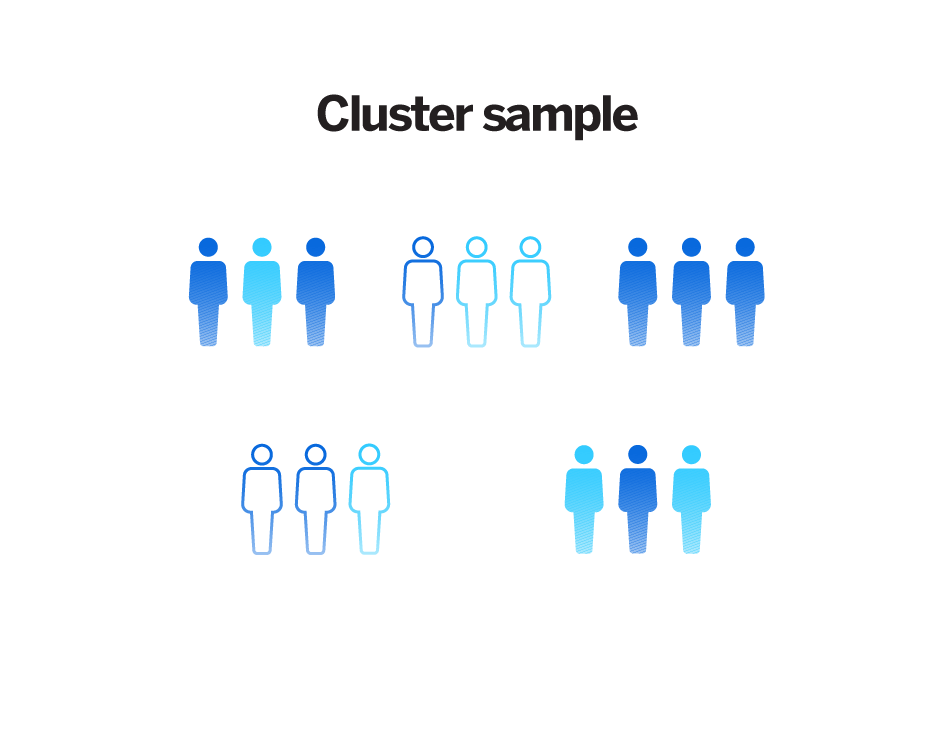
4) Cluster sampling (or cluster analysis)
Lastly, cluster sampling. This sampling method involves dividing your population into smaller groups known as clusters. You then randomly select individuals from these clusters to form a sample.
Cluster sampling is typically used to study large populations or those that are geographically dispersed.
For example, if you wanted to analyse the performance of your products across a country, you could divide the entire country into cities (clusters) and then select the cities with the highest populations and filter by those using mobile devices. This would give you an effective sample size from which to draw conclusions about your product’s performance.
There are two stages to cluster sampling, single-stage cluster sampling and multi-stage cluster sampling.
Single-stage cluster sampling
The simplest form of cluster sampling as it’s done only once. Single-stage cluster sampling involves four key steps:
1) Define your population
2) Divide your sample into clusters
3) Randomly select clusters to use as your sample
4) Collect data from the sample
Multi-stage cluster sampling
In multi-stage cluster sampling, rather than collecting data from every individual in selected clusters, you randomly select individuals from each cluster to use as your sample.
You can then collect data from each of these individual units (this is known as double-stage sampling).
If you continue this procedure and progressively make smaller and smaller samples, you’ll be doing what’s called multi-stage cluster sampling.
What’s next?
From simple random sampling to multi-stage cluster sampling, probability sampling can be a complex practise – but one that’s easily alleviated with the right know-how and resources.
When it comes to any kind of survey or market research, you want to maximise the value of the results you get and turn them into actionable insights – and that’s exactly where we can help.
We’ve helped the likes of Samsung to collect, analyse and act on insights gathered at every customer touchpoint, and Yamaha to carry out rapid research and highly complex studies using our XM platform.
In our guide to unlocking research efficiency using AI and automation, we highlight how you can rapidly and affordably turn around findings to deliver reliable insights.
Download it now to learn about:
- How to avoid pitfalls that can jeopardise your research process
- Best practises for research design
- Tips for data visualisation and reporting
Use AI and automation to turn your research into actionable insights with our eBook