
What is qualitative research?
Qualitative research is all about language, expression, body language and other forms of human communication. That covers words, meanings and understanding. Qualitative research is used to describe WHY. Why do people feel the way they do, why do they act in a certain way, what opinions do they have and what motivates them?
Qualitative data is used to understand phenomena – things that happen, situations that exist, and most importantly the meanings associated with them. It can help add a ‘why’ element to factual, objective data.
Qualitative research gives breadth, depth and context to questions, although its linguistic subtleties and subjectivity can mean that results are trickier to analyse than quantitative data.
This qualitative data is called unstructured data by researchers. This is because it has not traditionally had the type of structure that can be processed by computers, until today. It has, until recently at least, been exclusively accessible to human brains. And although our brains are highly sophisticated, they have limited processing power. What can help analyse this structured data to assist computers and the human brain?
Free eBook: Quantitative and qualitative research design
What is quantitative research?
Quantitative data refers to numerical information. Quantitative research gathers information that can be counted, measured, or rated numerically – AKA quantitative data. Scores, measurements, financial records, temperature charts and receipts or ledgers are all examples of quantitative data.
Quantitative data is often structured data, because it follows a consistent, predictable pattern that computers and calculating devices are able to process with ease. Humans can process it too, although we are now able to pass it over to machines to process on our behalf. This is partly what has made quantitative data so important historically, and why quantitative data – sometimes called ‘hard data’ – has dominated over qualitative data in fields like business, finance and economics.
It’s easy to ‘crunch the numbers’ of quantitative data and produce results visually in graphs, tables and on data analysis dashboards. Thanks to today’s abundance and accessibility of processing power, combined with our ability to store huge amounts of information, quantitative data has fuelled the Big Data phenomenon, putting quantitative methods and vast amounts of quantitative data at our fingertips.
Qualitative vs quantitative research
As we’ve indicated, quantitative and qualitative data are entirely different and mutually exclusive categories. Here are a few of the differences between them.
1. Data collection
Data collection methods for quantitative data and qualitative data vary, but there are also some places where they overlap.
Qualitative data collection methods
Quantitative data collection methods
Gathered from focus groups, in-depth interviews, case studies, expert opinion, observation, audio recordings, and can also be collected using surveys.
Gathered from surveys, questionnaires, polls, or from secondary sources like census data, reports, records and historical business data.
Uses open-ended and open text survey questions
Intended to be as close to objective as possible. Understands the ‘human touch’ only through quantifying the OE data that only this type of research can code.
2. Data analysis
Quantitative data suits statistical analysis techniques like linear regression, T-tests and ANOVA. These are quite easy to automate, and large quantities of quantitative data can be analysed quickly.
Analysing qualitative data needs a higher degree of human judgement, since unlike quantitative data, non-numerical data of a subjective nature has certain characteristics that inferential statistics can’t perceive. Working at a human scale has historically meant that qualitative data is lower in volume – although it can be richer in insights.
Qualitative data analysis
Quantitative data analysis
Results are categorised, summarised and interpreted using human language and perception, as well as logical reasoning
Results are analysed mathematically and statistically, without recourse to intuition or personal experience.
Fewer respondents needed, each providing more detail
Many respondents needed to achieve a representative result
3. Strengths and weaknesses
When weighing up qualitative vs quantitative research, it’s largely a matter of choosing the method appropriate to your research goals. If you’re in the position of having to choose one method over another, it’s worth knowing the strengths and limitations of each, so that you know what to expect from your results.
Qualitative approach
Quantitative approach
Can be used to help formulate a theory to be researched by describing a present phenomenon
Can be used to test and confirm a formulated theory
Results typically expressed as text, in a report, presentation or journal article
Results expressed as numbers, tables and graphs, relying on numerical data to tell a story.
Less suitable for scientific research
More suitable for scientific research and compatible with most standard statistical analysis methods
Harder to replicate, since no two people are the same
Easy to replicate, since what is countable can be counted again
Less suitable for sensitive data: respondents may be biased or too familiar with the pro
Ideal for sensitive data as it can be anonymised and secured
Qualitative vs quantitative – the role of research questions
How do you know whether you need qualitative or quantitative research techniques? By finding out what kind of data you’re going to be collecting.
You’ll do this as you develop your research question, one of the first steps to any research programme. It’s a single sentence that sums up the purpose of your research, who you’re going to gather data from, and what results you’re looking for.
As you formulate your question, you’ll get a sense of the sort of answer you’re working towards, and whether it will be expressed in numerical data or qualitative data.
For example, your research question might be “How often does a poor customer experience cause shoppers to abandon their shopping trolleys?” – this is a quantitative topic, as you’re looking for numerical values.
Or it might be “What is the emotional impact of a poor customer experience on regular customers in our supermarket?” This is a qualitative topic, concerned with thoughts and feelings and answered in personal, subjective ways that vary between respondents.
Here’s how to evaluate your research question and decide which method to use:
- Qualitative research:
Use this if your goal is to understand something – experiences, problems, ideas.
For example, you may want to understand how poor experiences in a supermarket make your customers feel. You might carry out this research through focus groups or in depth interviews (IDI’s). For a larger scale research method you could start by surveying supermarket loyalty card holders, asking open text questions, like “How would you describe your experience today?” or “What could be improved about your experience?” This research will provide context and understanding that quantitative research will not.
- Quantitative research:
Use this if your goal is to test or confirm a hypothesis, or to study cause and effect relationships. For example, you want to find out what percentage of your returning customers are happy with the customer experience at your store. You can collect data to answer this via a survey.
For example, you could recruit 1,000 loyalty card holders as participants, asking them, “On a scale of 1-5, how happy are you with our store?” You can then make simple mathematical calculations to find the average score. The larger sample size will help make sure your results aren’t skewed by anomalous data or outliers, so you can draw conclusions with confidence.
Qualitative and quantitative research combined?
Do you always have to choose between qualitative or quantitative data?
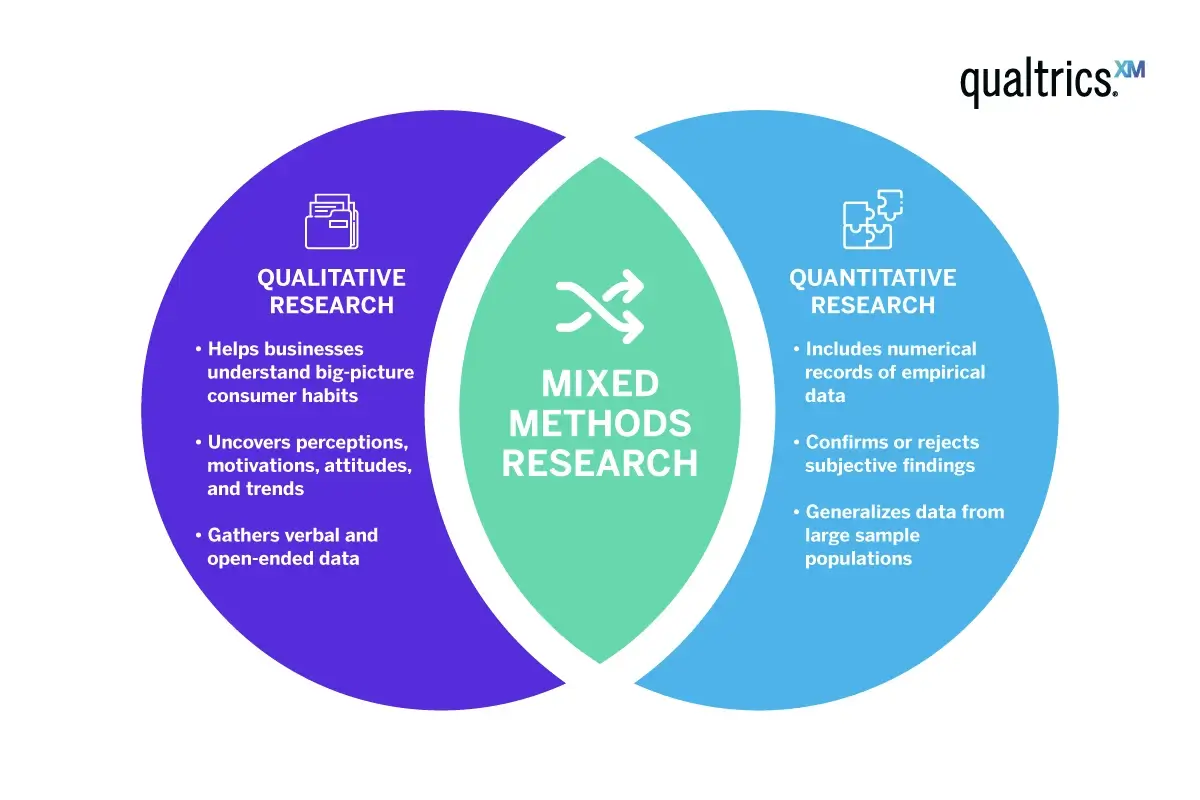
In some cases you can get the best of both worlds by combining both quantitative and qualitative data. You could use pre quantitative data to understand the landscape of your research. Here you can gain insights around a topic and propose a hypothesis. Then adopt a quantitative research method to test it out. Here you’ll discover where to focus your survey appropriately or to pre-test your survey, to ensure your questions are understood as you intended. Finally, using a round of qualitative research methods to bring your insights and story to life. This mixed methods approach is becoming increasingly popular with businesses who are looking for in depth insights.
For example, in the supermarket scenario we’ve described, you could start out with a qualitative data collection phase where you use focus groups and conduct interviews with customers. You might find suggestions in your qualitative data that customers would like to be able to buy children’s clothes in the store.
In response, the supermarket might pilot a children’s clothing range. Targeted quantitative research could then reveal whether or not those stores selling children’s clothes achieve higher customer satisfaction scores and a rise in profits for clothing.
Together, qualitative and quantitative data, combined with statistical analysis, have provided important insights about customer experience, and have proven the effectiveness of a solution to business problems.
Qualitative vs quantitative question types
As we’ve noted, surveys are one of the data collection methods suitable for both quantitative and qualitative research. Depending on the types of questions you choose to include, you can generate qualitative and quantitative data. Here we have summarised some of the survey question types you can use for each purpose.
Note: Please do not feel that these questions can be used for surveys alone. These can be great questions to spark conversations within focus groups, IDI’s, and discussion boards.
Qualitative data survey questions
There are fewer survey question options for collecting qualitative data, since they all essentially do the same thing – provide the respondent with space to enter information in their own words. Qualitative research is not typically done with surveys alone, and researchers may use a mix of qualitative methods. As well as a survey, they might conduct in depth interviews, use observational studies or hold focus groups.
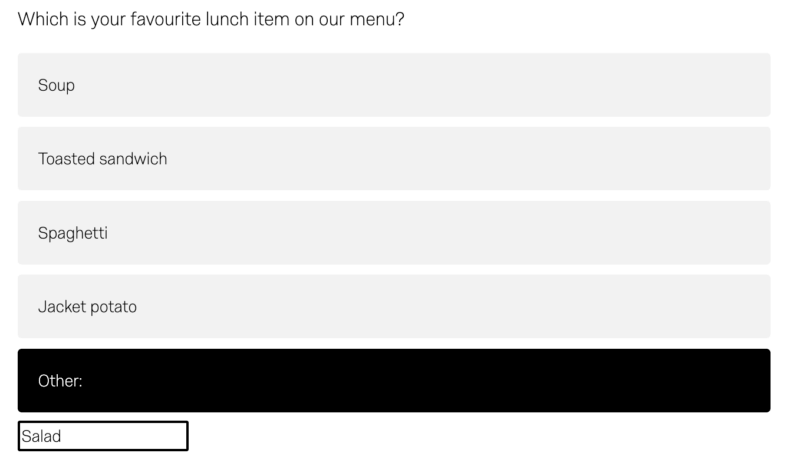
Open text ‘Other’ box (can be used with multiple choice questions)
Text box (space for short written answer)

Essay box (space for longer, more detailed written answers)

Quantitative data survey questions
These questions will yield quantitative data – i.e. a numerical value.
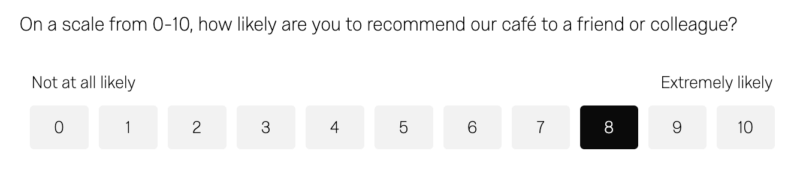
Net Promoter Score (NPS)
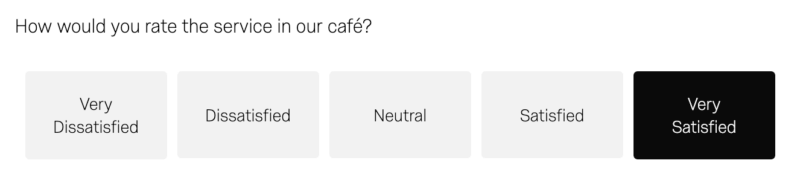
Likert Scale
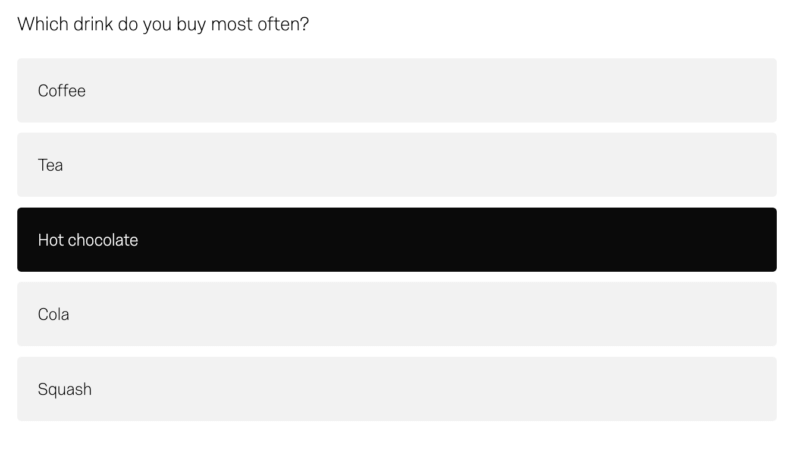
Radio buttons (respondents choose just one option)
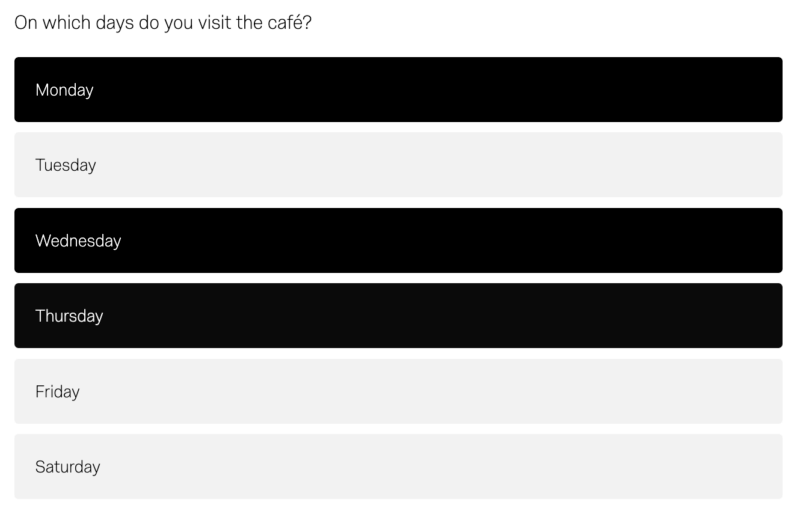
Check boxes (respondents can choose multiple options)
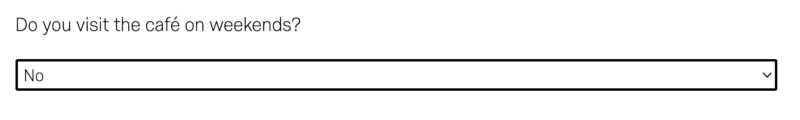
Drop-down
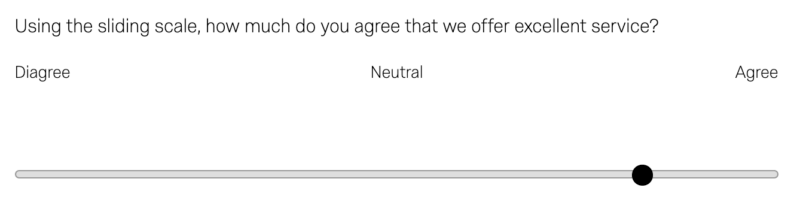
Sliding scale
Star rating
Analysing data (quantitative or qualitative) using technology
We are currently at an exciting point in the history of qualitative analysis. Digital analysis and other methods that were formerly exclusively used for quantitative data are now used for interpreting non-numerical data too.
Artificial intelligence programmes can now be used to analyse open text, and turn qualitative data into structured and semi-structured quantitative data that relates to qualitative data topics such as emotion and sentiment, opinion and experience.
Research that in the past would have meant qualitative researchers conducting time-intensive studies using analysis methods like thematic analysis can now be done in a very short space of time. This not only saves time and money, but opens up qualitative data analysis to a much wider range of businesses and organisations.
The most advanced tools can even be used for real-time statistical analysis, forecasting and prediction, making them a powerful asset for businesses.
Qualitative or quantitative – which is better for data analysis?
Historically, quantitative data was much easier to analyse than qualitative data. But as we’ve seen, modern technology is helping qualitative analysis to catch up, making it quicker and less labour-intensive than before.
That means the choice between qualitative and quantitative studies no longer needs to factor in ease of analysis, provided you have the right tools at your disposal. With an integrated platform like Qualtrics, which incorporates data collection, data cleaning, data coding and a powerful suite of analysis tools for both qualitative and quantitative data, you have a wide range of options at your fingertips.