
Why use survey statistical analysis methods?
Using statistical analysis for survey data is a best practice for businesses and market researchers. But why?
Statistical tests can help you improve your knowledge of the market, create better experiences for your customers, give employees more of what they need to do their jobs, and sell more of your products and services to the people that want them. As data becomes more available and easier to manage using digital tools, businesses are increasingly using it to make decisions, rather than relying on gut instinct or opinion.
When it comes to survey data, collection is only half the picture. What you do with your results can make the difference between uninspiring top-line findings and deep, revelatory insights. Using data processing tools and techniques like statistical tests can help you discover:
- whether the trends you see in your data are meaningful or just happened by chance
- what your results mean in the context of other information you have
- whether one factor affecting your business is more important than others
- what your next research question should be
- how to generate insights that lead to meaningful changes
There are several types of statistical analysis for surveys. The one you choose will depend on what you want to know, what type of data you have, the method of data collection, how much time and resources you have available, and the level of sophistication of your data analysis software.
Learn how Qualtrics can help you with advanced statistical analysis
Before you start
Whichever statistical techniques or methods you decide to use, there are a few things to consider before you begin.
Nail your sampling approach
One of the most important aspects of survey research is getting your sampling technique right and choosing the right sample size. Sampling allows you to study a large population without having to survey every member of it. A sample, if it’s chosen correctly, represents the larger population, so you can study your sample data and then use the results to confidently predict what would be found in the population at large.
There will always be some discrepancy between the sample data and the population, a phenomenon known as sampling error, but with a well-designed study, this error is usually so small that the results are still valuable.
There are several sampling methods, including probability and non-probability sampling. Like statistical analysis, the method you choose will depend on what you want to know, the type of data you’re collecting and practical constraints around what is possible.
Define your null hypothesis and alternative hypothesis
A null hypothesis is a prediction you make at the start of your research process to help define what you want to find out. It’s called a null hypothesis because you predict that your expected outcome won’t happen – that it will be null and void. Put simply: you work to reject, nullify or disprove the null hypothesis.
Along with your null hypothesis, you’ll define the alternative hypothesis, which states that what you expect to happen will happen.
For example, your null hypothesis might be that you’ll find no relationship between two variables, and your alternative hypothesis might be that you’ll find a correlation between them. If you disprove the null hypothesis, either your alternative hypothesis is true or something else is happening. Either way, it points you towards your next research question.
Use a benchmark
Benchmarking is a way of standardising – levelling the playing field – so that you get a clearer picture of what your results are telling you. It involves taking outside factors into account so that you can adjust the parameters of your research and have a more precise understanding of what’s happening.
Benchmarking techniques use weighting to adjust for variables that may affect overall results. What does that mean? Well for example, imagine you’re interested in the growth of crops over a season. Your benchmarking will take into account variables that have an effect on crop growth, such as rainfall, hours of sunlight, any pests or diseases, type and frequency of fertiliser, so that you can adjust for anything unusual that might have happened, such as an unexpected plant disease outbreak on a single farm within your sample that would skew your results.
With benchmarks in place, you have a reference for what is “standard” in your area of interest, so that you can better identify and investigate variance from the norm.
The goal, as in so much of survey data analysis, is to make sure that your sample is representative of the whole population, and that any comparisons with other data are like-for-like.
Inferential or descriptive?
Statistical methods can be divided into inferential statistics and descriptive statistics.
- Descriptive statistics shed light on how the data is distributed across the population of interest, giving you details like variance within a group and mean values for measurements.
- Inferential statistics help you to make judgements and predict what might happen in the future, or to extrapolate from the sample you are studying to the whole population. Inferential statistics are the types of analyses used to test a null hypothesis. We’ll mostly discuss inferential statistics in this guide.
Types of statistical analysis
Regression analysis
Regression is a statistical technique used for working out the relationship between two (or more) variables.
To understand regressions, we need a quick terminology check:
- Independent variables are “standalone” phenomena (in the context of the study) that influence dependent variables
- Dependent variables are things that change as a result of their relationship to independent variables
Let’s use an example: if we’re looking at crop growth during the month of August in Iowa, that’s our dependent variable. It’s affected by independent variables including sunshine, rainfall, pollution levels and the prevalence of certain bugs and pests.
A change in a dependent variable depends on, and is associated with, a change in one (or more) of the independent variables.
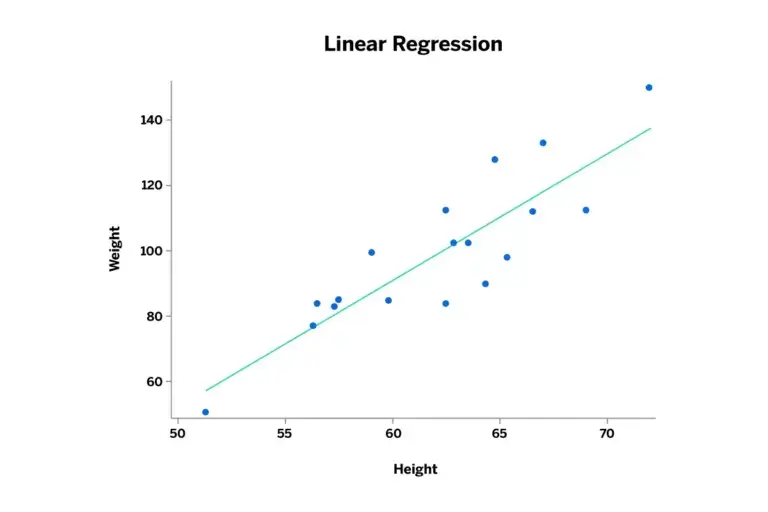
- Linear regression uses a single independent variable to predict an outcome of the dependent variable.
- Multiple regression uses at least two independent variables to predict the effect on the dependent variable. A multiple regression can be linear or non-linear.
The results from a linear regression analysis are shown as a graph with variables on the axes and a ‘regression curve’ that shows the relationships between them. Data is rarely directly proportional, so there’s usually some degree of curve rather than a straight line.
With this kind of statistical test, the null hypothesis is that there is no relationship between the dependent variable and the independent variable. The resulting graph would probably (though not always) look quite random rather than following a clear line.
Regression is a useful test statistic as you’re able to identify not only whether a relationship is statistically significant, but the precise impact of a change in your independent variable.
The T-test
The T-test (aka Student’s T-test) is a tool for comparing two data groups which have different mean values. The T-test allows the user to interpret whether differences are statistically significant or merely coincidental.
For example, do women and men have different mean heights? We can tell from running a t-test that there is a meaningful difference between the average height of a man and the average height of a woman – i.e. the difference is statistically significant.
For this test statistic, the null hypothesis would be that there’s no statistically significant difference.
The results of a T-test are expressed in terms of probability (p-value). If the p-value is below a certain threshold, usually 0.05, then you can be very confident that your two groups really are different and it wasn’t just a chance variation between your sample data.
Analysis of variance (ANOVA) test
Like the T-test, ANOVA (analysis of variance) is a way of testing the differences between groups to see if they’re statistically significant. However, ANOVA allows you to compare three or more groups rather than just two.
Also like the T-test, you’ll start off with the null hypothesis that there is no meaningful difference between your groups.
ANOVA is used with a regression study to find out what effect independent variables have on the dependent variable. It can compare multiple groups simultaneously to see if there is a relationship between them.
An example of ANOVA in action would be studying whether different types of advertisements get different consumer responses. The null hypothesis is that none of them have more effect on the audience than the others and they’re all basically as effective as one another. The audience reaction is the dependent variable here, and the different ads are the independent variables.
Cluster analysis
Cluster analysis is a way of processing datasets by identifying how closely related the individual data points are. Using cluster analysis, you can identify whether there are defined groups (clusters) within a large pool of data, or if the data is continuously and evenly spread out.
Cluster analysis comes in a few different forms, depending on the type of data you have and what you’re looking to find out. It can be used in an exploratory way, such as discovering clusters in survey data around demographic trends or preferences, or to confirm and clarify an existing alternative or null hypothesis.
Cluster analysis is one of the more popular statistical techniques in market research, since it can be used to uncover market segments and customer groups.
Factor analysis
Factor analysis is a way to reduce the complexity of your research findings by trading a large number of initial variables for a smaller number of deeper, underlying ones. In performing factor analysis, you uncover “hidden” factors that explain variance (difference from the average) in your findings.
Because it delves deep into the causality behind your data, factor analysis is also a form of research in its own right, as it gives you access to drivers of results that can’t be directly measured.
Conjoint analysis
Market researchers love to understand and predict why people make the complex choices they do. Conjoint analysis comes closest to doing this: it asks people to make trade-offs when making decisions, just as they do in the real world, then analyses the results to give the most popular outcome.
For example, an investor wants to open a new restaurant in a town. They think one of the following options might be the most profitable:
The investor commissions market research. The options are turned into a survey for the residents:
- Which type of restaurant do you prefer? (Gourmet burger/Spanish tapas/Thai)
- What would you be prepared to spend per head? (£20, £40, £60)
- How far would you be willing to travel? (5km, 2km, 10km)
- Would your partner…? (Love it, be OK with it)
There are lots of possible combinations of answers – 54 in this case: (3 restaurant types) x (3 price levels) x (3 distances) x (2 partner preferences). Once the survey data is in, conjoint analysis software processes it to figure out how important each option is in driving customer decisions, which levels for each option are preferred, and by how much.
So, from conjoint analysis, the restaurant investor may discover that there’s a statistically significant preference for an expensive Spanish tapas bar on the outskirts of town – something they may not have considered before.
Crosstab analysis
Crosstab (cross-tabulation) is used in quantitative market research to analyse categorical data – that is, variables that are different and mutually exclusive, such as: ‘men’ and ‘women’, or ‘under 30’ and ‘over 30’.
Also known by names like contingency table and data tabulation, crosstab analysis allows you to compare the relationship between two variables by presenting them in easy-to-understand tables.
A statistical method called chi-squared can be used to test whether the variables in a crosstab analysis are independent or not by looking at whether the differences between them are statistically significant.
Text analysis and sentiment analysis
Analysing human language is a relatively new form of data processing, and one that offers huge benefits in experience management. Qualtrics uses machine learning and natural language processing to parse and categorise data from text feedback, assigning positive, negative or neutral sentiment to customer messages and reviews.
With this data from text analysis in place, you can then employ statistical tools to analyse trends, make predictions and identify drivers of positive change.
The easy way to run statistical analysis
As you can see, using statistical methods is a powerful and versatile way to get more value from your research data, whether you’re running a simple linear regression to show a relationship between two variables, or performing natural language processing to evaluate the thoughts and feelings of a huge population.
Knowing whether what you notice in your results is statistically significant or not gives you the green light to confidently make decisions and present findings based on your results, since statistical methods provide a degree of certainty that most people recognise as valid. So having results that are statistically significant is a hugely important detail for businesses as well as academics and researchers.
Fortunately, using statistical methods, even the highly sophisticated kind, doesn’t have to involve years of study. With the right tools at your disposal, you can jump into exploratory data analysis almost straight away.
Our product can perform the most complicated statistical tests at the touch of a button using our online survey software, or data brought in from other sources.
Turn your data into insights and actions. Powerful statistical analysis. No stats degree required.