
Stats iQ Basic Overview
What's on this page
Attention: Stats iQ is an add-on feature not included in the standard Qualtrics license. If you do not have a Stats iQ section, please contact your Qualtrics Account Executive for more information. If you would like to know if you have access to Stats iQ, you can contact your Brand Administrator. If the proper permissions have been granted you may have to generate an API token in order to activate Stats iQ.
Attention: By default, Brand Administrators have the StatsiQ – Individual Userand Use Crosstabs – Individual User permissions disabled at the user type level. Brand Administrators will need to manually enable these permissions for each Brand Administrator that will be utilizing Stats iQ or Crosstabs. For more information on advanced permissions, click here.
Getting Started with Stats iQ
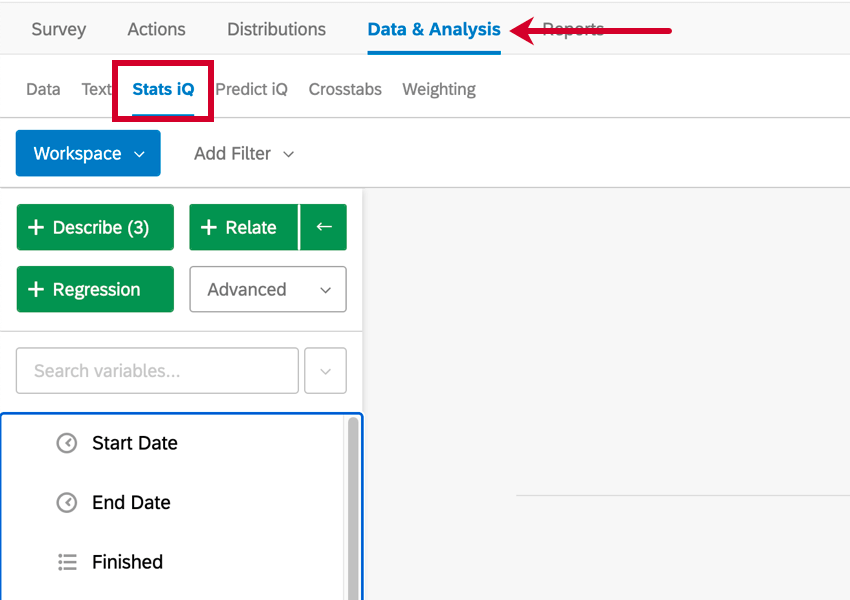
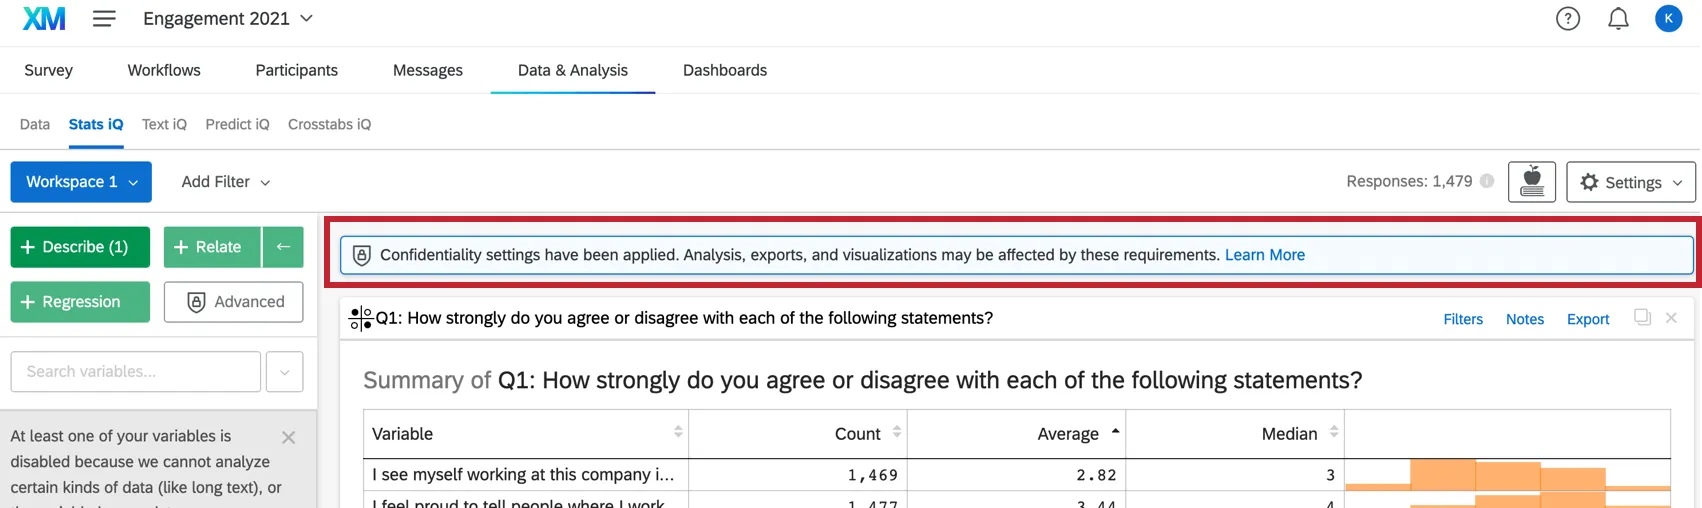
To get started with Stats iQ, you can either upload a dataset to Qualtrics, or you can open a project you’ve been running, go to the Data & Analysis tab, and select Stats iQ.
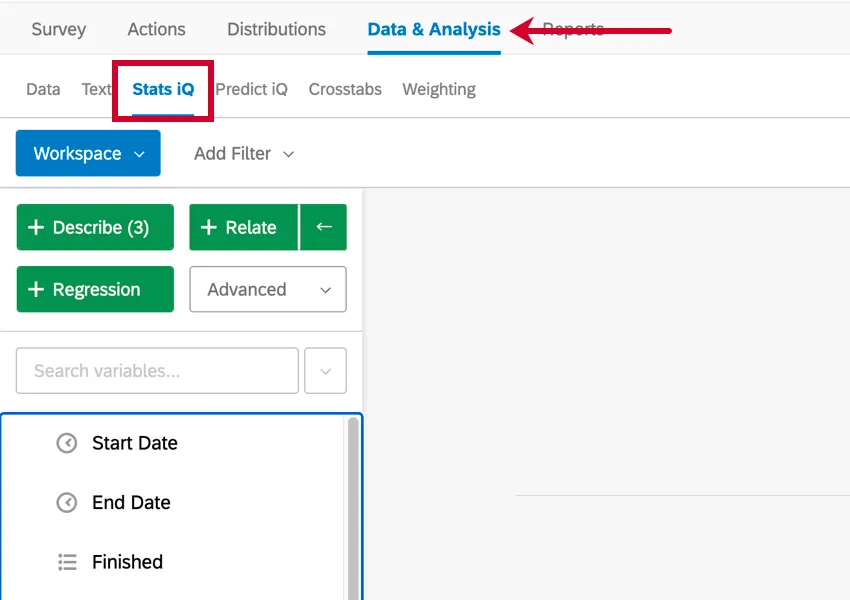
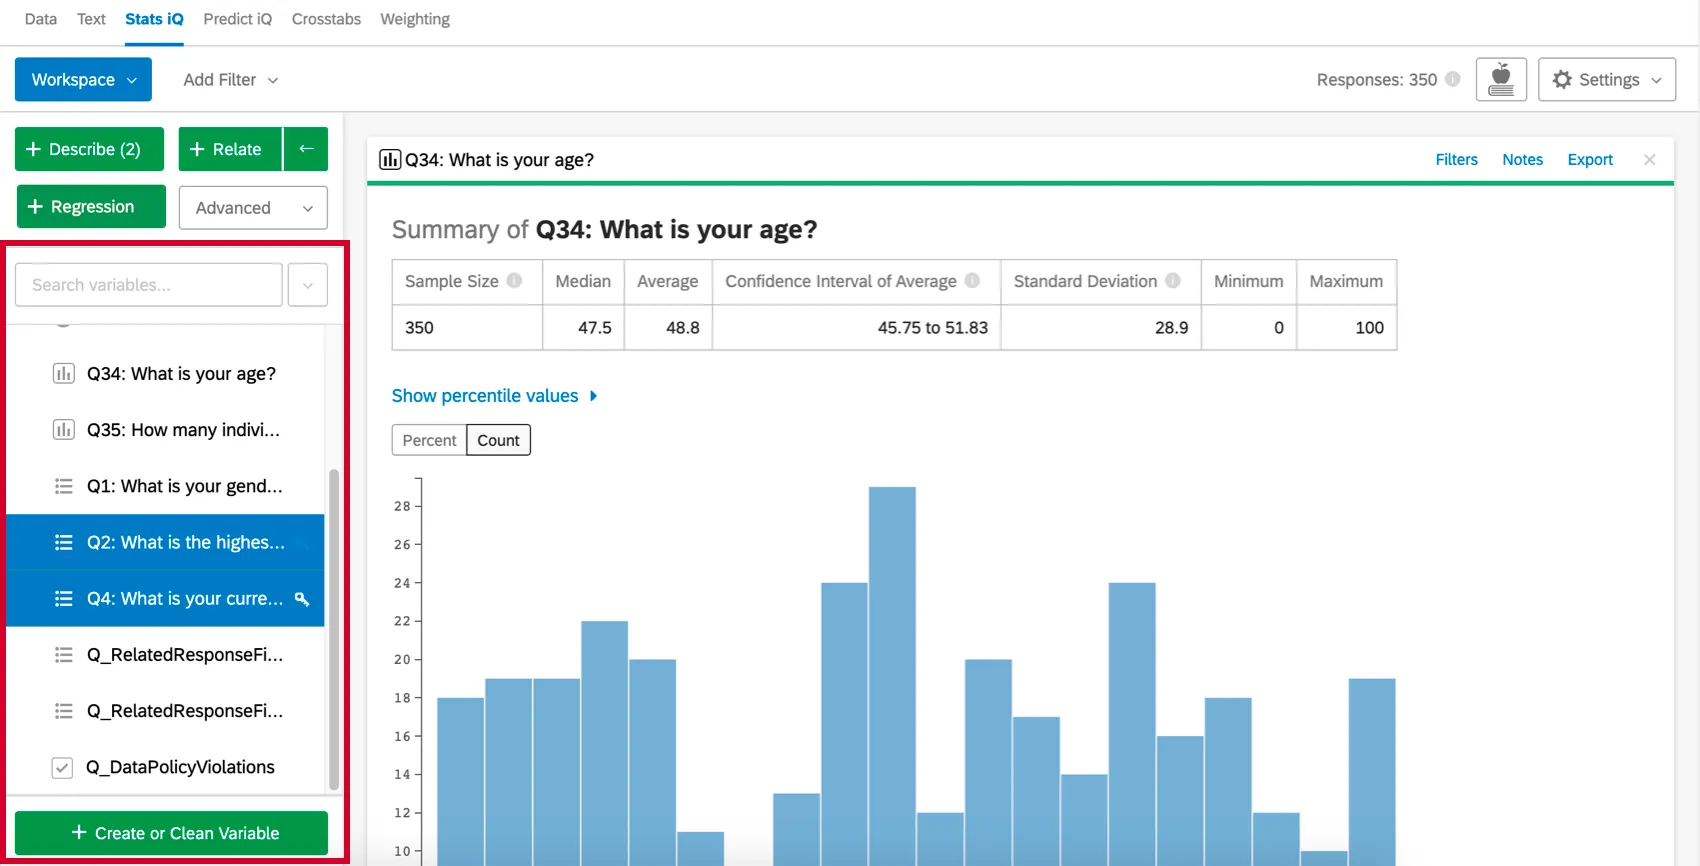
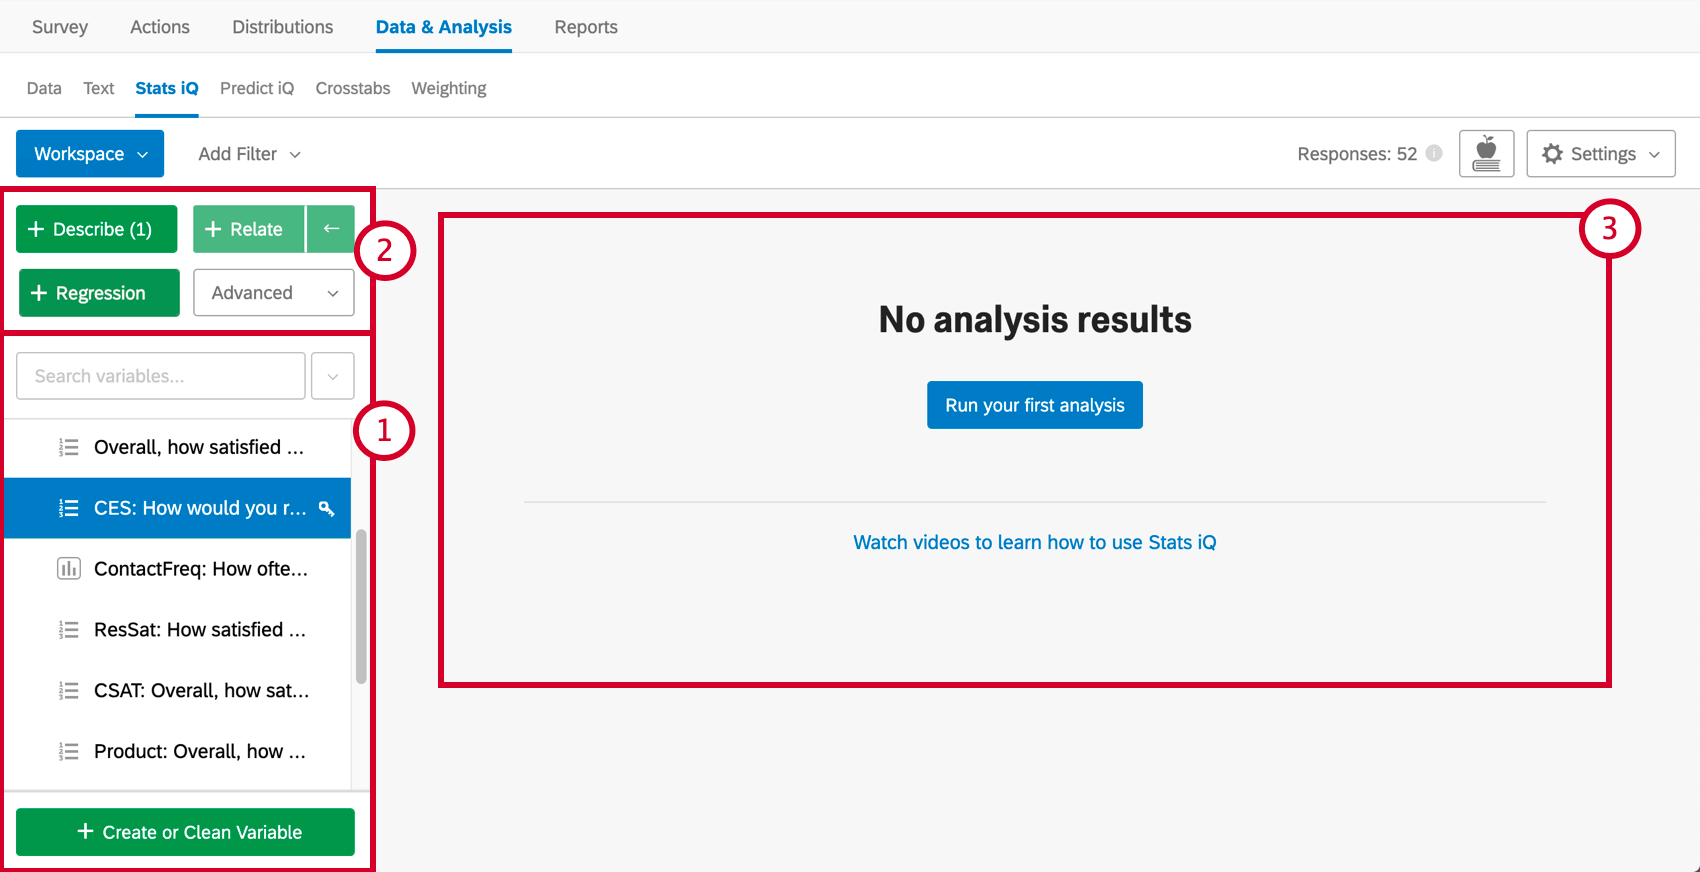
Stats iQ has three main parts, numbered in the screenshot below:

To summarize a variable, select it and hit Describe. Since this one’s numeric, we’re given info on median, mean, and so on. Different types of variables are described in different ways.
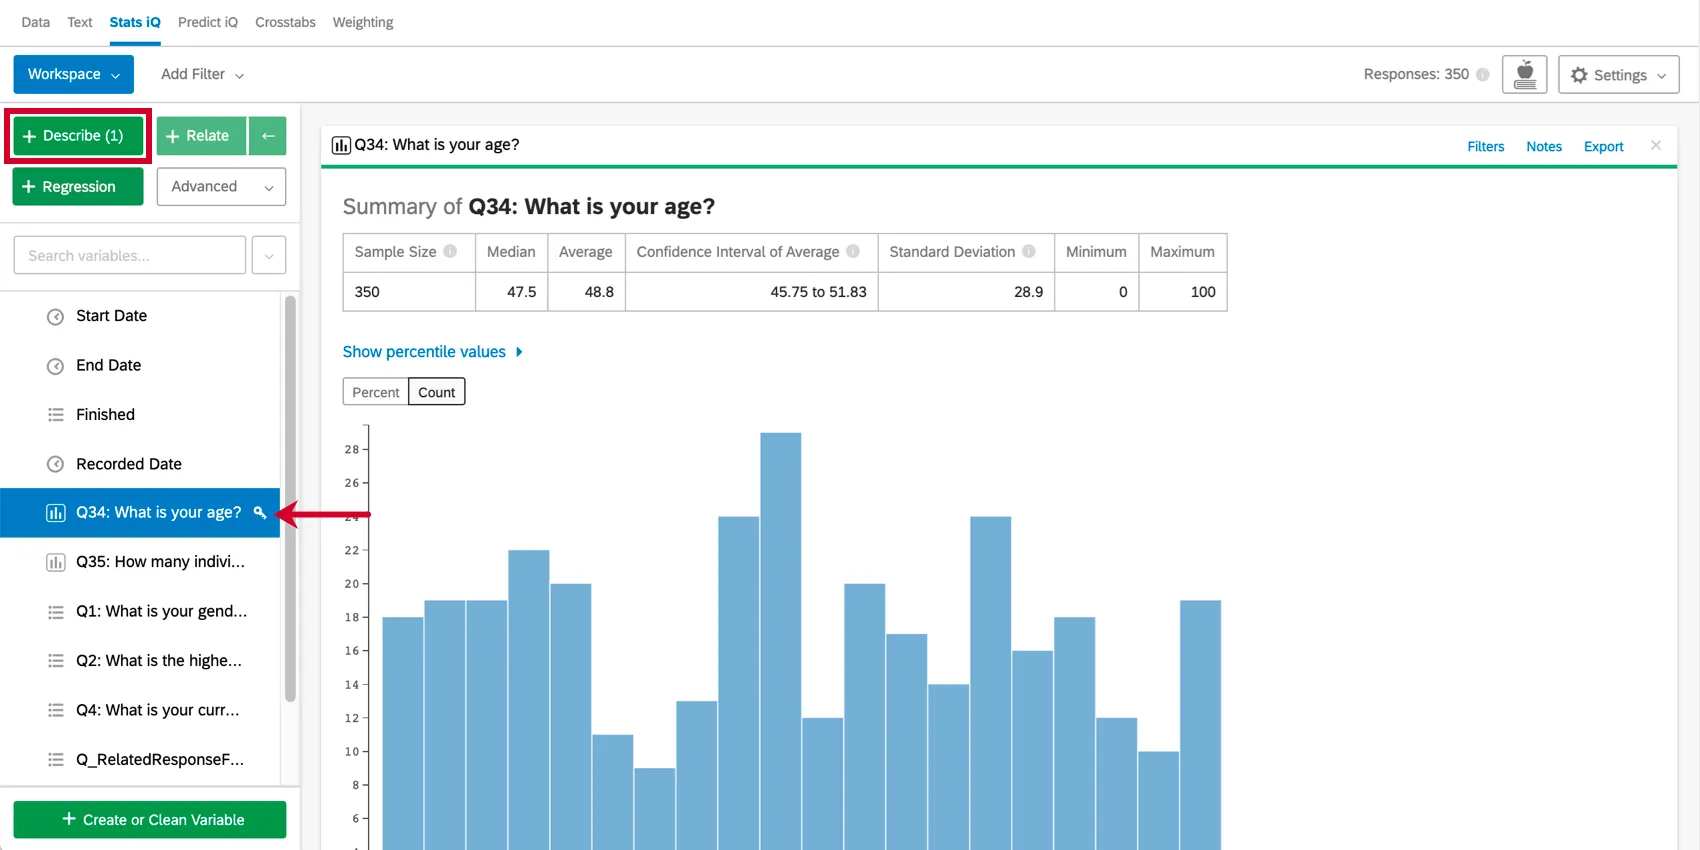
Qtip: You can select multiple variables and hit Describe to get a summary of each one.
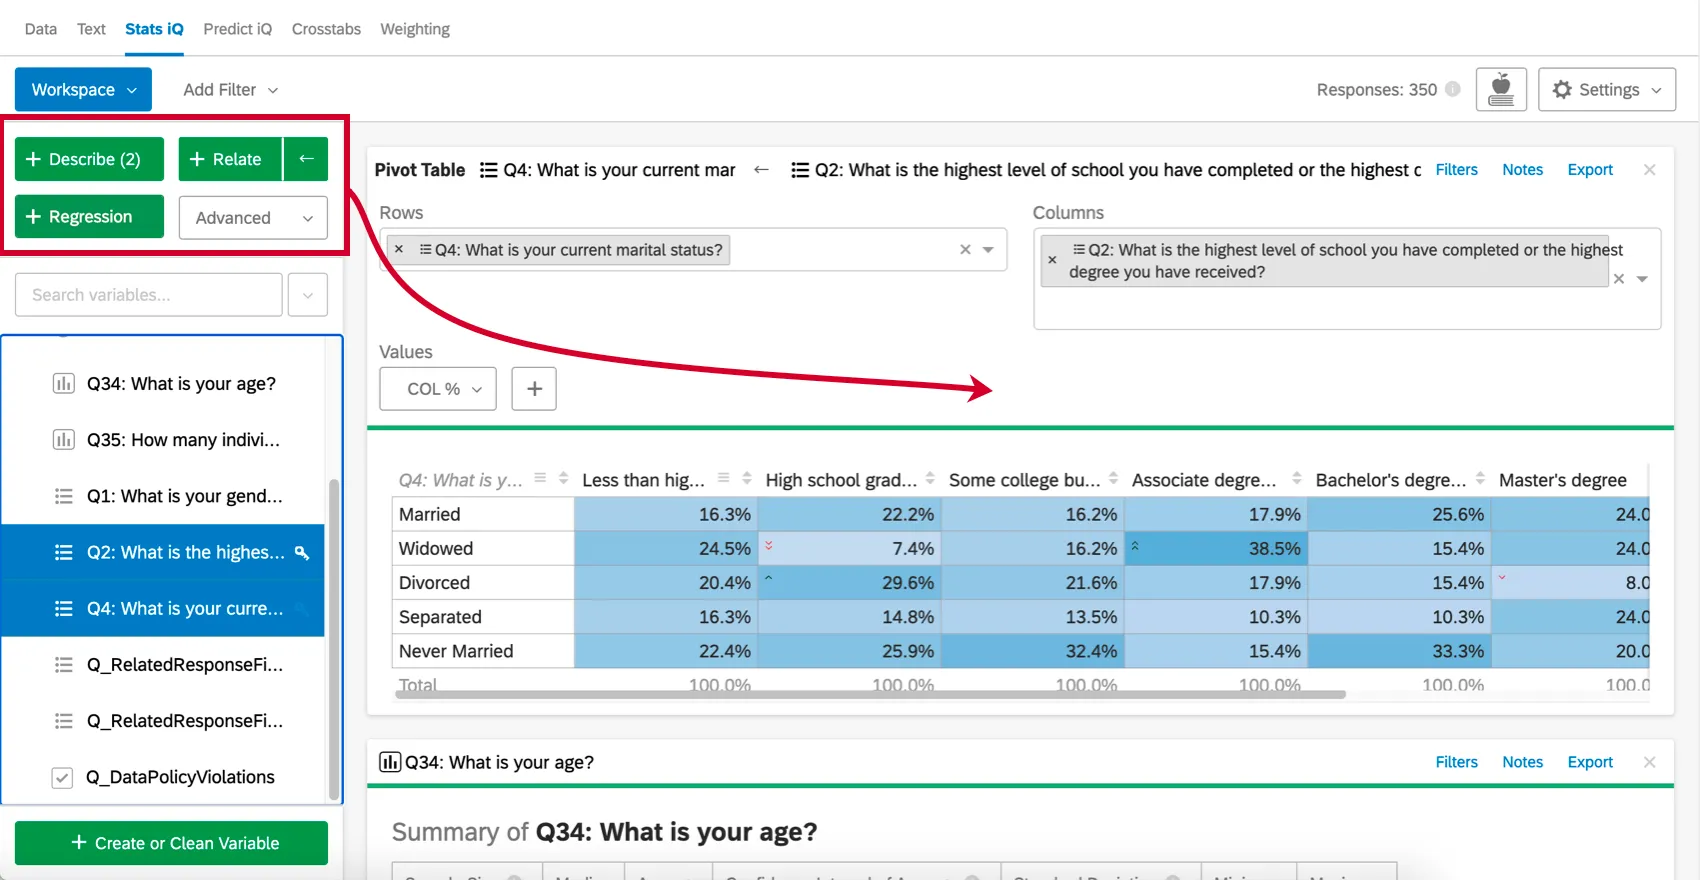
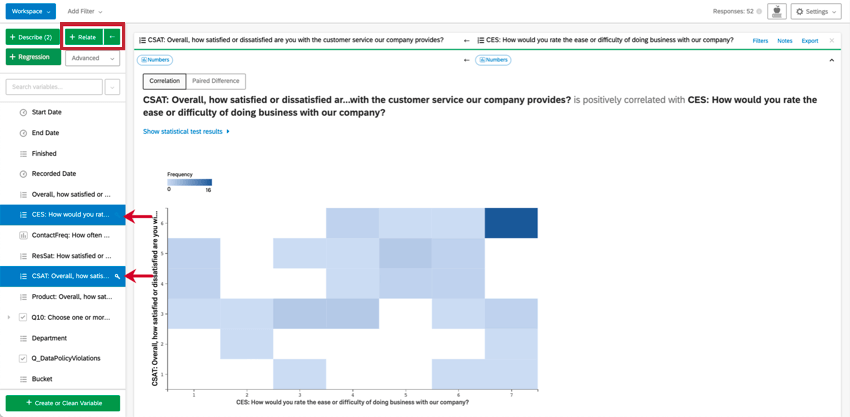
Relate, on the other hand, is one of the analyses that allows you to determine a relationship between two variables. Stats iQ will explain how these variables are related, if they are at all.
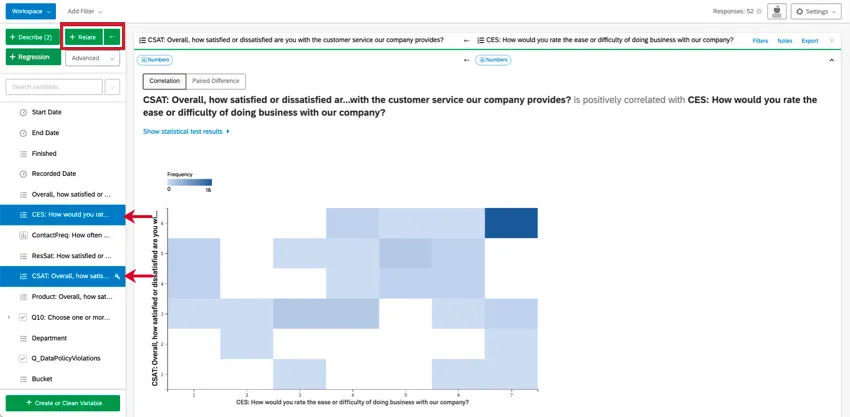
Select many variables to relate them back to one key variable. Stats iQ will provide you with a series of hypotheses based on these relationships.
Qtip: This intro focuses on describing and relating variables, but you can dive deeper into the other analyses available.
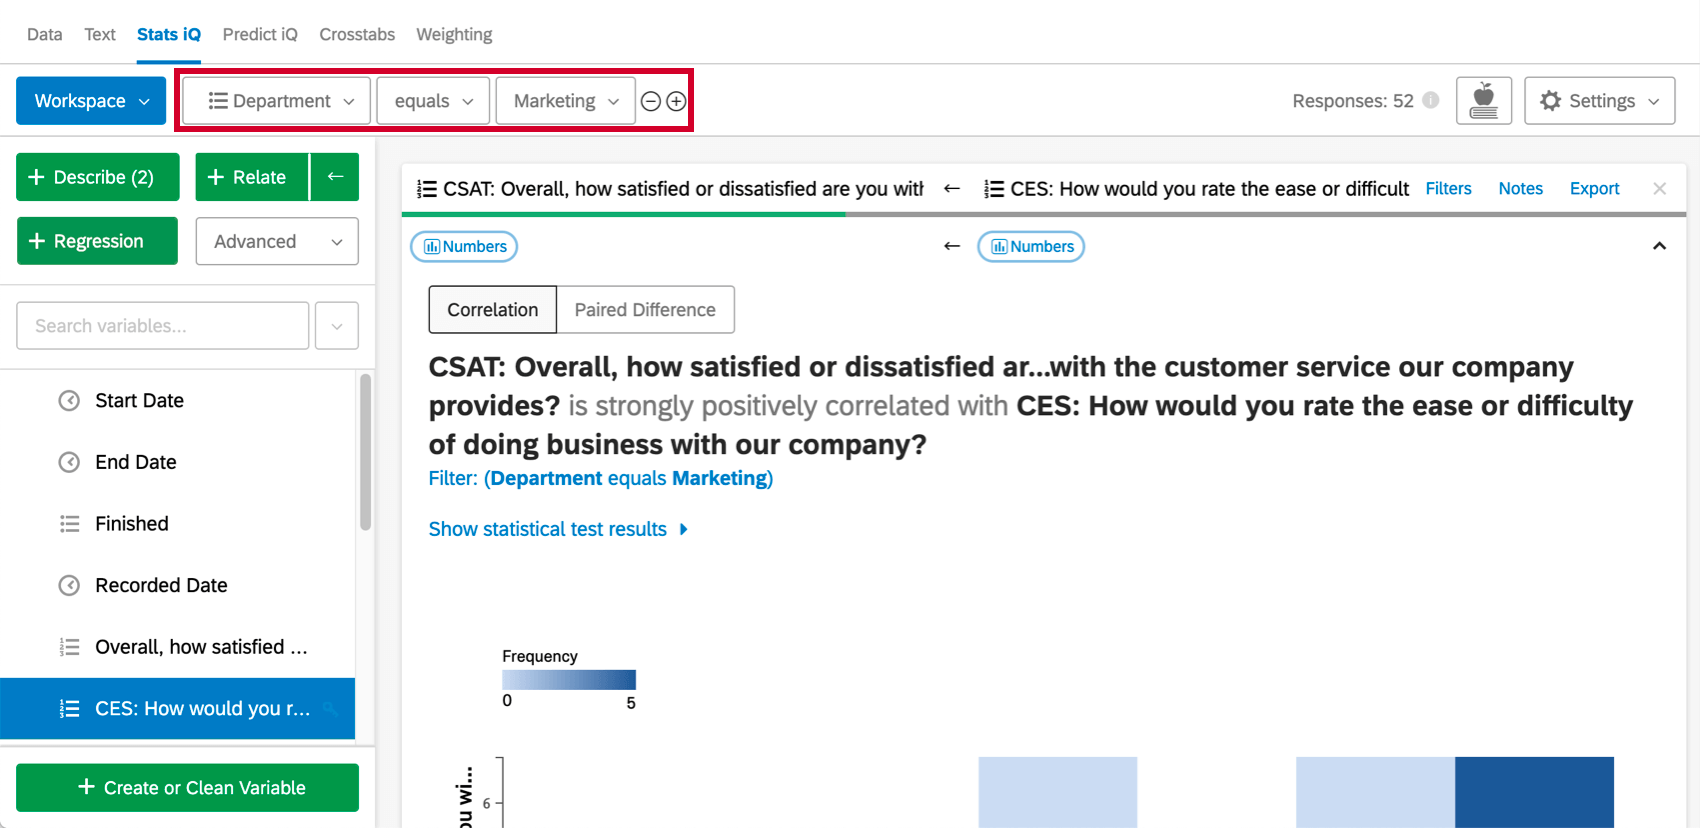
At the top of your workspace, you can add filters to narrow down your data to better fit your analytical needs.

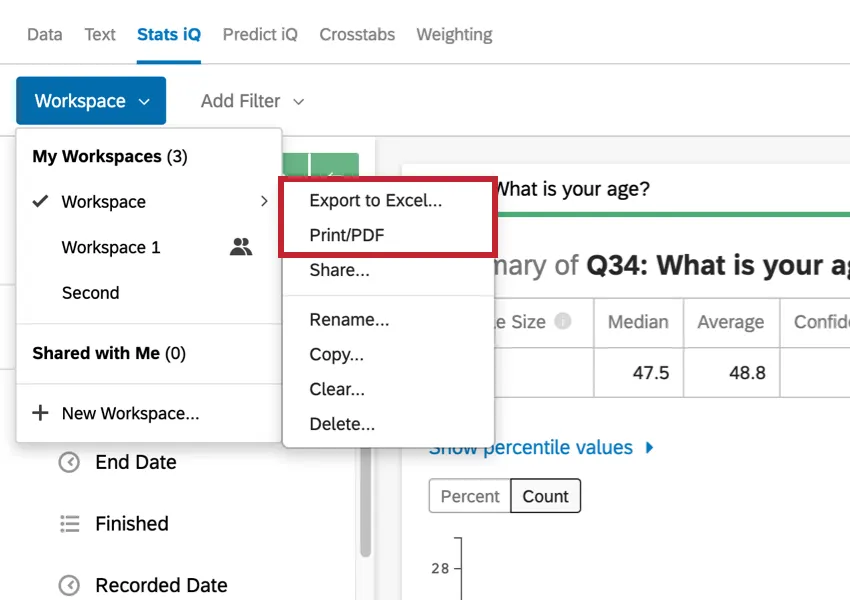
When you’re ready to export your results, you can export your workspace to Excel, or save a PDF / print it.
Select Variables
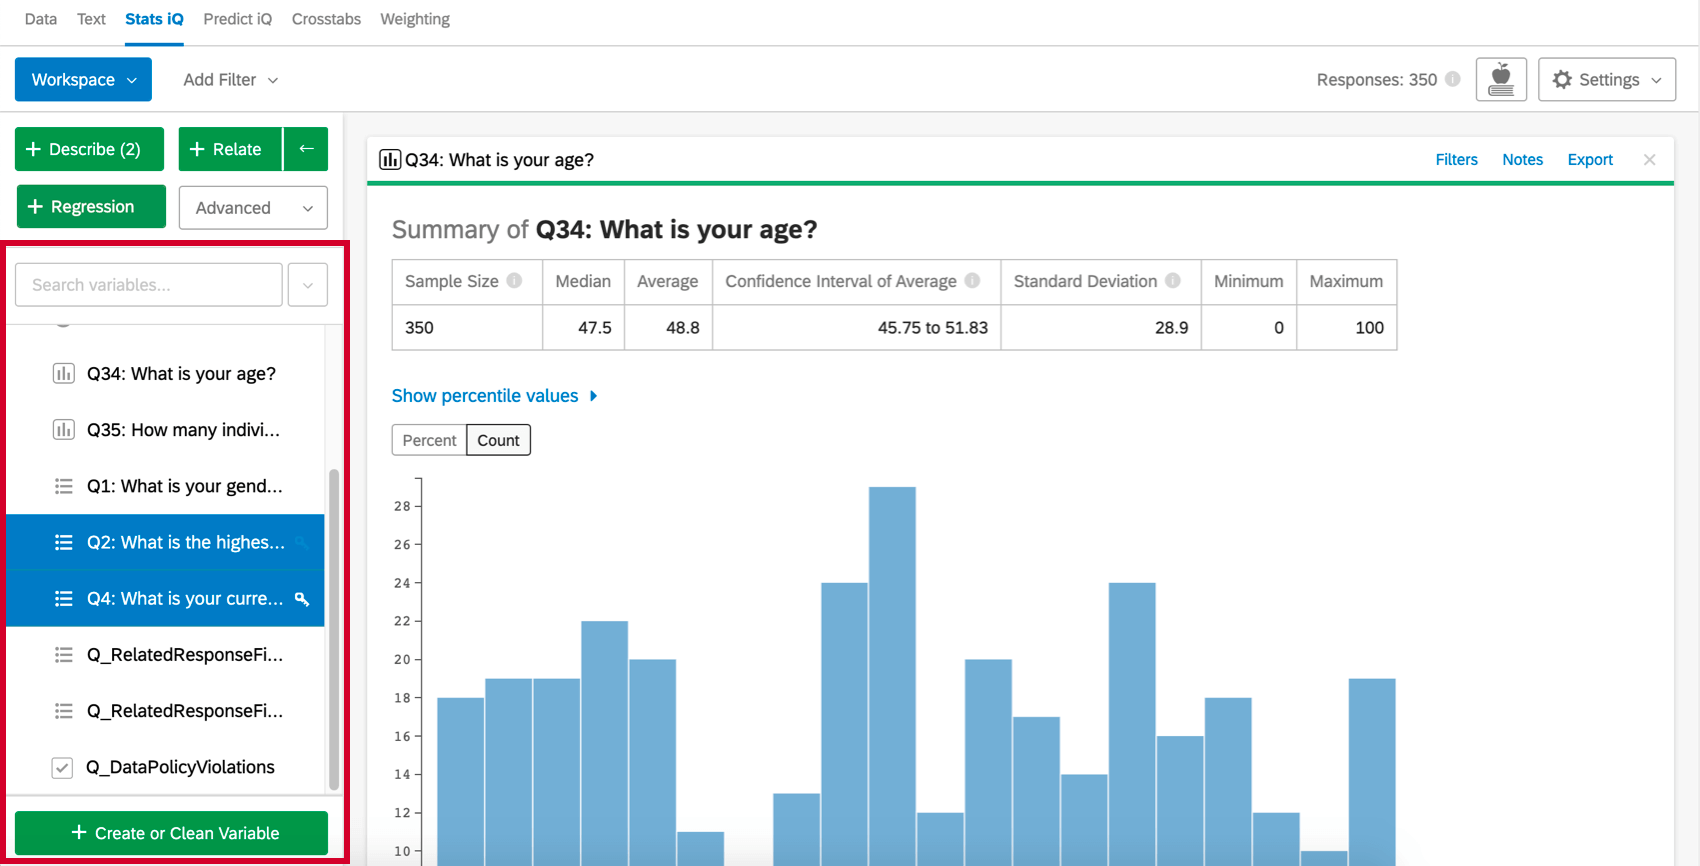
The variable pane on the left side of the workspace is populated with all of the questions from your surveys, which are then called “variables.”
The search box at the top of the variable pane allows you to search for a specific variable from your dataset. Clicking the dropdown menu to the right of the search box allows you to select variables by type, as well as select/deselect all variables in the dataset.
Select one or more variables you’d like to analyze to get started.
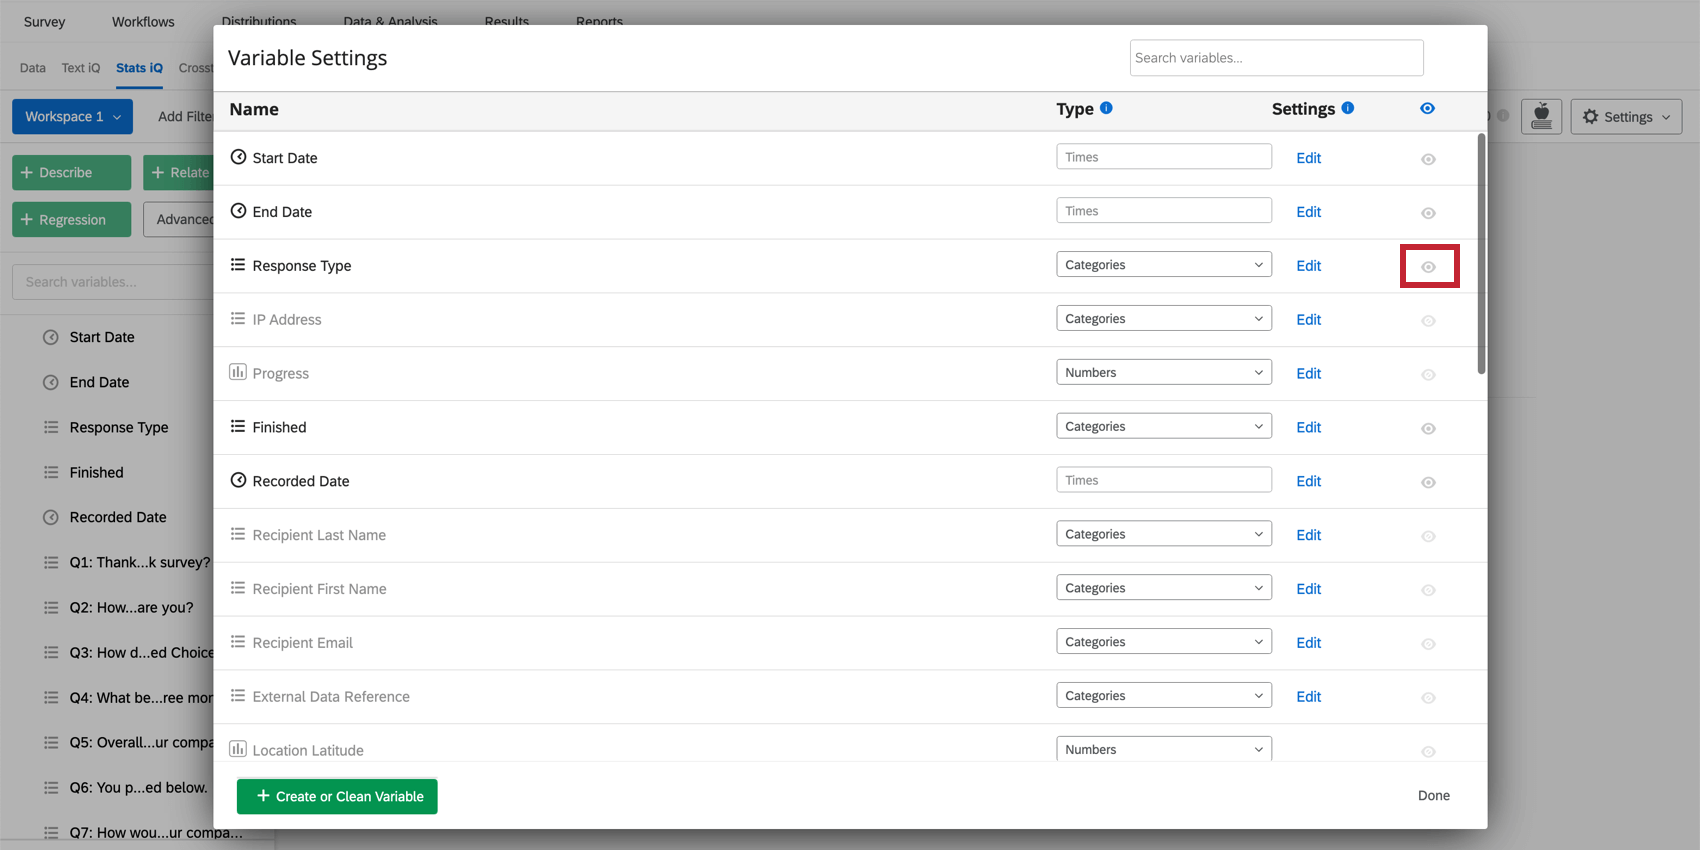
Qtip: Don’t see the variable you’re looking for? Variables could be hidden from the variable pane. To see a list of all available variables, head to the variable settings and ensure that the eye icon is enabled.

Run Analyses
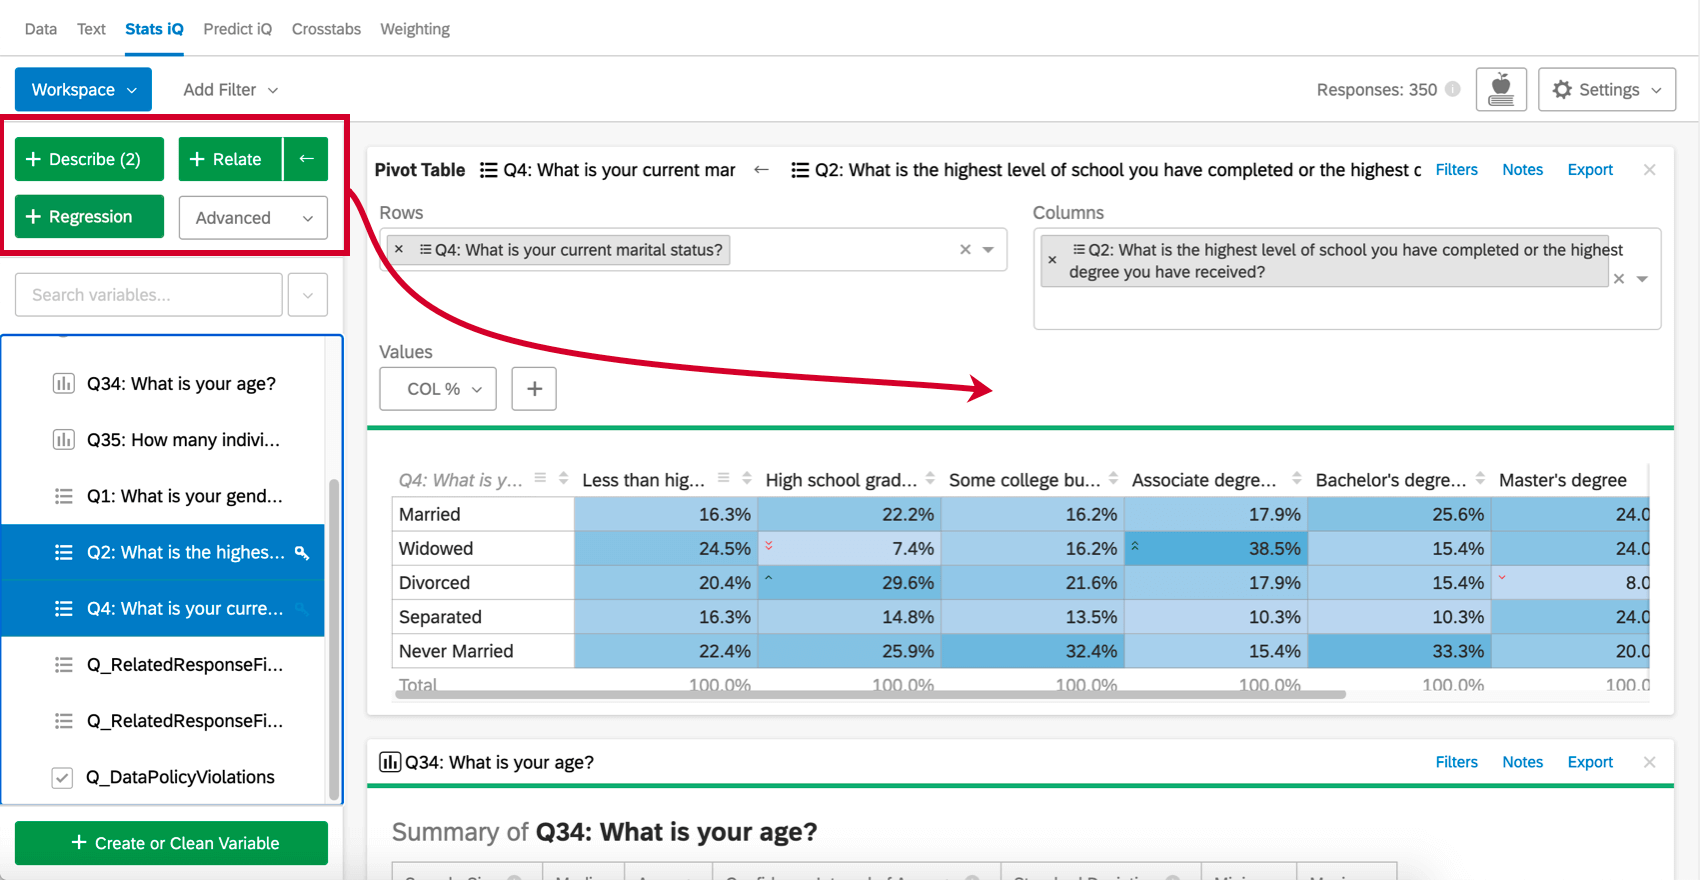
After selecting variables, select one of the four analysis buttons (Describe, Relate, Regression, or Pivot Table) to create a new analysis card in the workspace.
If you’ve already run analyses, the new analyses will appear above the old ones.
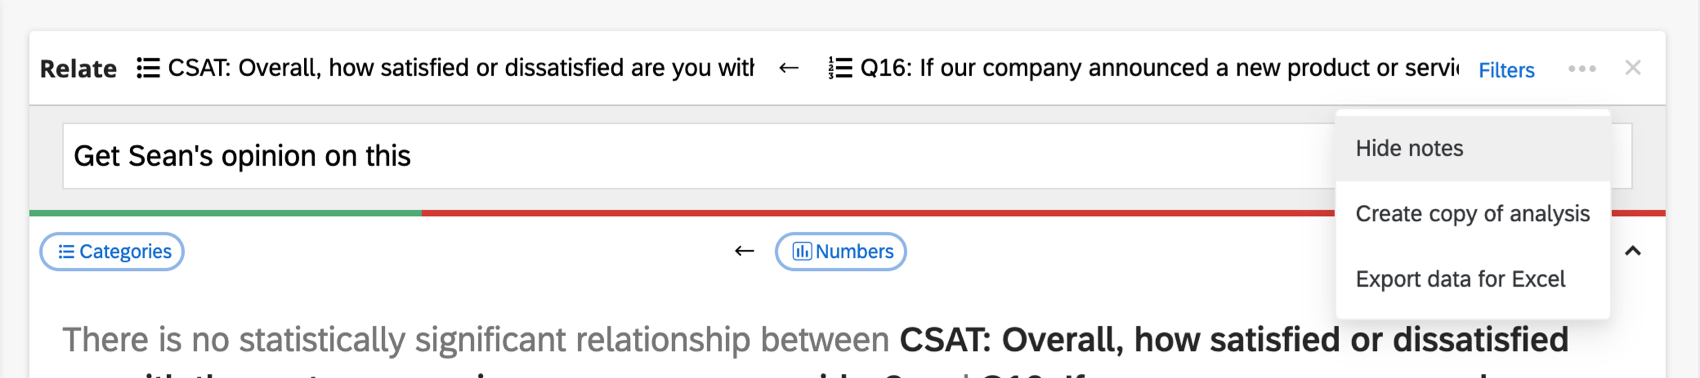
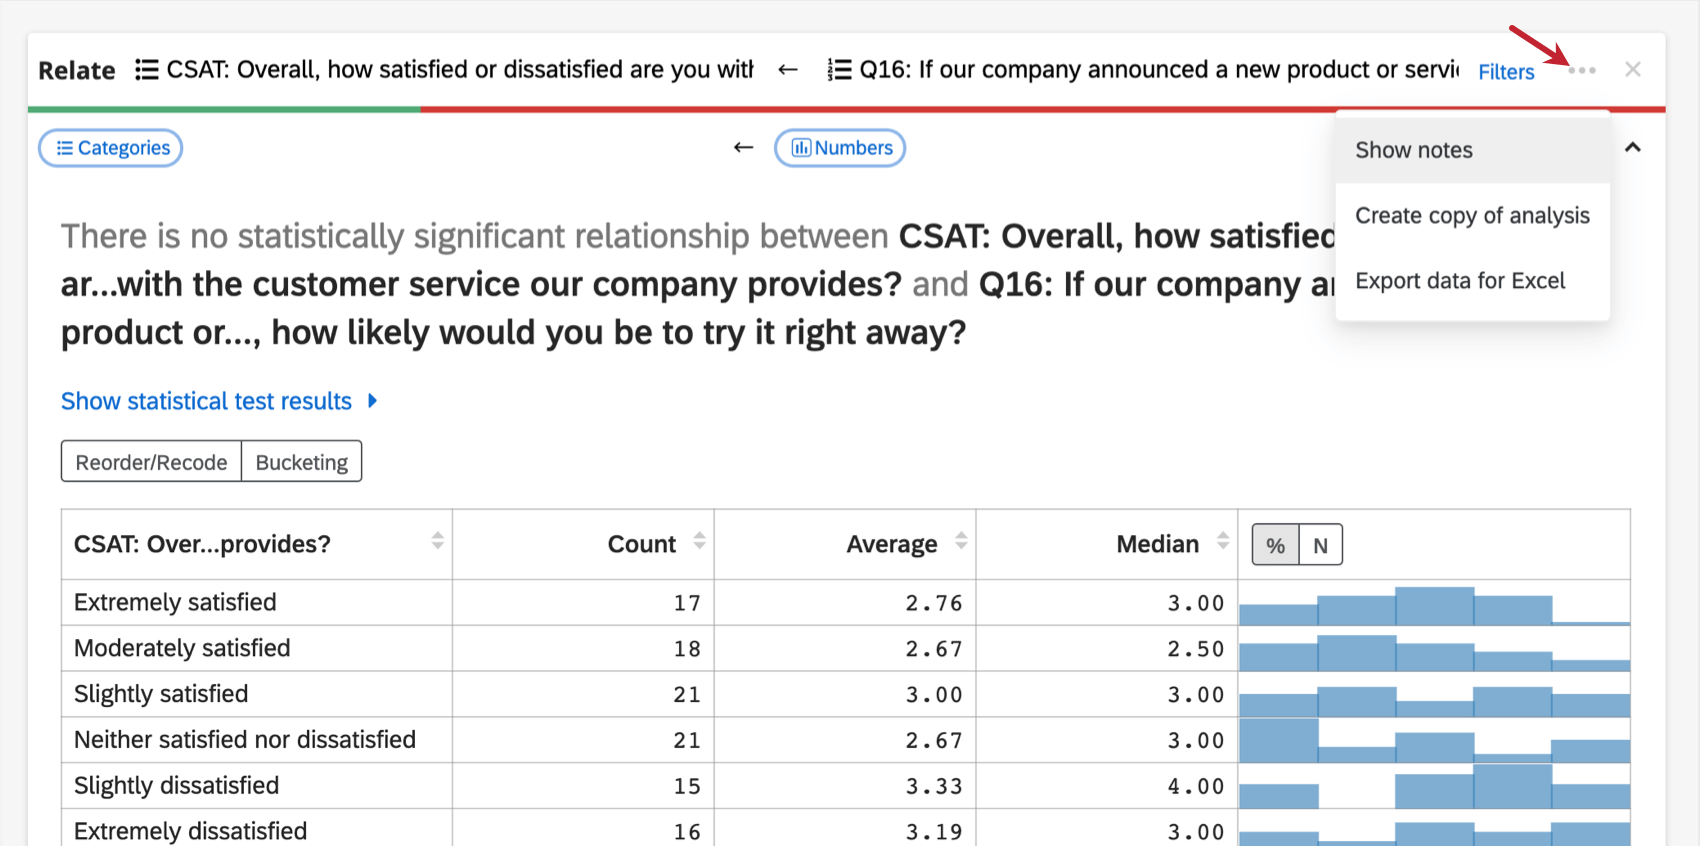
Once a card’s been created, you’ll see a button along the top with a few options underneath.
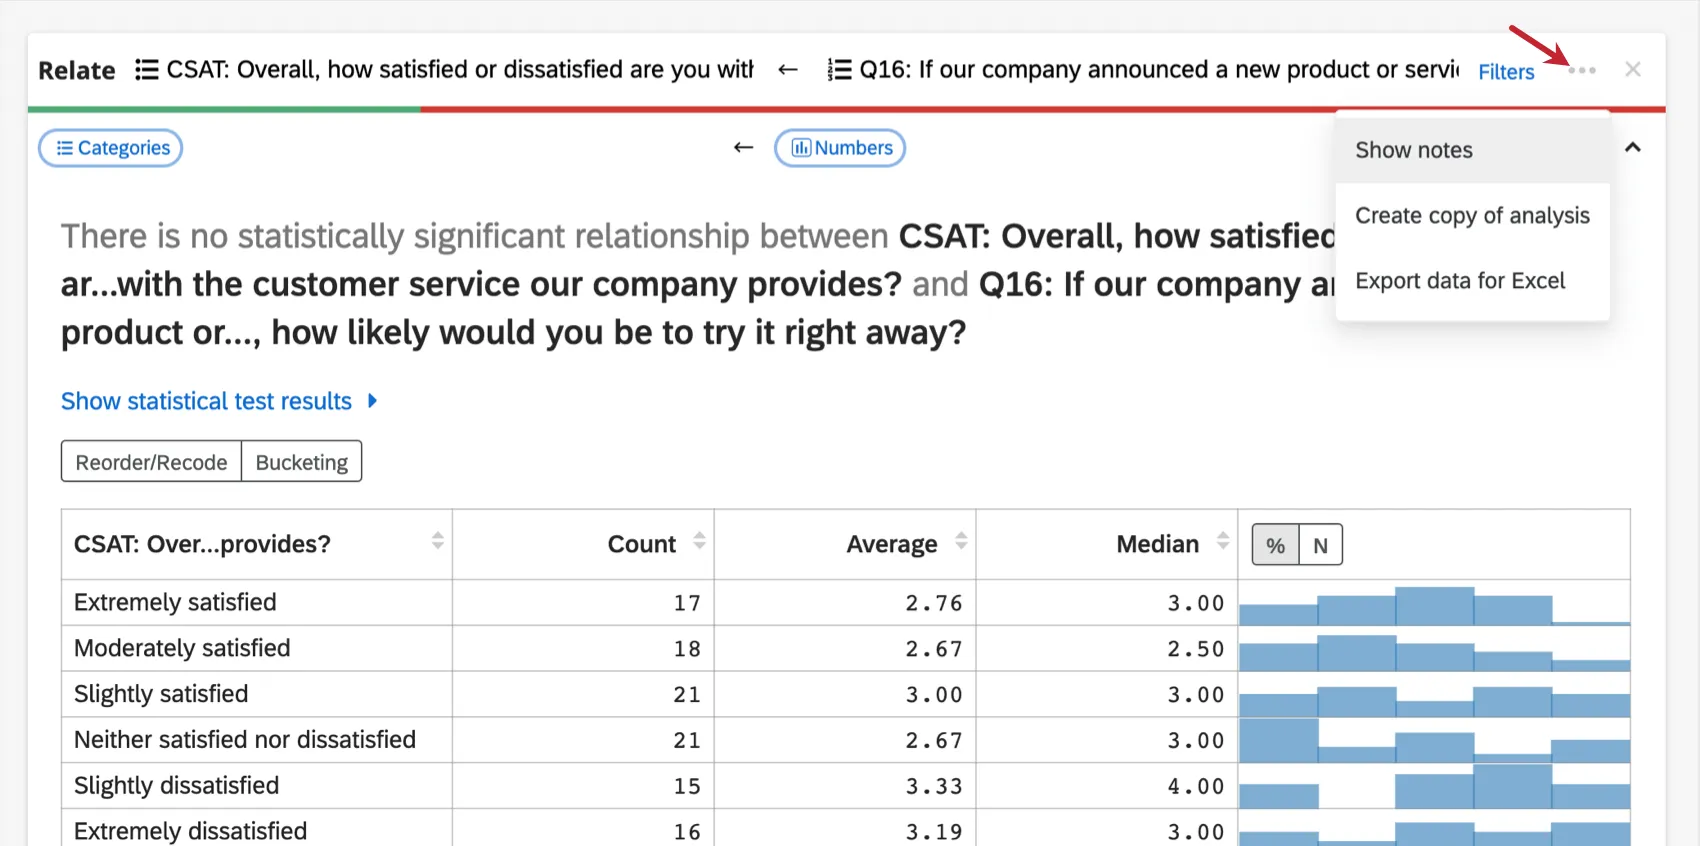
- Show notes: A field will appear where you can type notes on your analyses. Notes are saved automatically. To hide notes again, you can click the options button and then Hide Notes.
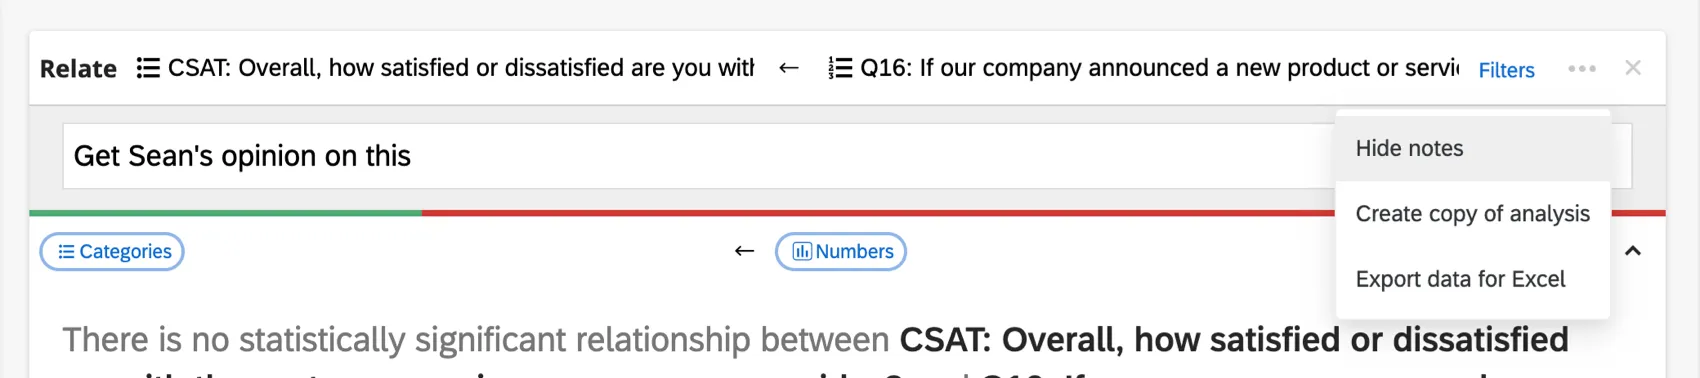
- Create copy of analysis: Copy existing analysis cards in your workspace. The duplicated card will appear above the original.
- Export data for Excel: Export the data to an Excel spreadsheet. This will be an XLSX file.
Typical Analysis Workflow
Stats iQ is a flexible tool that can be used however you’d like. However, you can find below a very common analysis workflow that you might follow to get started:
Importing Latest Data
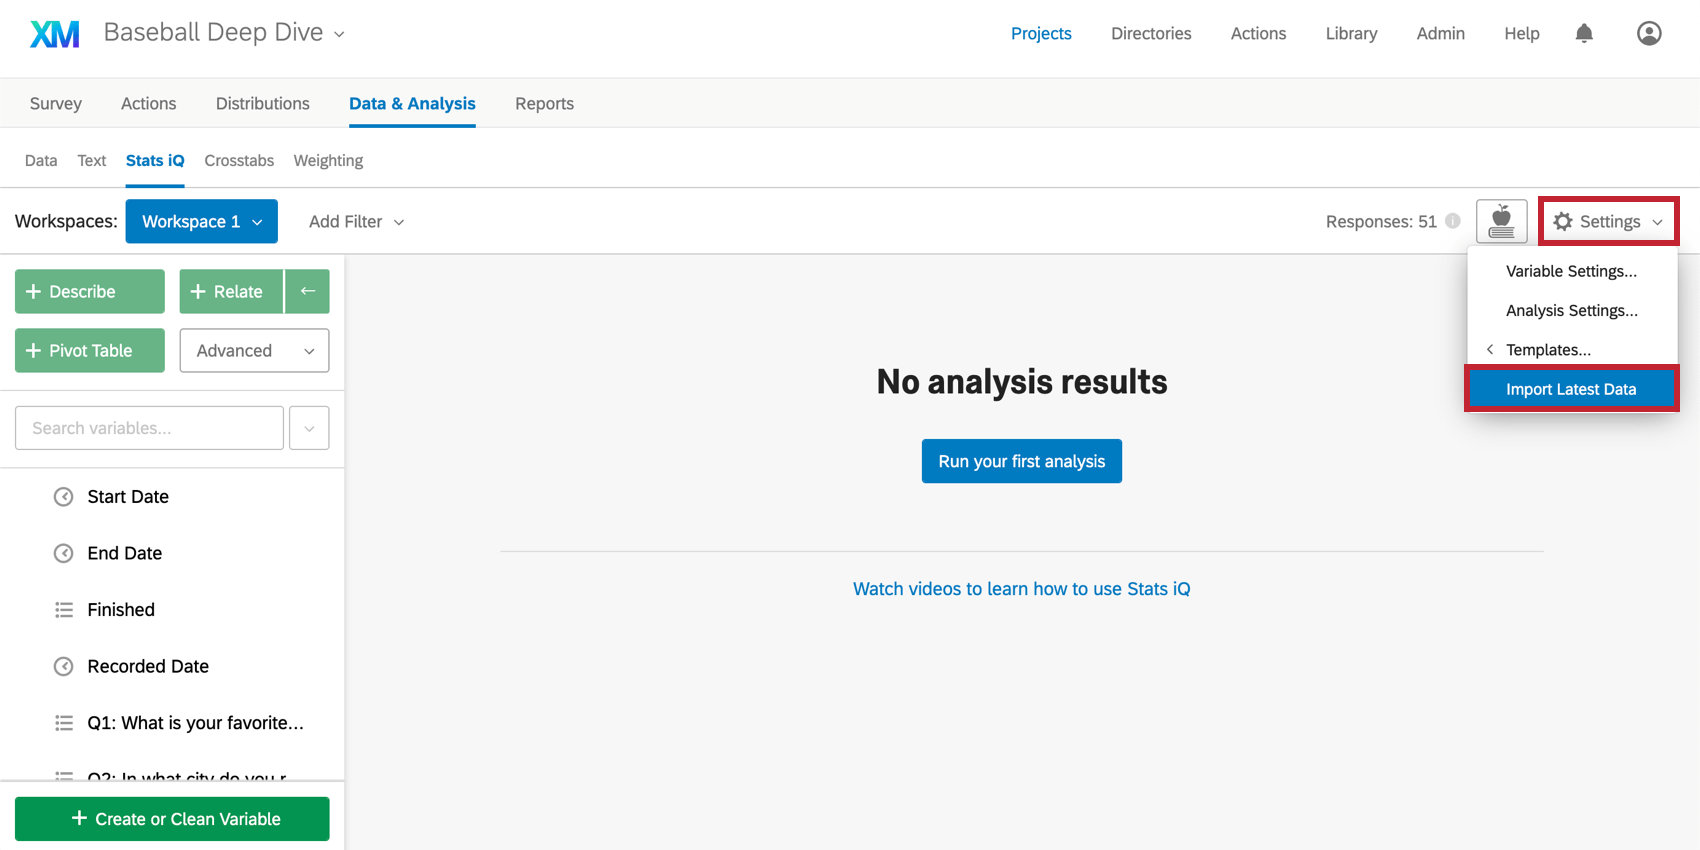
When you first access Stats iQ, all of the current responses to the survey will be imported, but you may collect more responses after that point. To import these new responses, click the Settings menu in the upper-right corner of the workspace, and select Import Latest Data.

Attention: Stats iQ and Crosstabs will not automatically import data for datasets with more than 1 million rows. For datasets of this size, click Import Latest Data to pull in any available data updates to the workspace.
Workspaces
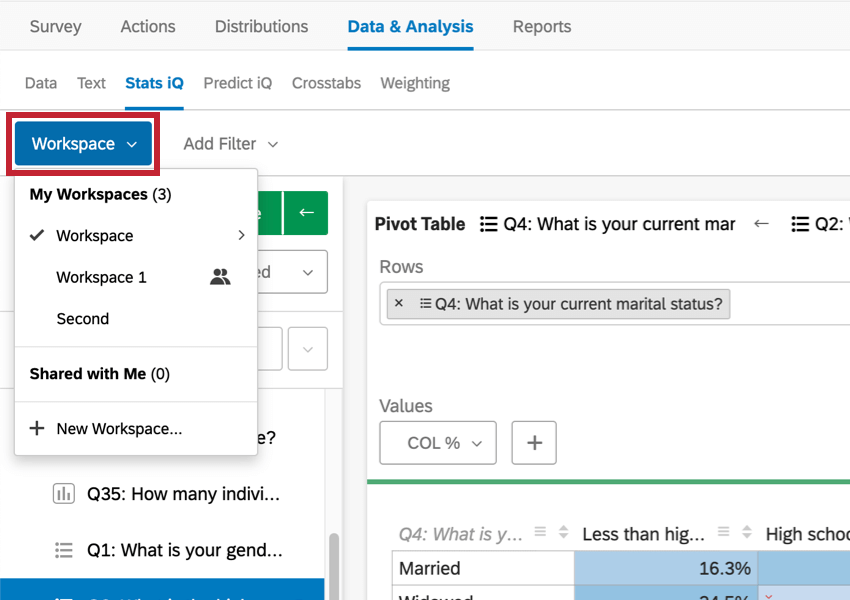
Think of workspaces like tabs in a spreadsheet, a separate area to keep related analyses. When opening Stats iQ for the first time, a new blank workspace will be created.
Click the blue box in the top-left corner titled Workspace 1 to create new workspaces or switch to another workspace, or to rename, clear, or delete the current workspace.

Qtip: You may have up to 750 cards in your workspace. If you reach this limit, an error will appear when you try to create a new card, warning you that your oldest cards will be deleted.
Variable Types
The variable types available in Stats iQ are:
- Numbers: Data made up of numeric values, e.g. a 10-point scale.
- Categories: Data made up of values that fall into categories, e.g. gender or political party.
- Times: Data made up of years (2010), dates (1/27/1984), timestamps (4/7/14 19:08), durations (3:09:02), or times of day (5:34 AM).
- Checkboxes: Data from multi-select questions (e.g., “Which of these colors do you like?”).
- ID: Data made up of unique values, e.g. student IDs. Cannot be used for analysis.
- Text: Data made up of open text fields. Cannot be used for analysis.
Using Survey Data
If you are planning on using data collected in a Qualtrics survey with Stats iQ, there are some things you must consider about the way you set up your survey.
Respondent Data and Additional Variables
There is some data you may have before conducting your survey that you want to include in the Stats iQ analysis. This information should be saved as embedded data in a contact list and added to the survey flow before you collect your data.
If you have embedded data in a query string or contact list and forget to add it before collecting your data, add the embedded data element to the survey flow and import the new responses.
You can create variables in Stats iQ, but these variables are made of other, preexisting fields. See the Logic, Bucketed, and Formula variables support pages for more details.
ANONYMITY THRESHOLDS (EX)
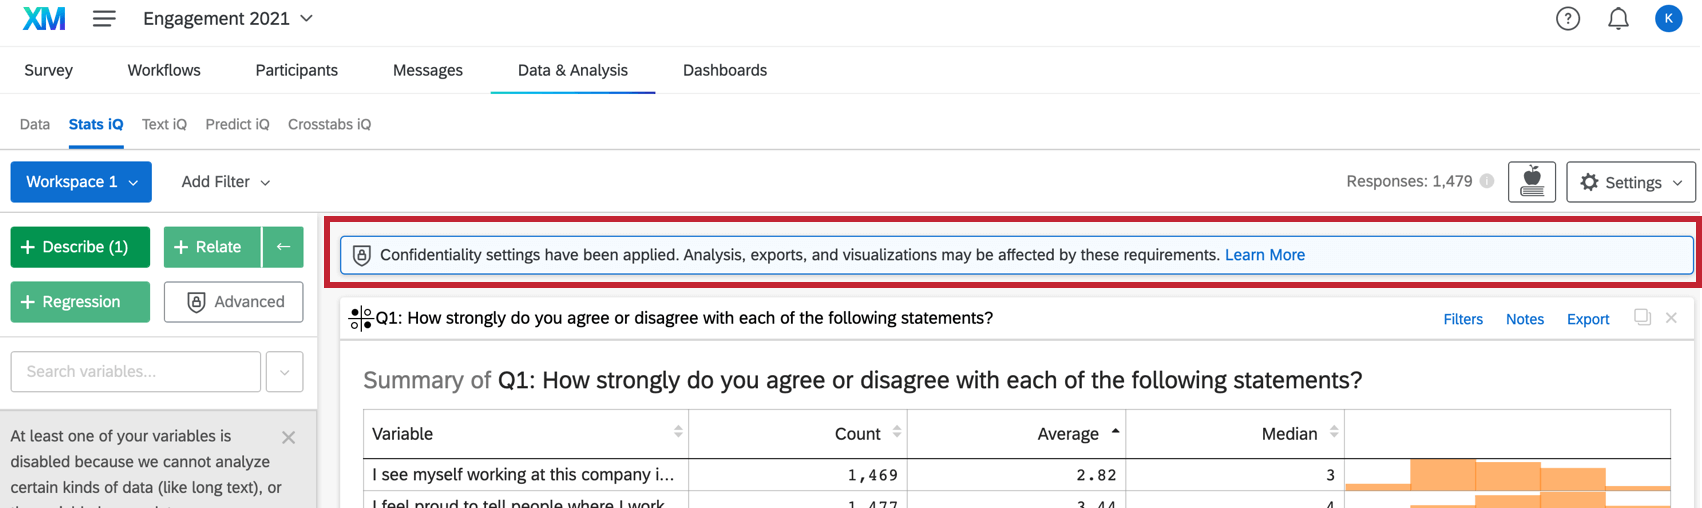
If your organization administrator has enabled Anonymity Thresholds for the entire organization, Stats iQ will automatically respect these thresholds when you run a Describe, Relate or Regression analysis on your EX dataset. The sample included in these analyses will only have data with response counts greater than the set minimum response threshold. Consequently, you may see less data in your analysis results compared to other dashboards and widgets.
Response thresholds are based on responses to data points. This means data is hidden based on the number of responses to each answer option, not the total number of responses to a question. For more examples, see Basic Anonymity.
Example:
- You ask respondents if their T-shirt size is Small, Medium, or Large.
- Your anonymity threshold is 4.
- 10 people answer the question. So when you view this question, it appears in the dashboard widget.
- However, only 1 out of 10 respondents answers “Small.”
- “Small” will be excluded from Stats iQ, because this individual choice doesn’t meet the anonymity threshold, even if the entire question does.
Qtip: Stats iQ does not support the organization wide Minimum responses needed to display comments setting.
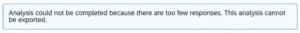
Qtip: If the sample size is less than the response threshold, analyses are unavailable in order to preserve anonymity.
Imported Data Projects
In the XM platform, data from other external sources can be uploaded and analyzed using Stats iQ using an imported data project.
Read more on the Imported Data Projects page.
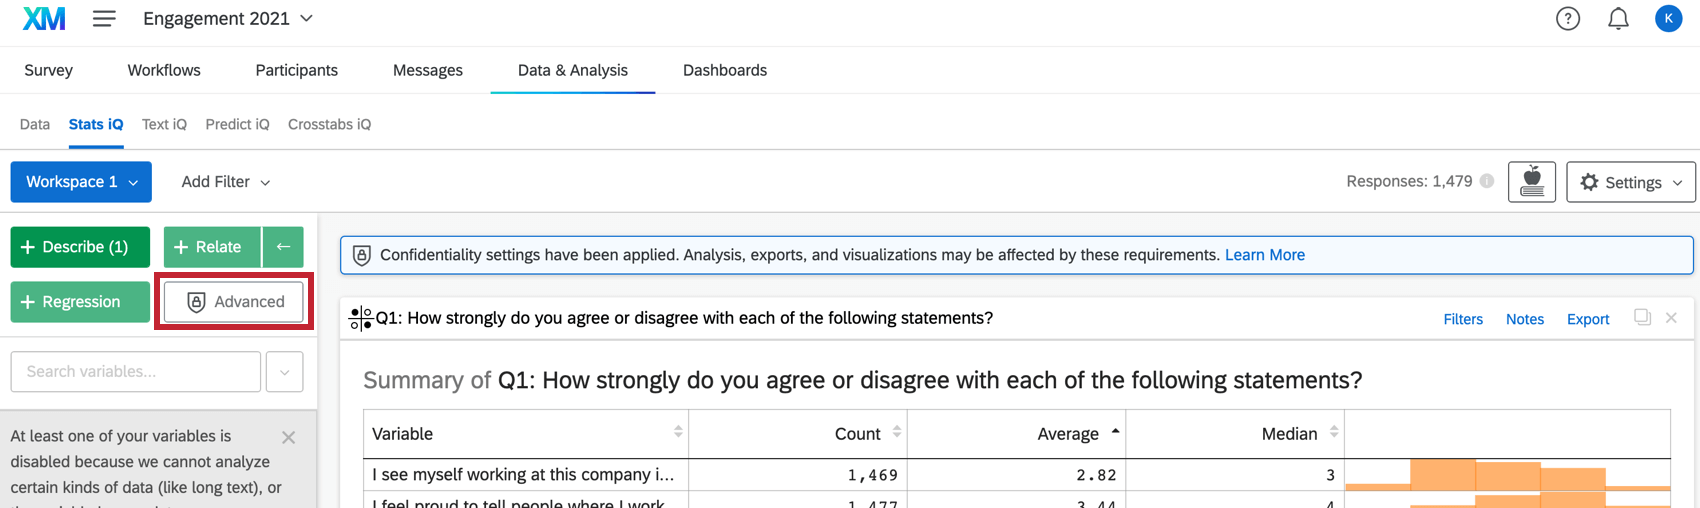
Basic vs. Advanced Stats iQ
Depending on your brand type, you might have one of two different types of Stats iQ tools. This section explains the differences in the features accessible to Basic versus Advanced Stats clients.
| Basic Stats iQ | Advanced Stats iQ | |
|---|---|---|
| Describe | Yes | Yes |
| Relate | Yes | Yes |
| Regress | Yes | Yes |
| Cluster Analysis | No | Yes |
| Pivot | No | Yes |
| R Code Cards | No | Yes |
Types of Projects Compatible with Stats iQ
Not all licenses include Stats iQ. However, if you have access to Stats iQ, it can be used with the following types of projects and their data:
Although you can technically use Stats iQ in Conjoint and MaxDiff projects, we do not recommend doing this. You cannot use conjoint and MaxDiff-specific data, only extra survey questions, like demographics and screeners.
FAQs
How do I create a new Stats iQ variable?
How do I create a new Stats iQ variable?
How can I "recode" values in Stats iQ?
How can I "recode" values in Stats iQ?
For variables that can't be directly recoded, you can recode values for in the Create or Clean Variable menu. In the Create Variable window, use the Logic method to assign numerical values to each existing value for the variable. You can either create a new variable or select Replace Existing Variable in the lower-left corner to update the variable with the new numeric values.
For more information on the Logic method for variable creation, please visit the support page on Variable Creation.
Which question types are compatible with Stats iQ?
Which question types are compatible with Stats iQ?
What are the options for analyzing my data in Stats iQ?
What are the options for analyzing my data in Stats iQ?
- Describe: Selecting a variable from the list and then clicking Describe will give you a visualization of the data contained in that variable. Use this when you would like to see how the data for a certain variable is distributed.
- Relate: Selecting two variables and then clicking Relate will run a statistical analysis of the relation between the two variables. Use this when you would like to know how strongly two variables are correlated.
- Pivot Table: Selecting two or more variables and clicking Pivot Table will create a table that displays the values of the variables as rows and columns. The cells can be set to display a variety of different information including column and row percentage, Sum, and Variance. Use this when you would like to compare the overlap between specific values of a set of variables.
- Regression: Selecting two variables and clicking Regression will give the mathematical relationship between the variables. Use this when you would like to predict values for one variable based off of the values of another.
- Cluster: Selecting two to ten demographic variables and clicking Cluster will display groupings of traits most likely to occur together, thus revealing the population segments captured in your data.
What do the different variable types mean in Stats iQ?
What do the different variable types mean in Stats iQ?
I don't know what this statistical term means. Can you tell me?
I don't know what this statistical term means. Can you tell me?
- Statistical tests: ANOVA, T-test, and Chi-squared are all statistical test that Stats iQ performs to test whether or not the relationship between two variables is significant. These tests are used to generate a P-Value.
- P-Value: This value represents the probability that the observed results would be seen if no correlation between the variables exists. A lower P-Value means more correlated data.
- Effect Size: The effect size is a measure of how large the correlation between two variables is. This is measured in different ways depending on the type of the statistical test performed. Examples are Cohen’s d, Pearson’s r, and Cramer’s v. The larger the effect size value, the more correlated the variables are.
How do I filter the data that appears in Stats iQ?
How do I filter the data that appears in Stats iQ?
How do I get my new responses to show up in Stats iQ?
How do I get my new responses to show up in Stats iQ?
I don‘t see Stats iQ in my account. How do I access Stats iQ?
I don‘t see Stats iQ in my account. How do I access Stats iQ?
How are analysis cards ordered in my Stats iQ Workspace?
How are analysis cards ordered in my Stats iQ Workspace?
What’s Stats iQ? / Where’s Statwing?
What’s Stats iQ? / Where’s Statwing?
I don't have the tab described on this page! What do I do?
I don't have the tab described on this page! What do I do?
What if I receive the message “No data is available”?
What if I receive the message “No data is available”?
How can I stay up to date on new Qualtrics features?
How can I stay up to date on new Qualtrics features?
To access these release notes, you need an XM Community account. These accounts are free for any users with a Qualtrics account. This support page contains information for how to register an XM Community account.
Once you're logged into the XM Community, head over to the Weekly Product Updates Introduction Post. This post contains all the information you need to get started with subscribing to product updates!
What is the largest size dataset I can analyze?
What is the largest size dataset I can analyze?
That's great! Thank you for your feedback!
Thank you for your feedback!