What is benchmarking?
The act of benchmarking is really the act of collecting standardised metrics and seeing how they compare against others.
Sometimes that’s comparing them to internal metrics that denote past performance, and sometimes it’s against competitors in your industry. Or, when it comes to things like customer satisfaction, benchmarking can also be done across industries.
The metrics in question could focus on your company’s performance from a financial perspective (where you’re looking at things like sales performance, revenue, or profit), or product-based, where you’re comparing your offerings against your competitors as part of a broader competitor analysis. Or they could be experiential, with the latter being what we’re going to focus on here.
That means tracking things like customer satisfaction, the customer experience, and customer loyalty. These customer data points are often standardised with metrics like NPS (Net Promoter Score) and CSAT (Customer Satisfaction).
Finding a competitive advantage
Without benchmarking, either against your past performance or against competitors (or both), any performance data you collect isn’t much use. After all, you might have (as an example) an NPS that seems good by itself, but if every competitor in your industry boasts a higher score… That changes things and makes it clear you’re failing where your competitors are not.
So the reason we do benchmarking is to provide context and to identify areas for improvement. For instance, if your benchmarking highlights that your competitors are all offering a better customer experience than you either overall or at a certain part of the customer journey, with higher NPS or CSAT scores, then you know where to invest more time. In that way, you can look at benchmarking as a kind of market research, and a key part of business transformation.
Likewise, if you find that similar products in the market cost less than yours, then you know you’ll need to change your pricing structure. The key to successful benchmarking is in performing it regularly and using your findings to make proactive changes. As you make those changes, be sure to compare your scores as you go, that way you can be confident your strategy to improve the customer experience is working.
Learn about benchmarking with Qualtrics CustomerXM
How are customer experience benchmarks different?
Whereas benchmarking financial results is all about hard, quantitative data that’s easy to compare in its native form, customer experience benchmarks are ultimately determined by customer feedback. But the thing is, it’s impossible to compare opinions, which is why we turn to industry-standard methods to turn those opinions into metrics that can be compared like-for-like.
Customer Experience Benchmarks in a nutshell:
Customer Experience Benchmarks provide you with the tools to compare your performance delivering customer experience against your industry peers, the market, or best-in-class providers using measures such as NPS benchmarks or CSAT — giving you the insight you need to close competitive customer experience gaps and prioritise strategic initiatives.
Here are a few customer experience metrics that we can use as benchmarks against others (and our past selves):
1. NPS
Net Promoter Score is a survey question that helps give customer loyalty and retention a numerical value, by asking customers a single question:
- How likely is it that you would recommend [Organisation X] to a friend or colleague?
Customer feedback is recorded as a rating between 0 (not at all likely) and 10 (extremely likely), and, depending on their response, customers fall into one of three categories to establish NPS performance:
- ‘Promoters’ respond with a score of 9 or 10
- ‘Passives’ respond with a score of 7 or 8
- ‘Detractors’ respond with a score of 0 to 6.
You then calculate your NPS using the formula ‘NPS = % of Promoters ( — ) % of Detractors’ – ignoring the passive percentage.
That gives you your NPS value, on a scale from -100 to +100. Scores that are closer to -100 indicate that there are more detractors overall, while -100 tells us there are no Promoters at all. Scores that are closer to 100 tell us that there are more Promoters overall, which means you’re doing well.
But note, NPS is not the be-all-and-end-all. It’s best used as part of a much wider CX program, of which NPS plays its part.
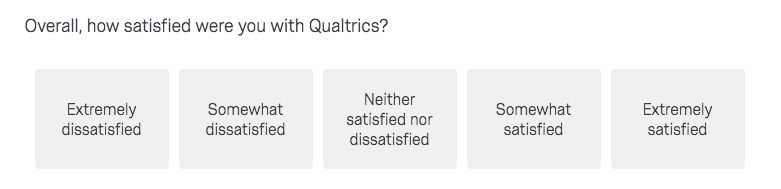
2. CSAT
CSAT is short for ‘Customer Satisfaction’ and, much like NPS, is an industry-standardised KPI – this time tracking how satisfied customers are. CSAT is measured by acquiring customer feedback on variations of a core question:
- ‘How would you rate your overall satisfaction with the [goods/service] you received?’
Your respondents then use the following 1 to 5 scale:
- Very unsatisfied
- Unsatisfied
- Neutral
- Satisfied
- Very satisfied
Those answers can be averaged out to form what’s called a Composite Customer Satisfaction Score, but CSAT scores are more usually expressed as a percentage: 100% being total customer satisfaction, 0% total dissatisfaction.
To calculate this percentage, only responses of 4 ‘satisfied’ and 5 ‘very satisfied’ are included. You divide one against another, and then times by a hundred, like so:
(Number of satisfied customers (4 and 5)/ Number of survey responses) x 100 = % of satisfied customers.
The difference between Net Promoter Scores and CSAT is that the latter is usually focused on the experience around a product or service, whereas the former is more focused on the overall relationship the customer has with the organisation as a whole. Typically, CSAT also deals with recent, specific interactions, whereas NPS can be seen as a more ‘long-term’ metric.
3. CES
CES is short for ‘Customer Effort Score’ and seeks to quantify the effort customers feel they need to exert to achieve things like purchases or seeking help.
CES surveys typically ask the question, “on a scale of ‘very easy’ to ‘very difficult, how easy was it to interact with [company name]” – and this is expressed as a percentage. The idea is that customers are more loyal to a product or service that is easier to use.
The score is calculated by taking the total sum of your responses and dividing it by the number of responses.
Customer churn is a key business driver and customer effort is a great indicator of loyalty. This measurement is quick and easy for customers to evaluate, and it’s simple to implement across different service and survey channels.
4. DX Metrics
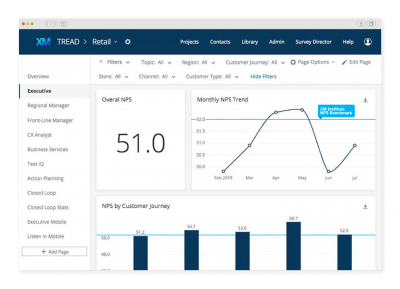
At Qualtrics, we’ve developed Digital Experience (DX) benchmarking metrics to combine all the above and traditional digital metrics into one rock-solid set of KPIs.
DX goes beyond just CSAT, CES, and NPS by honing in on the effort and sentiment behind those interactions at every point of the customer journey. For example, whereas a standard ‘digital’ metric might look at how many people visited your site or looked at a certain page, Digital Experience metrics enable a reading on the customer experience for that interaction.
Using research from the Qualtrics XM Institute annual XMI Customer ratings, we’ve identified three key drivers of the digital experience – and have found that improving these drives huge improvements in revenue:
- Emotion: As measured by customer satisfaction (CSAT) scores, how do customers feel about your brand?
- Effort: As measured by customer effort scores (CES), how easy is it for customers to complete their tasks on your digital platform?
- Success: As measured by task completion, how successful are customers’ experiences with your brand?
Experience is different
All told, taking customer feedback and using it to run benchmarking is inherently different from benchmarking something like raw sales data. It’s looking to compare metrics that describe experiential values like customer satisfaction, with the end goal being to uncover valuable insight that points to areas of the customer journey that can be improved.
This benchmarking should, if acted upon correctly, result in greatly enhanced customer loyalty and retention.
What are the benefits of customer experience benchmarking?
As is the case with spending time digging into any analytics, the benefits come from using what you learn to close experience gaps, make proactive changes, and – ultimately – improve your customer experience metrics.
The good news is, the ROI for investing and prioritising customer experience benchmarking can be huge. Exactly what can uncover and adapt with benchmarking will vary from organisation to organisation, but our recent XMI Customer Ratings research highlighted a couple of key drivers for change:
Emotion drives lifetime value
Our cross-industry research shows that ‘extremely satisfied’ customers spend 37% more than ‘extremely dissatisfied customers. In effect, that means that brands with experiences that resonate emotionally – through loyalty programs, rewards, and better personalisation – will enjoy more sales.
Effort affects basket size
Customers who have an extremely easy experience spend up to 23% more with each transaction than those who have an extremely difficult experience, which means that keeping on top of the experience of using your digital touchpoints has never been more important.
What both of these statistics show is this: if you’re benchmarking customer experience and find that your organisation is lagging behind your competitors, there’s proven ROI in addressing that part of your business. Importantly, benchmarking again in the future will then show you how you’ve improved, and you can track sales in relation to that improvement to see how much difference your actions have made.
Customer experience benchmarking: How does it work?
Ok, so you’re ready to start benchmarking. How do you get started? Well, in broad terms, there are generally five steps to successful benchmarking:
1. Choose your metrics
That might be financial performance, customer experience, or products and services.
2. Competitive, or internal?
Decide whether you’re benchmarking against your past performance or your competitors
3. Data collection
Gather your data using standardised metrics and tools
4. Compare
Compare your findings against your chosen benchmarks (internal or competitive)
5. Act on findings
Use your findings to identify and act upon areas for improvement.
But let’s get more practical than that. If you’re looking to turn data into insight and gain a competitive advantage in the process, you’ll need to implement benchmarking software into your tech stack.
With the right software, you’ll be able to choose and input your desired metrics to a benchmark editor, which will then help you compare and contrast your organisation’s data against others’ across industries.
These benchmarking capabilities should be part of any good customer experience program or software suite – including the Qualtrics Customer Experience Manager.
The Qualtrics difference
With Qualtrics, you don’t just get access to a leading customer experience program; you also unlock a market-leading benchmark editor that can help you understand your place in the market – at every stage of the customer journey, and across all your digital channels.
Alongside those custom benchmarking investigations, you’ll also benefit from access to syndicated market research reports and industry benchmarking studies that uncover the hidden value in building on your DX metrics and improving the customer experience.
Our network of partners spans every industry, including service and benchmark providers who are known for their deep industry knowledge and experience – meaning you’ll get deeply personal, actionable insights as well as industry-wide benchmarking with the same level of detail and the same valuable insight.
Make the science of benchmarking simple with Qualtrics