
For a survey to provide usable data, it’s essential that responses are honest and unbiased.
The reason for this is simple: biased, misleading and dishonest responses lead to inaccurate information that prevents good decision-making.
Indeed, if you can’t get an accurate overview of how respondents feel about something — whether it’s your brand, product, service or otherwise — how can you make the right decisions?
Now, when people respond inaccurately or falsely to questions, whether accidentally or deliberately, we call this response bias (also known as survey bias). And it’s a major problem when it comes to getting accurate survey data.
So how do you avoid response bias? In this guide, we’ll introduce the concept of response bias, what it is, why it’s a problem and how to reduce response bias in your future surveys.
Free eBook: The qualitative research design handbook
Response bias definition
As mentioned, response bias is a general term that refers to conditions or factors that influence survey responses.
There are several reasons as to why a respondent might provide inaccurate responses, from a desire to comply with social desirability and answer in a way the respondent thinks they ‘should’ to the nature of the survey and the questions asked.
Typically, response bias arises in surveys that focus on individual behaviour or opinions — for example, their political allegiance or drinking habits. As perception plays a huge role in our lives, people tend to respond in a way they think is positive.
Using the drinking example, if a respondent was asked how often they consume alcohol and the options were: ‘frequently, sometimes and infrequently’, they’re more likely to choose sometimes or infrequently so they’re perceived positively.
However, dishonest answers that don’t represent the views of your sample can lead to inaccurate data and information that gradually becomes less useful as you scale your research.
Ultimately, this can have devastating effects on organisations that rely heavily on data-driven research initiatives as it leads to poor decision-making. It can also affect an organisation’s reputation if they’re known for publishing highly accurate reports.
Types of Response bias
While ‘response bias’ is the widely understood term for biased or dishonest survey responses, there are actually several different types of response bias. Each one has the potential to skew or even ruin your survey data.
In this section, we’ll look at the different types of response bias and provide examples:
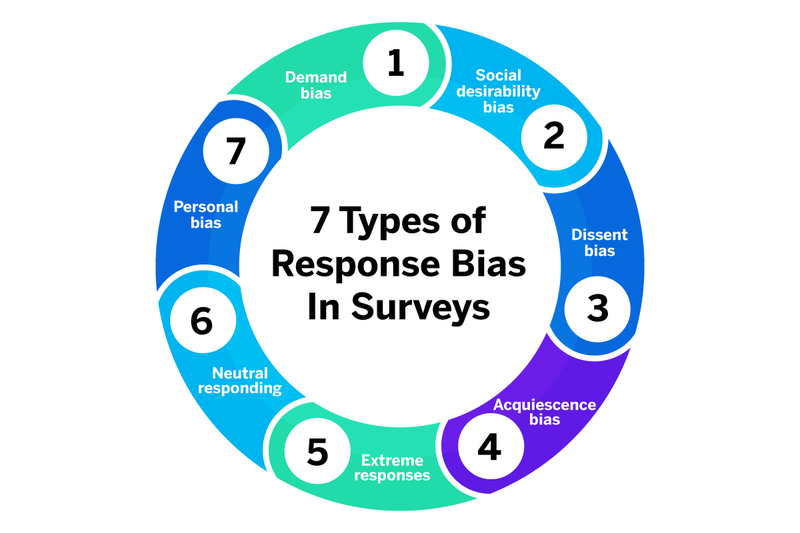
Social desirability bias
Social desirability bias often occurs when respondents are asked sensitive questions and — rather than answer honestly — provide what they believe is the more socially desirable response. The idea behind social desirability bias is that respondents overreport ‘good behaviour’ and underreport ‘bad behaviour’.
These types of socially desirable answers are often the result of poorly worded questions, leading questions or sensitive topics. For example, alcohol consumption, personal income, intellectual achievements, patriotism, religion, health, indicators of charity and so on.
In surveys that are poorly worded or leading, questions are posed in a way in which encourages respondents to provide a specific answer. One of the most obvious examples of a question that will trigger social desirability bias is: “Do you think it’s appropriate to drink alcohol every day?”
Even if the respondent wants to answer honestly, they’ll respond in a more socially acceptable way.
Social desirability bias also works with affirmative actions. For example, asking someone if they think everyone should donate part of their salary to charity is guaranteed to generate a positive response, even if those in the survey don’t do it.
Non-response bias
Non-response bias — which is sometimes called late response bias — is when people who don’t respond to a survey question differ significantly from those who do respond.
This type of bias is inherent in analytical or experimental research, for example, those assessing health and well-being.
Non-response bias is tricky for researchers, precisely because the experiences or outcomes of those who don’t respond could wildly differ to the experiences of those who do respond. As a consequence, the results may then over or underrepresent a particular perspective.
For example, imagine you’re conducting psychiatric research to analyse and diagnose major depression in a population. The behaviours of those who do respond could be vastly different to those who don’t, but you end up overreporting one perspective from your sample.
In this example, there’s no way to make an accurate assumption or fully understand what the survey data is telling you.
Demand bias
Demand bias (demand characteristics or sometimes called survey bias) occurs when participants change their behaviours or views simply because they assume to know or do know the research agenda.
Demand characteristics are problematic because they can bias your research findings and arise from several sources. Think of these as clues about the research hypotheses:
- The title of the study
- Information about the study or rumours
- How researchers interact with participants
- Study procedure (order of tasks)
- Setting
- Tools and instruments used (e.g. cameras, apparel)
All of these demand characteristics place hidden demands on participants to respond in a particular way once they perceive them. For example, in one classic experiment published in Psychosomatic Medicine, researchers examined whether demand characteristics and expectations could influence menstrual cycle symptoms reported by study participants.
Some participants were informed of the purpose of the study, while the rest were left unaware. The informed participants were significantly more likely to report negative premenstrual and menstrual symptoms than participants who were aware of the study’s purpose.
Survey research methods can also determine the risks of common demand characteristics, e.g. structured interviews when the responder is physically asked survey questions by another person, or when participants take part in group research.
As a result of the above, rather than present their true feelings, respondents are more likely to give a more socially acceptable answer — or an answer which they believe is what the researchers want them to say.
Extreme response bias
Extreme response bias occurs when the respondents answer a question with an extreme view, even if they don’t have an extreme opinion on the subject.
This bias is most common when conducting research through satisfaction surveys. What usually happens is respondents are asked to rank or rate something (whether it’s an experience, the quality of service or a product) out of 5 points and choose the highest or lowest option, even if it’s not their true stance.
For example, with extreme response bias, if you asked respondents to rate the quality of service they received at a restaurant out of 5, they’re much more likely to say 5 or 1, rather than give a neutral response.
Similarly, a respondent might strongly disagree with a given statement, even if they have no strong feelings towards the topic.
Extreme responding can often occur due to a willingness to please the person asking the question or due to the wording of the question, which triggers a response bias and pushes the respondent to answer in a more extreme way than they otherwise would.
For example: “We have a 5* star customer satisfaction rating, would you agree that we provide a good service to customers?”
Neutral responses
As you can guess, neutral response bias is the opposite of extreme response bias and occurs when a respondent simply provides a neutral response to every question.
Neutral responses typically occur as a result of the participant being uninterested in the survey and/or pressed for time. As a result, they answer the questions as quickly as possible.
For example, if you’re conducting research about the development or HR technology but send it to a sample of the general public — it’s highly unlikely that they’ll be interested and will therefore aim to complete the survey as quickly as possible.
This is why it’s so important that your research methodology takes into consideration the sample and the nature of your survey before you put it live.
Acquiescence bias
Acquiescence bias is like an extreme form of social desirability, but instead of responding in a ‘socially acceptable’ way, respondents simply agree with research statements — regardless of their own opinion.
To put it simply, acquiescence bias is based on respondents’ perceptions of how they think the researcher wants them to respond, leading to potential demand effects. For example, respondents might acquiesce and respond favourably to new ideas or products because they think that’s what a market researcher wants to hear.
Similarly, depending on how a question is asked or how an interviewer reacts, respondents can infer cues as to how they should respond.
You can read more about acquiescence bias here.
Dissent bias
Dissent bias, as its name suggests, is the complete opposite of acquiescence bias in that respondents simply disagree with the statements they’re presented with, rather than give true opinions.
Sometimes, dissent bias is intentional and representative of a respondent’s views or (more likely) their lack of attention and/or desire to get through the survey faster.
Dissent bias can negatively affect your survey results, and you’ll need to consider your survey design or question wording to avoid it.
Voluntary response bias
Voluntary response biases in surveys occur when your sample is made of people who have volunteered to take part in the survey.
While this isn’t inherently detrimental to your survey or data collection, it can result in a study that over-reports on one aspect as you’re more likely to have a highly opinionated sample.
For example, call-in radio shows that solicit audience participation in surveys or discussions on controversial topics (e.g. abortion, affirmative action). Similarly, if your sample is composed of people who all feel the same way about a particular issue or topic, you’ll overreport on specific aspects of that issue or topic.
This type of voluntary bias can make it particularly difficult to generate accurate results as they tend to over-represent one particular side.
Cognitive bias
Cognitive bias is a subconscious error in thinking that leads people to misinterpret information from the world around them, affecting their rationality and accuracy of decisions. This includes trying to alter facts to fit a personal view or looking at information differently to align with predetermined thoughts.
For example, a customer who has had negative experiences with products like yours is most likely to respond negatively to questions about your product, even if they’ve never used it.
Cognitive biases can also manifest in several ways, from how we put more emphasis on recent events (recency bias) to irrational escalation — e.g. how we tend to justify increased investment in a decision, especially when it’s something we want. Empathy and social desirability are also considered cognitive biases as they alter how we respond to questions.
Having this response bias in your data collection can lead you to either over or under-report certain samples, influencing how and what decisions are made.
Free eBook: The qualitative research design handbook
How to reduce, avoid and prevent response bias
Whether it’s response bias as a result of overrepresenting a certain sample, the way questions are worded or otherwise, it can quickly become a problem that can compromise the validity of your study.
Having said that, it’s easily avoidable, especially if you have the correct survey tools, methodologies, and software in place. And Qualtrics can help.
With Qualtrics CoreXM, you have an all-in-one solution for everything from simple surveys to comprehensive market research. Empower everyone in your organisation to carry out research projects, improve your research quality, reduce the risk of response bias and start generating accurate results from any survey type.
Reach the right respondents wherever they are with our survey and panel management tools. Then, leverage our data analytics capabilities to uncover trends and opportunities from your data.
Plus, you can use our free templates that provide hundreds of carefully created questions that further reduce response bias from your survey and ensure you’re analysing data that will promote better business decisions.