how to make this question | XM Community
Solved

how to make this question

  • 15 August 2018
  • 4 replies
  • 44 views

For each of the following items, select the answer that best describes how you feel about your relationship. Base your responses on your first impressions and immediate feelings about the item.
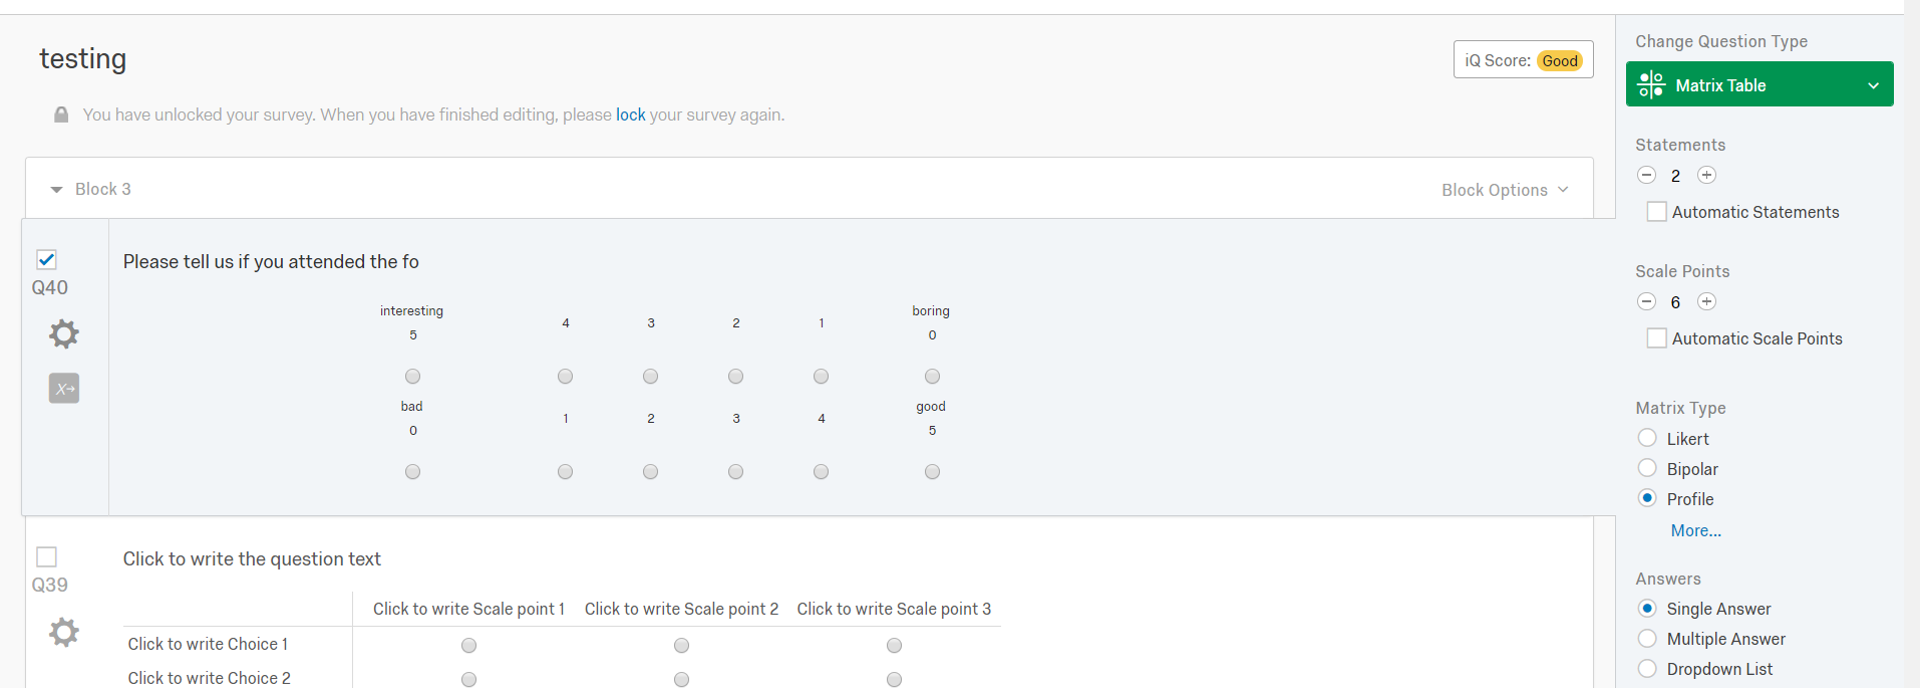
11. INTERESTING 5 4 3 2 1 0 Boring
12. Bad 0 1 2 3 4 5 Good
13. Full 5 4 3 2 1 0 Empty
14. Sturdy 5 4 3 2 1 0 Fragile
15. Discouraging 0 1 2 3 4 5 Hopeful
16. Enjoyable 5 4 3 2 1 0 Miserable
icon

Best answer by bstrahin 15 August 2018, 14:34

View original

4 replies

Userlevel 6
Badge +6
I would do this as one question per line. For the question text I would just use " " entered into the HTML area as it will create a blank space and not require there to be anything.

Breaking it into separate questions has several advantages both for reporting and for display, since they are in many ways different questions anyway.

Then I would use multiple choice, and use horizontal. For labels, just add the text before the number, and then add a `<br />` between to put the number on the next line.

Example: https://qualtricssfi.az1.qualtrics.com/jfe/preview/SV_42uRaILaxWAYYe1?Q_SurveyVersionID=current&Q_CHL=preview

QSF attached.
Userlevel 7
Badge +33
You can do this by matrix question also where in rows will be your relationship parameters and in column it will be scale from 5 to 0 and you have to repeat and change scale text after each parameter.
Userlevel 7
Badge +38
You can use the Matrix table with Matrix type Profile. This will allow you to have a different scale between each line. I got the line brake between the word and number by doing "interesting <br/>5". The statements are spaces or delete the wording and if a pop up box comes up asking if yo want to delete the statement say no and it will delete the words without getting rid of the row.

I would caution that if you are running means you won't be able to change the order of the scale in the recode value so you the flop between 5-0 and 0-5 will only be displayed to your respondent and not record that way in the data, which can make statistics confusing.!
Userlevel 7
Badge +27
This seems like a bipolar matrix with six scale points. I don't know why you need the numbers at all. They just make it confusing, especially since the order is switched.

Leave a Reply