
Creating a Data Model (CX)
What's on this page
About Creating a Data Model
The data modeler can be used to create datasets where you flexibly combine data from multiple types of sources. The data modeler has nearly all of the features the data mapper does, but with some additional advanced functionality, such as left outer data joins. The data modeler also makes it easier than ever to map not just survey data, but data from your directory, tickets, and other data sources, while allowing you to combine them in the same dataset.
Qtip: Confused about what datasets are vs. data sources? Not sure how to tell the data mapper and modeler apart? See Key Terms for more information.
Incompatible Features
The following features aren’t compatible with data models yet:
- Page templates
- Date time segmentation
- Spotlight Insights
- Org hierarchies
- XM Respondent Funnel page templates (XM Respondent Funnel dataset is compatible)
- Distribution reporting
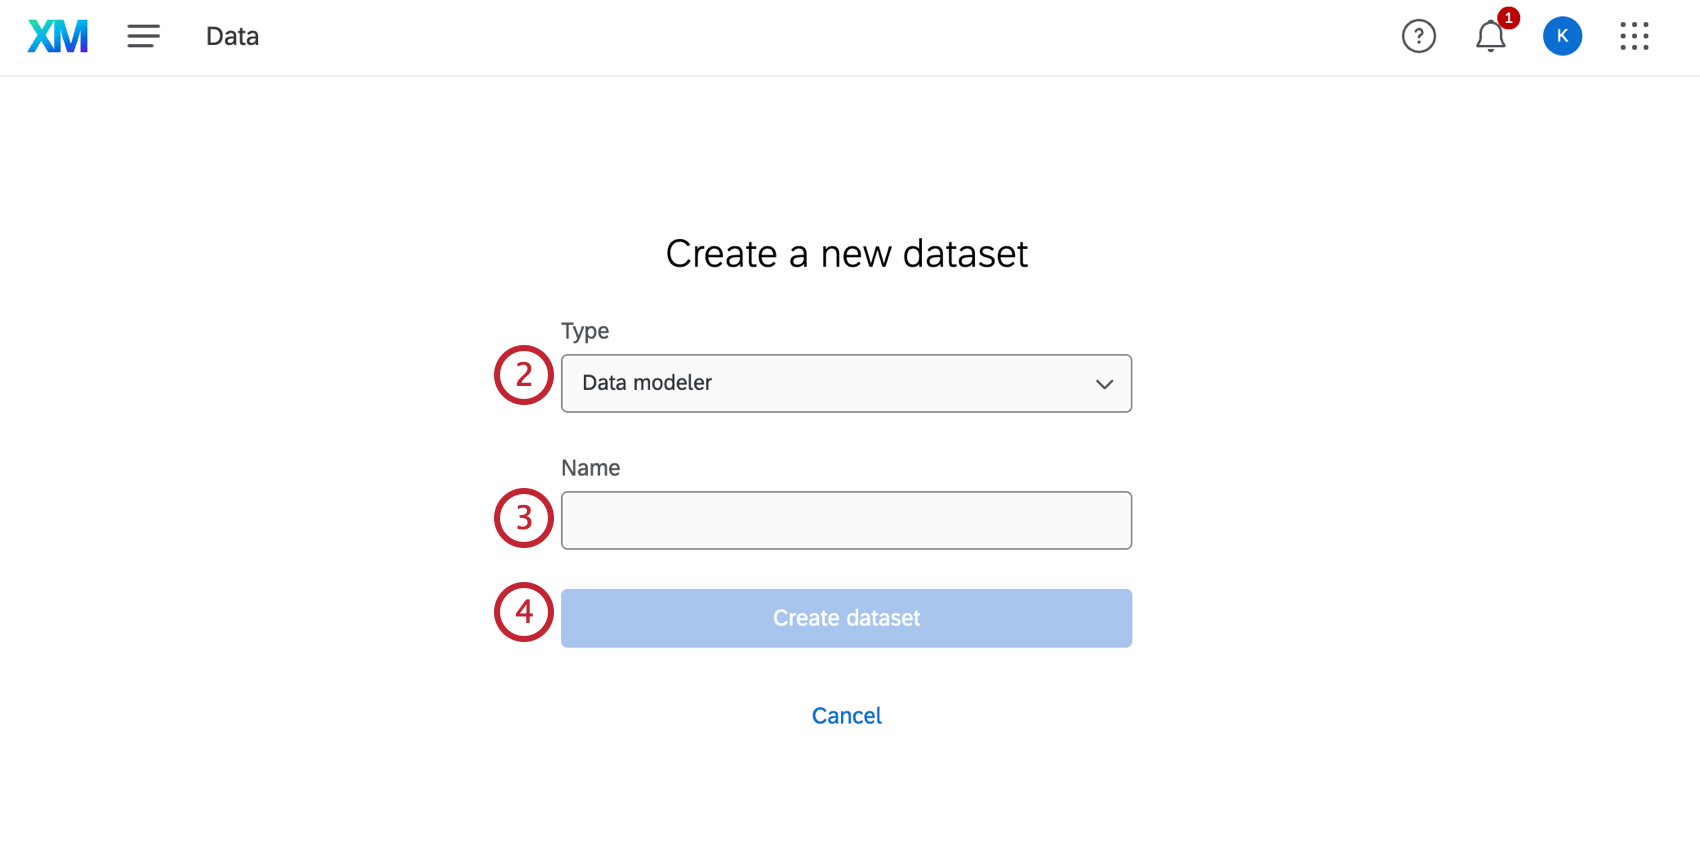
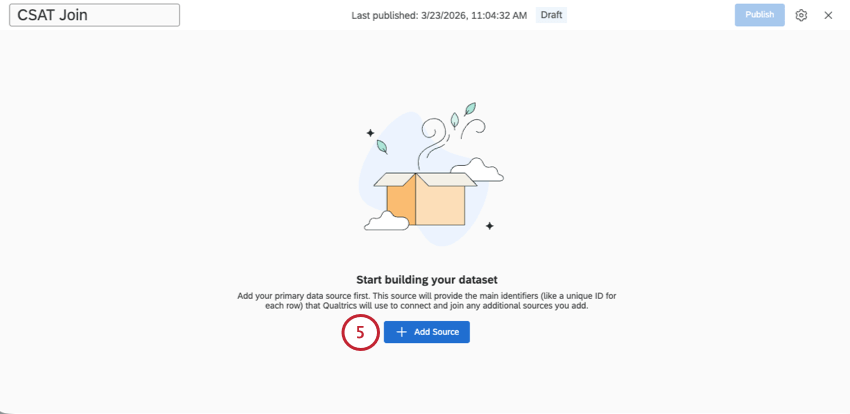
Creating a Dataset with the Data Modeler
Qtip: Only tickets created from surveys can be mapped with the data modeler. You need to be either the owner of the associated survey or a collaborator with both Edit and View reports access.
Attention: Only projects you have access to will appear in this list. If any projects aren’t showing up, make sure you have been invited to collaborate on them.
Attention: Legacy distribution reporting is not compatible with the data modeler.
Qtip: It can be useful to add the same source more than once if you plan to perform separate unions and joins in your dataset. You cannot create a union or a join with multiple copies of the same source.
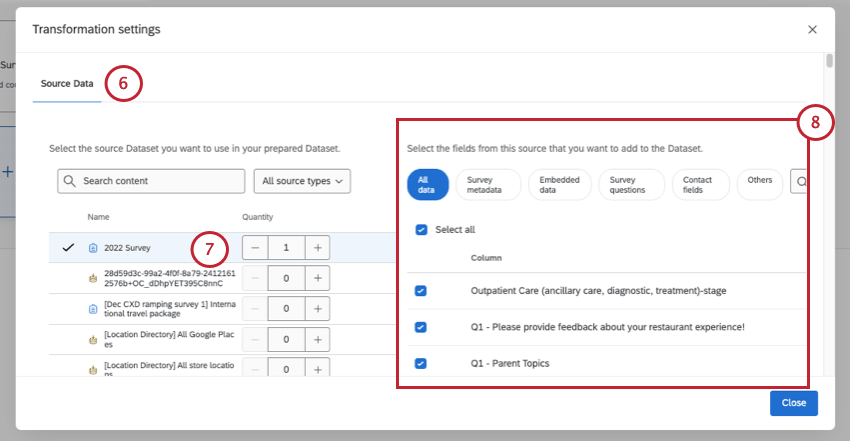
Qtip: When selecting fields to include in your data model, think about which fields will be important when analyzing your data. Fields that are commonly included are survey questions, important metadata, and the field you plan on using to join your datasets.
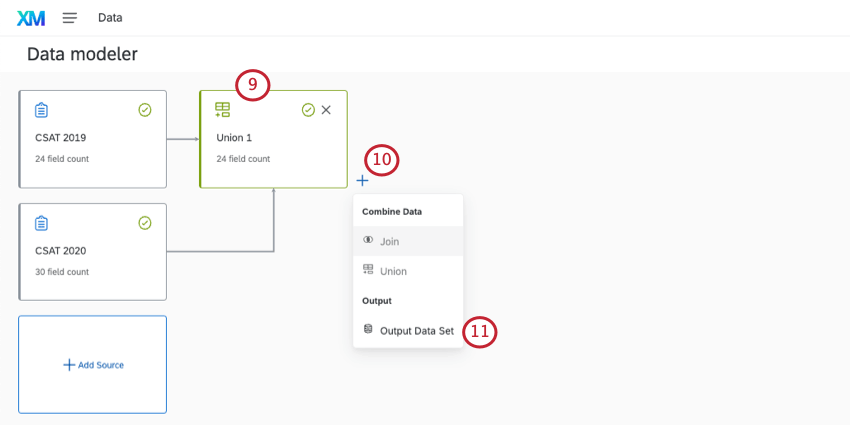
Qtip: If you want to report on 2 different surveys with 2 years worth of feedback data, you’ll most likely use a union. If you want to create a list of all of the customers who reached out across those years, you’d use a join.
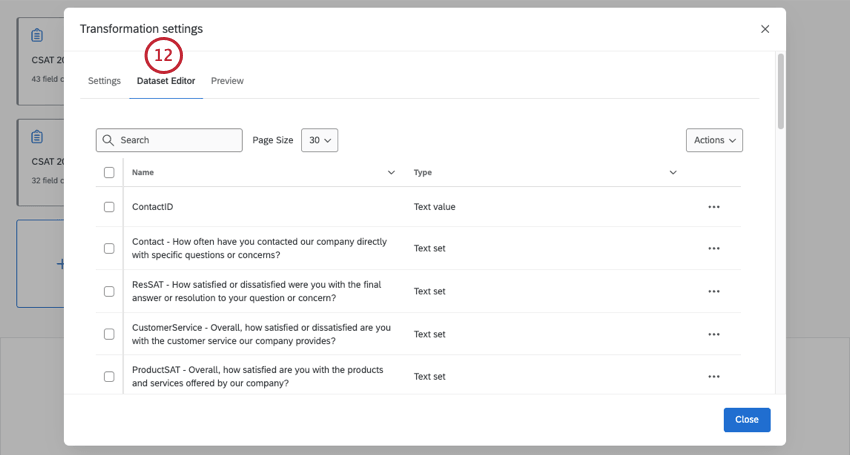
Qtip: If needed, you can always edit these fields later.
Qtip: Click Close to finish previewing your output dataset.
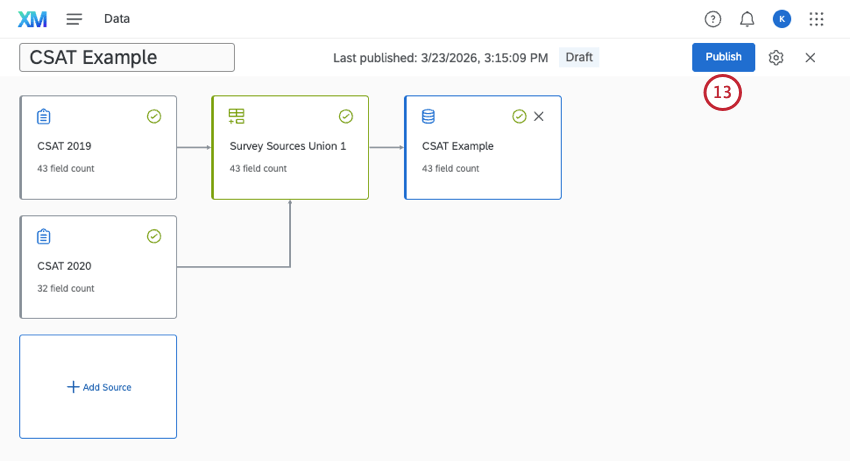
Qtip: Publishing will take you back to the Data page. See how to add your dataset to a dashboard.
Types of Sources Available in Data Models
A dataset gets its data from specific sources in Qualtrics. Data sources are often surveys, but there are many other sources you can add to data models. The following source types are available:
- DX Sources: Sessions from Digital Experience Analytics.
- Directories: XM Directory contacts. Qtip: Directory data requires additional setup before it can be used in your data models. See Enabling the Contact Dataset.

- External Datasources: Everything that doesn’t fit into the other categories listed here, such as imported data projects, segment membership data, and some older reputation management projects. Qtip: Segment data requires additional setup before it can be used in your data models. See Using Segment Data in Dashboards.
- Locations: Location directories.
- Reviews: Reputation Management programs.
- Surveys: Survey projects.
- Tickets: Tickets created from a tickets task in a survey. This does not include all tickets in the brand. Qtip: Only tickets created from surveys can be mapped with the data modeler. You need to be either the owner of the associated survey or a collaborator with Edit or View reports.
Attention: You can only use projects you have access to as data sources. If any projects aren’t showing up, make sure you have been invited to collaborate on them.
Qtip: Not all Qualtrics projects can be used as data sources in CX data models. For example, while surveys are compatible, Engagement projects are not. If you’d like to create data models with employee project data, see Employee Journey Analytics instead.
Continuous vs. Periodic Dataset Updates
For the most part, data model datasets update continuously. That means that as you collect more data in your sources, your dashboard receives that data accordingly, including all unions and joins and field remappings. Continuous updates ensure your dashboard’s data stays current.
However, certain configurations in your data model can make it update periodically instead. Periodic updates exist to lighten the load on your dataset and ensure accuracy when particularly complex setups are involved. However, to get everything correct, the updates are slower.
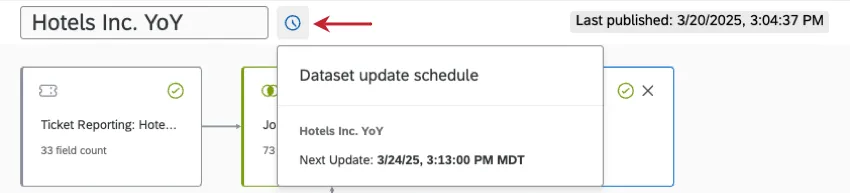
Periodic datasets generally update with new data weekly. Periodic datasets cannot receive new data before the weekly update, even after recaching. This schedule cannot be customized.
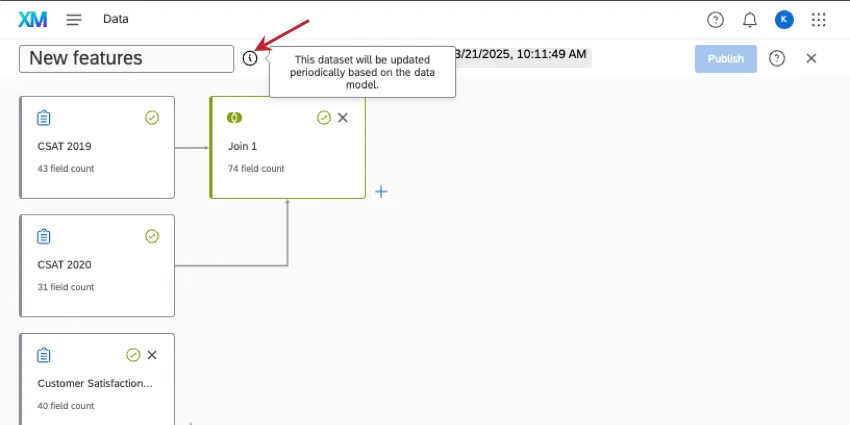
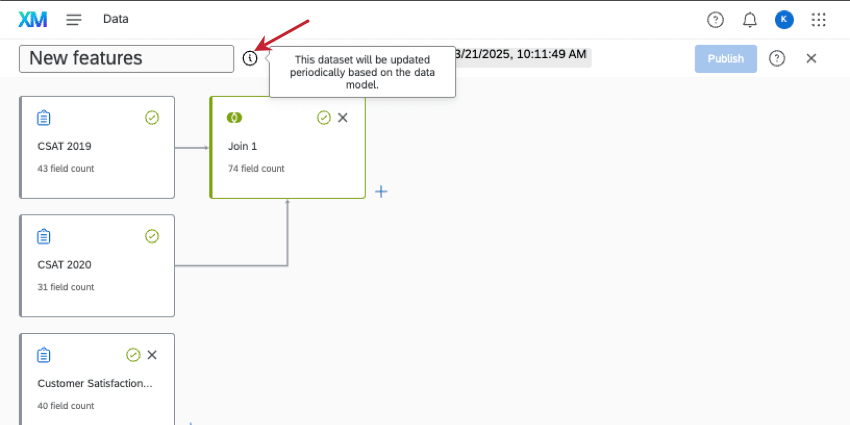
Qtip: To see the specific date and time a periodic data model will update, publish your changes. Hover over the clock that appears to see an estimate.
Identifying Features that Need Periodic Updates
Attention: Inner and full outer joins are currently in development, and are not yet available to all customers. Qualtrics may, in its sole discretion and without liability, change the timing of any product feature rollout, change the functionality for any in preview or in development product feature, or choose not to release a product feature or functionality for any reason or for no reason. If you’re interested in trying this feature, please reach out to Account Services.
Here are a few examples of features that cause a dataset to become periodic instead of continuous:
Qtip: You can currently only aggregate rows in CrossXM and Employee Journey Analytics. Aggregations are not available in CX Dashboard data models.
This list is not exhaustive. If your dataset updates periodically instead of continuously, there are a few places you can look in the data modeler to find this out:
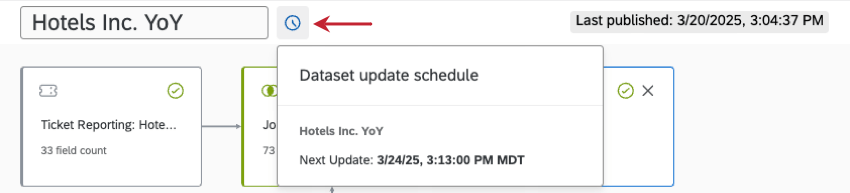
Example: As soon as you finish a change that switches the dataset to periodic, this message appears in the information icon next to the title.
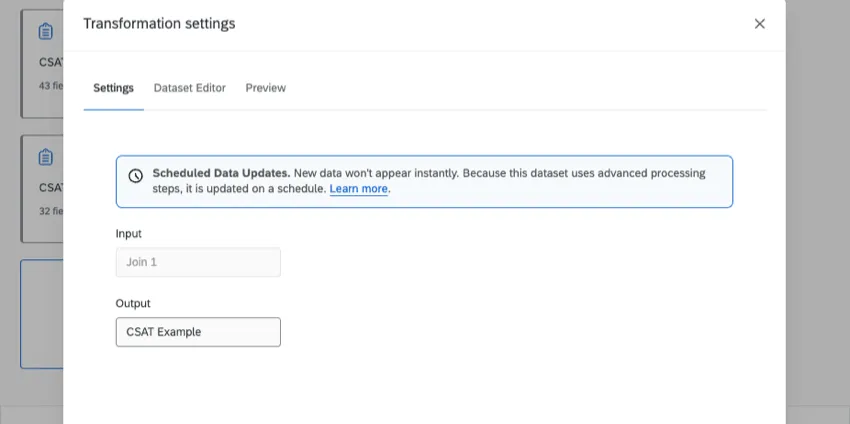
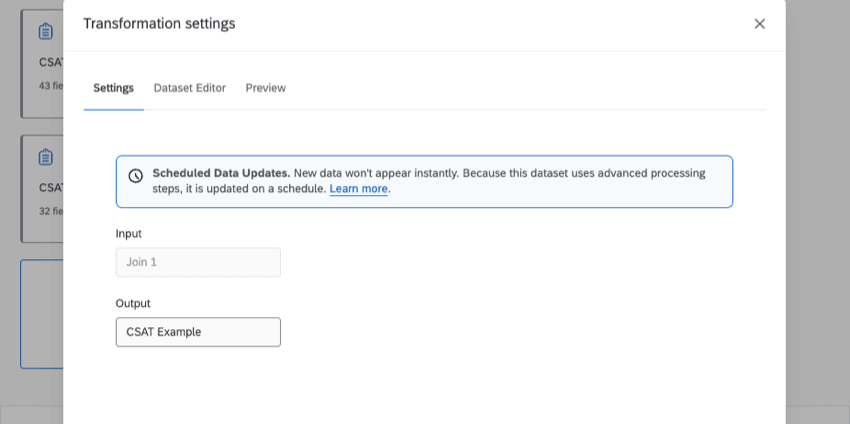
Example: This message appears in the output dataset.
Dashboards You Can Add Data Models To
Data models can only be added to the following types of dashboards:
- Dashboards projects (also known as CX Dashboards)
- Dashboards added to programs
- Dashboards built into certain XM Solutions
- Brand Experience
See Dashboard Data for steps to add your completed data model to your dashboard.
This feature cannot be used with any Employee Experience dashboards or with Results Dashboards. For a similar Employee Experience feature, see Data Models.
FAQs
How many columns / unique fields can my dataset have?
How many columns / unique fields can my dataset have?
Is there a limit to the number of data sources you can add in each dataset?
Is there a limit to the number of data sources you can add in each dataset?
How many times can I use the same data source in a dashboard dataset?
How many times can I use the same data source in a dashboard dataset?
Can I create ticketing datasets with the data modeler?
Can I create ticketing datasets with the data modeler?
However, if you’re looking to build ticket reporting pages, you cannot use the data modeler. Ticket reporting pages use the datasets described on this page.
Are changes to data models reflected immediately in dashboards?
Are changes to data models reflected immediately in dashboards?
If you have multiple sources of the same type in your dataset (such as tickets and surveys), we generally recommend creating unions before you create joins.
How many datasets can I publish for my contacts directory?
How many datasets can I publish for my contacts directory?
How do I add imported video and audio data to my dashboard?
How do I add imported video and audio data to my dashboard?
On the other hand, survey projects with video questions can be mapped to both data models and data mappers.
What’s the difference between data sources and datasets?
What’s the difference between data sources and datasets?
Learn more about these key terms.
That's great! Thank you for your feedback!
Thank you for your feedback!