
Intro
Net Promoter Score (NPS) is said by some to be the ‘holy grail’ for understanding customer satisfaction, and in turn, customer loyalty. It is a simple score between -100 to 100 that helps organisations rank themselves within their industry and independently.
However, organisations are discovering that it can be used beyond just benchmarking themselves over time. It can shape cultural change, improve experiences and build happier long lasting customer relationships. These ultimately will impact the business on a financial level, and impacts how well the company connects with customers through its customer experience (CX).
How NPS measures customer loyalty
Net Promoter Score is a survey question that asks one simple question:
How likely is it that you would recommend [Organisation X] to a friend or colleague?
Respondents give a rating between 0 (not at all likely) and 10 (extremely likely) and, depending on their response, customers fall into one of three categories to establish a NPS score:
- ‘Promoters’ respond with a score of 9 or 10
- ‘Passives’ respond with a score of 7 or 8
- ‘Detractors’ respond with a score of 0 to 6.
You then calculate your NPS using this formula:
NPS = % of Promoters ( — ) % of Detractors
In this formula, the passive percentage is not utilised.
Based on this, your company’s NPS score will be a number from -100 to +100. Scores that are closer to -100 indicate that there are more detractors overall, and -100 tells us there are no Promoters. Scores that are closer to 100 tell us that there are more Promoters overall.
NPS breakdown: Promoters, Detractors & Passives
The results from customers can tell you a lot about their perception of the organisation, how they feel and if your experience met their needs.
- Promoters are typically loyal and enthusiastic customers. They are most likely to be ‘brand ambassadors’ by sharing positive online reviews, getting engaged on social media and recommending the product or service with their friends.
- Passives are satisfied with your service but not happy enough to be considered promoters.
- Detractors are unhappy customers who are unlikely to buy from you again, and may even discourage others from buying from you. Their loyalty to the brand is so low, that it’s likely they may end the relationship soon, posing the greatest risk of ‘churn’.
Absolute and relative NPS
To understand what a ‘good’ score level is, we need to first look at the two ways of thinking about your NPS:
- Absolute NPS uses your score as a marker of ‘good’ against scores from all industries. Find out what the average NPS for your industry is here.
- Relative NPS looks at your score as a comparison marker, against other companies within your industry. You may look at how you do against your competition, and see this as an indication of successful customer satisfaction.
So, the goal is to get 100? Yes and no.
Yes, because you want to move in the direction of turning more detractors into promoters, to move closer to +100. This means enhancing experiences so customers receive value and attention. In the relative NPS position, you would first look at how you compare against yourself, at regular intervals, ensuring that your progress does not stagnate, in an attempt to ‘keep up with the Joneses’.
No, because it’s actually surprisingly hard to achieve +100 holding the absolute position. +100 says that all customers are completely satisfied with your organisation. Even the organisations and industries that we think of as popular with loyal customers don’t come in at 100.
Instead, we recommend that the score is used as a ‘health-check’ to see whether your customers’ needs are being met. This metric measure can only be useful, if you’re able to take action and improve experiences as a result.
Absolute NPS: what is a ‘good’ score for me?
Creators of NPS, Bain & Company, suggest a score:
- Above 0 is good
- Above 20 is favourable
- Above 50 is excellent
- Above 80 is world class
From the absolute NPS position, any score over 0 would be considered ‘good’ as there are more Promoters than Detractors. Though, based on the above, it would be seen as the minimum level of progress. To be above average, a score greater than 50 is needed, so you would need to work on turning Detractors into Passives.
There are several factors that could impact your absolute NPS score:
The format of the NPS survey
The NPS results could vary because of the way the survey has been formatted. Here are some common issues that arise with surveys that impact results:
Is the survey short and to the point?
A low response rate can occur if the survey is too long or complex.
Have you used leading questions?
If you have phrased the question incorrectly, or added extra follow-on questions that suggest the result should be favourable, this can impact your NPS.
Have you caused bias in the survey process?
If you have offered monetary rewards or vouchers for more positive responses, the NPS result will not be accurate. Other bias can come in the form of pressuring customers by having telephone calls or face-to-face meetings, then using a survey format to ask the NPS survey question. It can be more difficult to receive negative feedback from customers because of confirmation bias.
Customer tolerance differences
There are no organisations that will totally satisfy each and every customer, as customers are different people with different needs.
As different people, customers have different levels of tolerance to negative experiences. Some may get more angry than others, while others may have much lower expectations than others.
Sample size response rates
A survey’s sample size can impact the NPS result. With smaller sample sizes, you have more chance of skewed results, than with a larger sample size. When the sample is small, small differences in responses – like having more Detractors over Promoters – makes a large difference to the NPS. Generally, you should aim for a 1200 total sample size, accounting for 5% margin of error.
How often you ‘close the loop’
When you get NPS results, how does your organisation respond to Detractors? Do you try to close the loop and resolve customer issues?
The NPS and any driver questions provide great feedback that you can act on to improve the experiences of Detractors in the future, and show them that you value what you’re hearing.
Measure your NPS regularly
It’s good to measure progress continuously to have real-time continuous updates as you operate.
Some organisations may want to follow a structure that occurs at similar intervals, like month-on-month, every quarter and every six months. Make sure you have the right ‘close the loop’ follow-up procedures ready, so that you can make changes where needed.
Whichever way you decide to measure your NPS, it will provide valuable insight on what is working or not working.
Relative NPS: what is a ‘good’ score for me?
From a relative NPS position, if you’d like to benchmark against competitor NPS scores, the levels of ‘good’ will vary. There may be ranges that organisations fit within, based on industry or background.
There are several factors that could impact your relative NPS score:
Differences between industries
Your industry can impact your NPS scores. Industry data from 20 industries shows that average scores by industry vary a great deal:
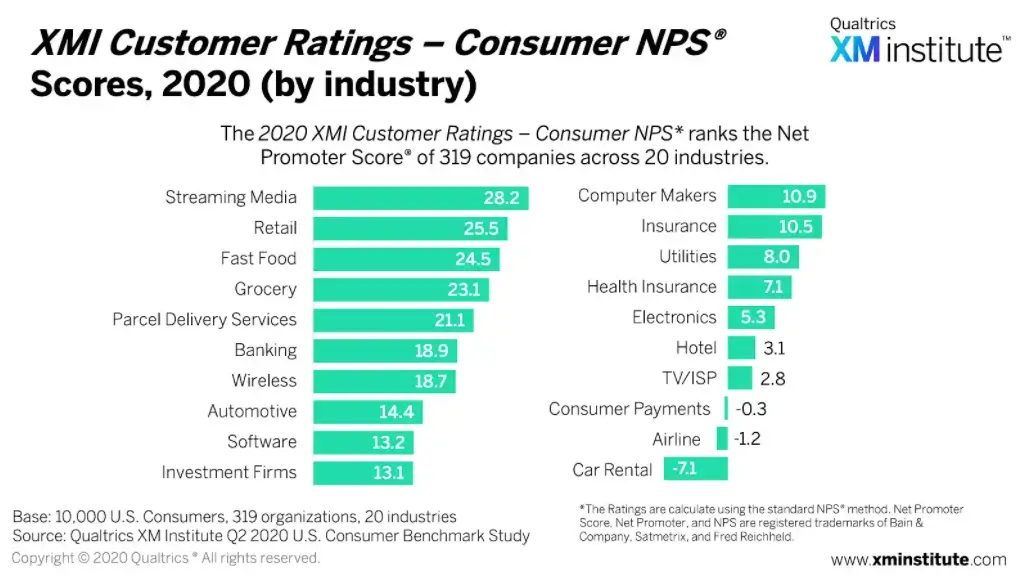
In some industries, it’s not possible to keep everyone happy. For example, Finance and Healthcare industries are used to dealing with customers with varied results. If the results of a customer’s situation are negative – like a loan has been denied – it’s unlikely a customer is going to be satisfied.
Some industries have changed NPS results because of events happening at the time of the survey, which have drastically changed satisfaction levels. For example, the uncertain nature of air travel over the COVID-19 pandemic led to changed flights, cancellations and negative experiences at the airport.
See how your NPS compares with your industry: NPS Industry Benchmark Calculator
Differences between cultures
If you’re running a survey in different countries, or doing a survey to represent each global office’s regional NPS performance, differences in culture can impact NPS results. It’s important to account for these different attitudes, behaviours and expectations.
Use NPS to build a culture of action
NPS can be useful when used in the right way; to take stock, identify areas of poor performance, and take actions that create and improve those experiences. But this won’t be possible on its own.
Combine it with other driver questions to make sure you can understand the ‘why’ reasons behind the recommendation result. A simple text box entry field with the question ‘why did you enter the score above?’ can support this qualitative research.
When new CX initiatives are produced and tested, make sure your organisation uses targeted listening posts to make sure that the investment into the CX improvements has created successful results.
This culture of action won’t happen overnight. But by creating a culture centred around continuous, meaningful actions, you’ll see that NPS score rise.
How we can help
Qualtrics® Customer Experience software helps organisations to surface customer friction and guide frontline teams in the moment to better serve clients. Our NPS solution will enable you to measure, analyse and improve your NPS across your organisation.