
Data & Analysis Basic Overview
What's on this page
About Data & Analysis
The Data & Analysis tab lets you filter, classify, merge, clean, and statistically analyze your response data:
Click Data & Analysis to reveal up to 6 key sections.

Select between the sections as introduced below:
- Data
- Text
- Stats iQ
- Crosstabs
- Weighting
- Audio & Video
On this support page, we’ll introduce the core features included in Data & Analysis, specifically in survey projects.
Qtip: Some of these tabs, like Stats iQ are add-on features to your license. If you’d like to purchase access to them, contact your Qualtrics Account Executive.
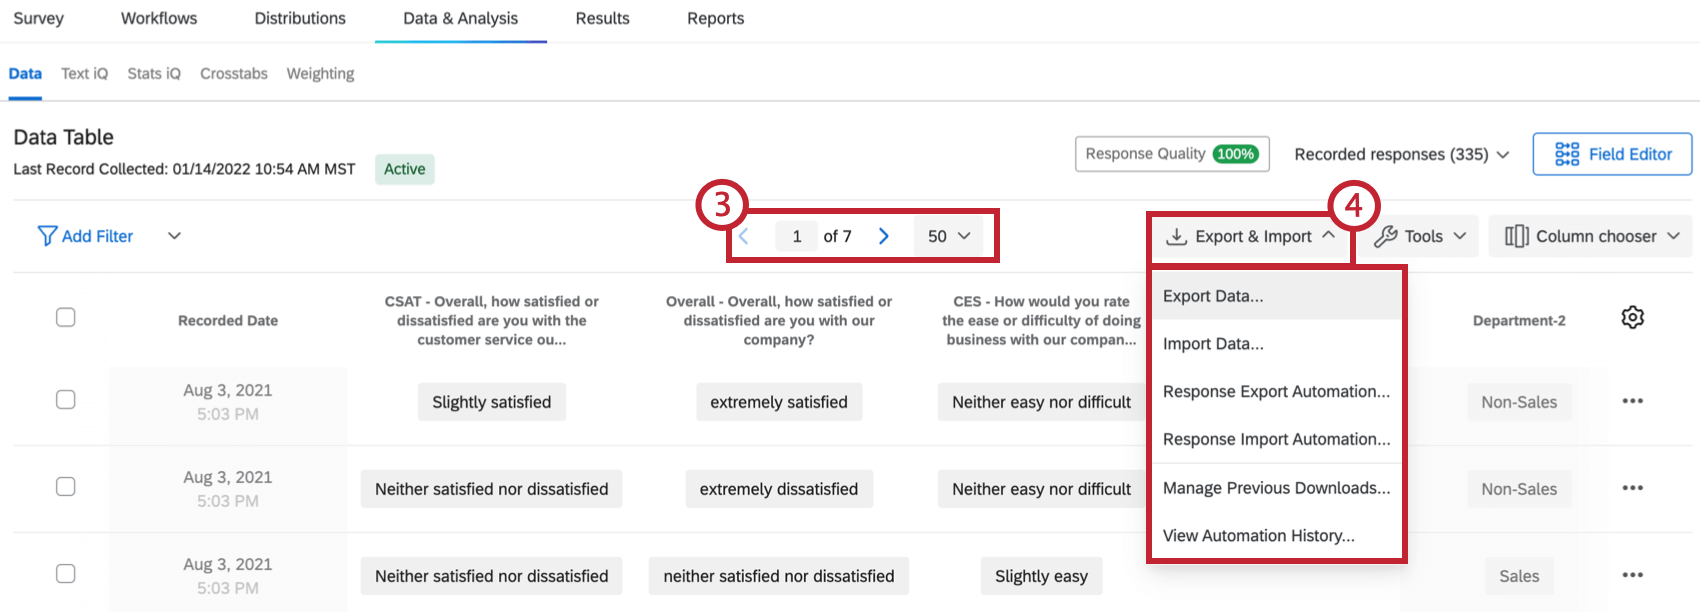
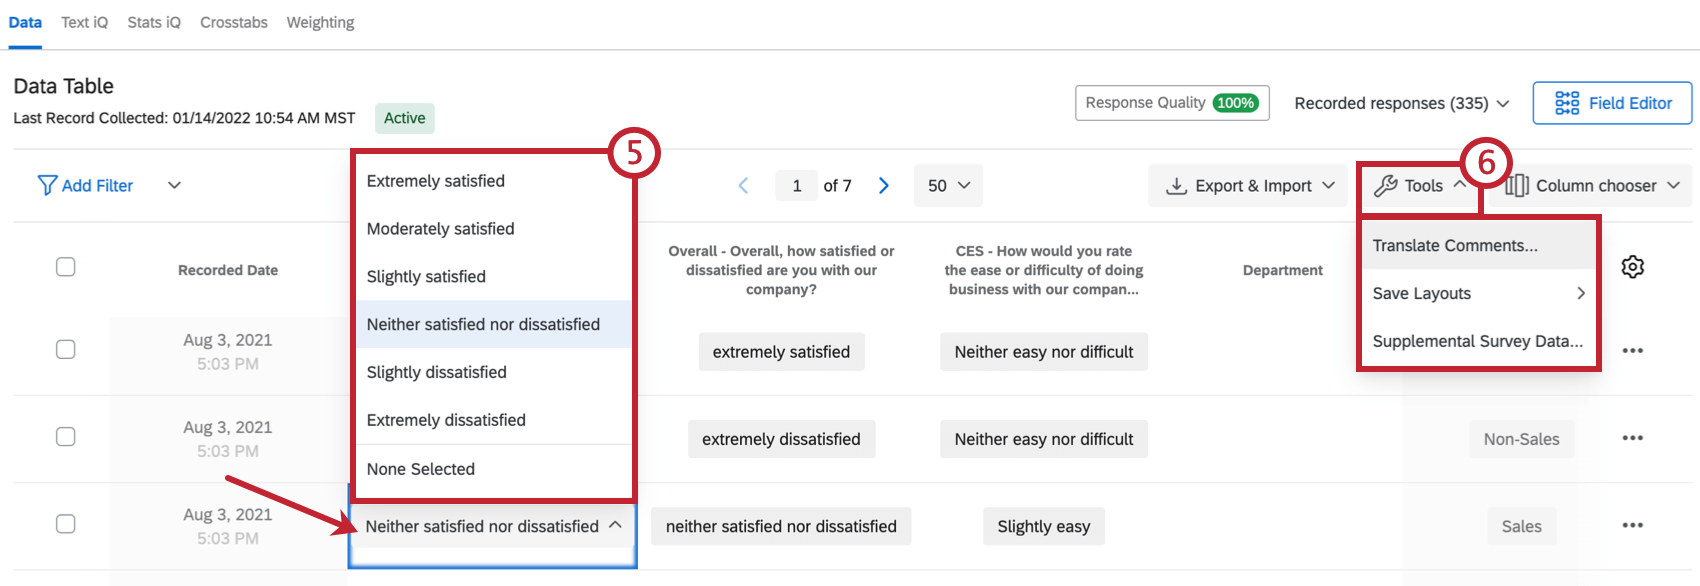
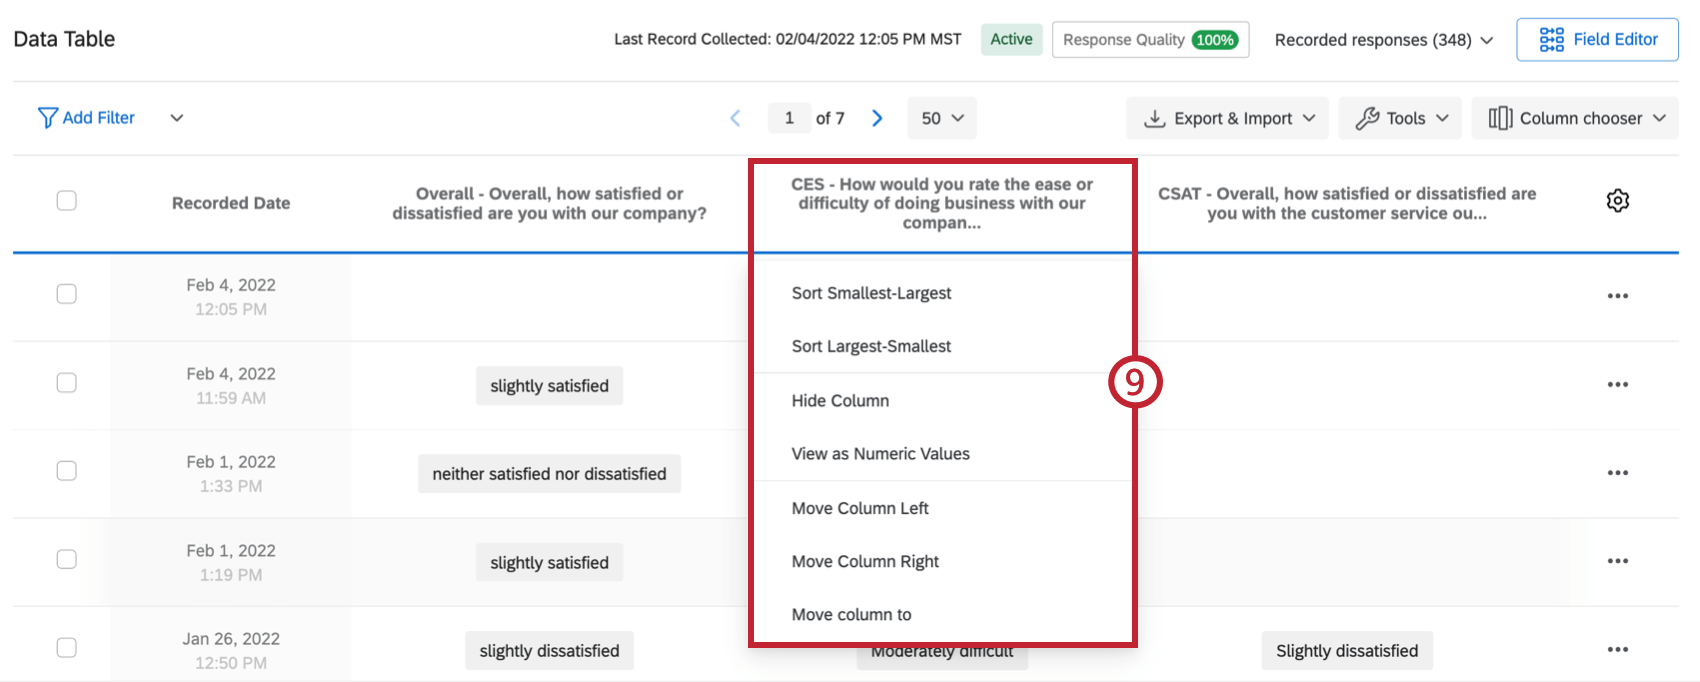
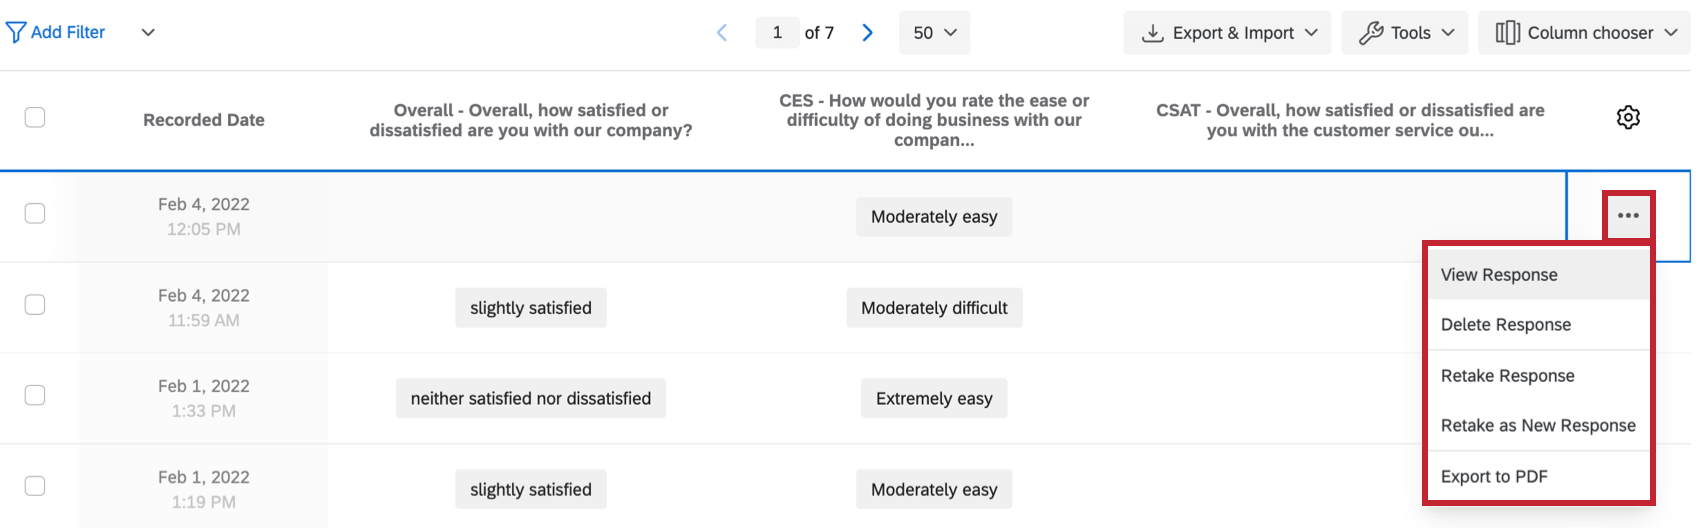
Data Section
Most filtering, classifying, merging, importing, and data cleaning activities take place within the Data section. For example:
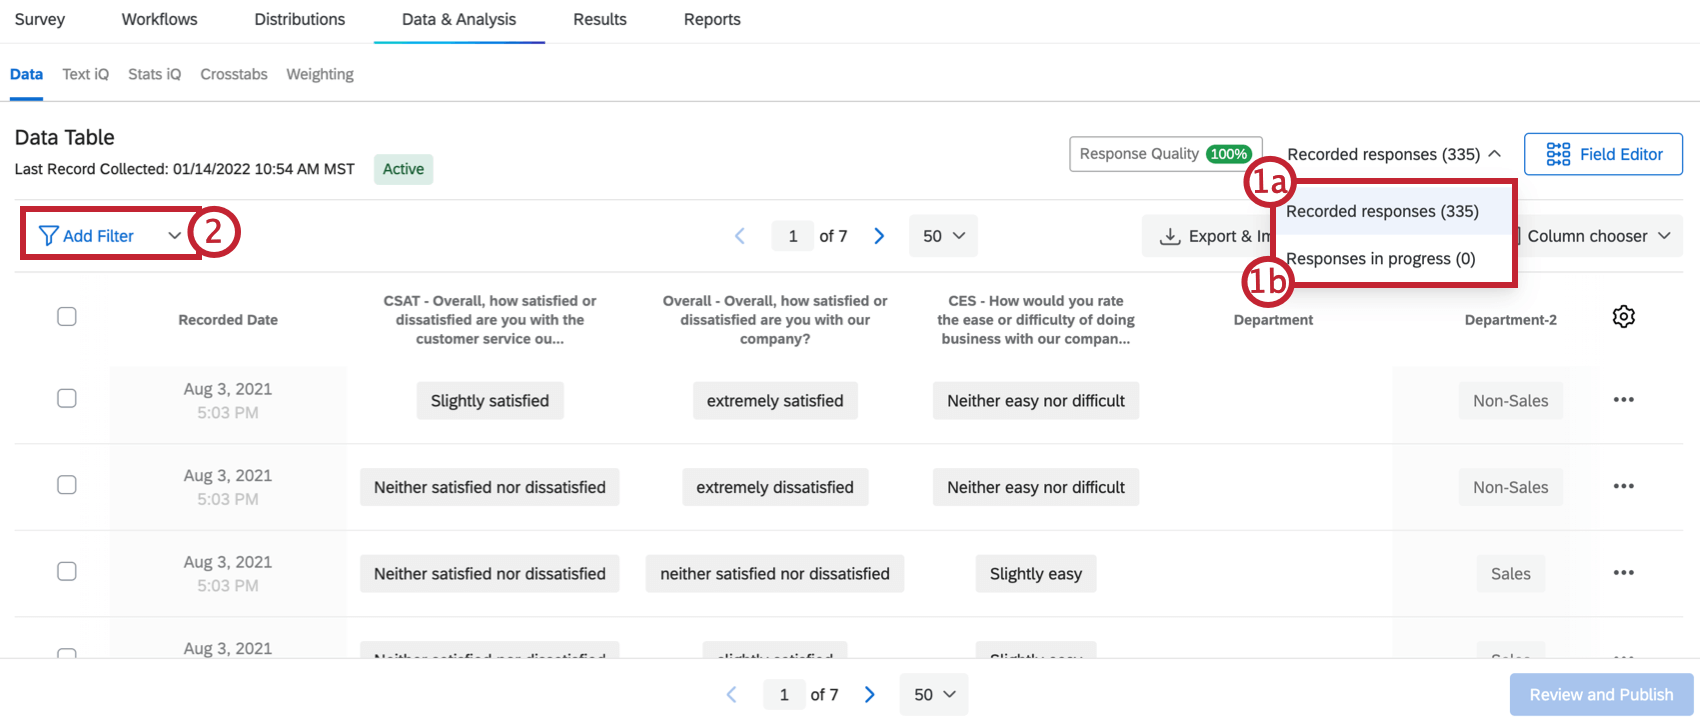
- “Completed” or Recorded Responses
- “Incomplete” or Responses in Progress
Qtip: See the Filtering Responses page for more details.
Qtip: See the Editing Responses page for more details.
Qtip: See the Retake Survey Link page for more details.
Text Section (Text iQ)
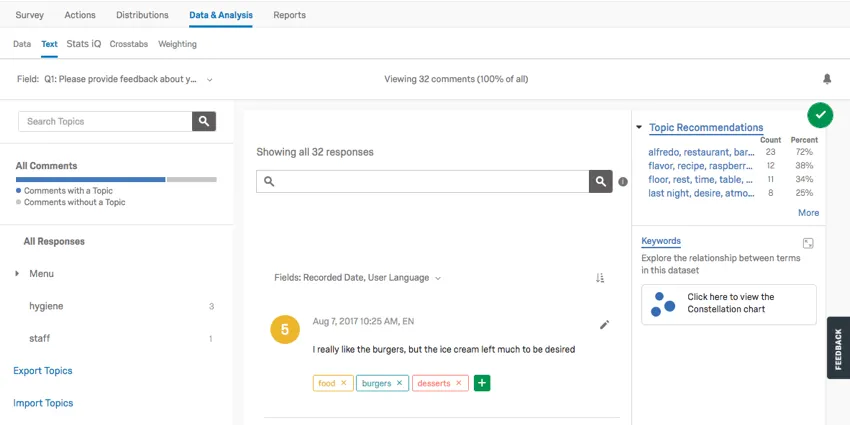
The Text section contains Text iQ tools. Use Text iQ to tag text entry responses with topics for analysis. In the below image:
- Multiple topics have been tagged in the Topics pane (e.g., “food,” “burgers,” and “ice cream”).
- Multiple topics can be assigned to your responses.
- Lemmatization includes various forms of words (such as “burger” and “burgers”).
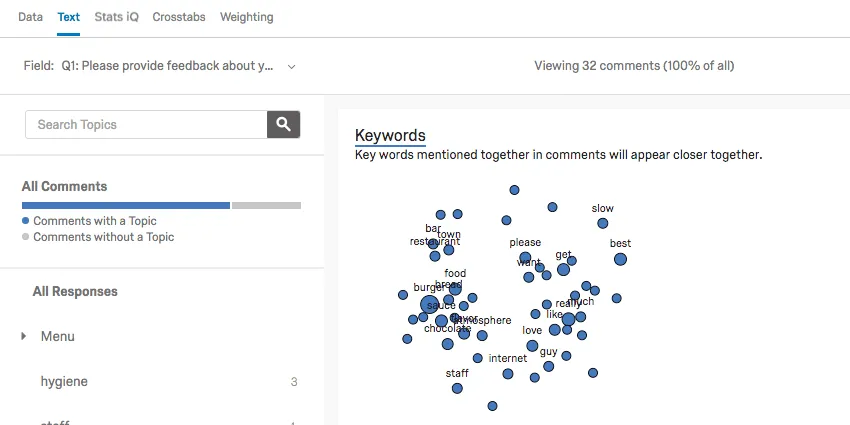
Text iQ generates various widgets that will give insight to your text analysis. For example, this constellation chart displays the frequency with which certain terms appeared in all the responses. Dots in the constellation get larger as the term appears more frequently.
Create as many new topics as you need to explore your text responses in depth. Additionally, the Text iQ search will help you pinpoint your topics. Lemmatization and spell check will also speed up your topic tagging:
- Lemmatization: Dissects words by their roots and tags them accordingly (e.g., car = car, cars, car’s, cars’).
- Spell check: Variations of misspelled words like “ice creem” or “icecream” will be tagged as “ice cream.”
Qtip: See the Text iQ page for details on how to get the most out of Text iQ.
Stats iQ Section
When you click the Stats iQ section, you’ll open Qualtrics Stats iQ. This will let you dig deep into your analysis, identify trends, and produce predictive models. Stats iQ is a powerhouse statistical tool that can be appreciated by novice and expert analysts alike.
Attention: Stats iQ is an add-on feature not included in the standard Qualtrics license. If you don’t have a Stats iQ section, please contact your Qualtrics Account Executive for more information.
Access Stats iQ by selecting the Stats iQ section. From there:
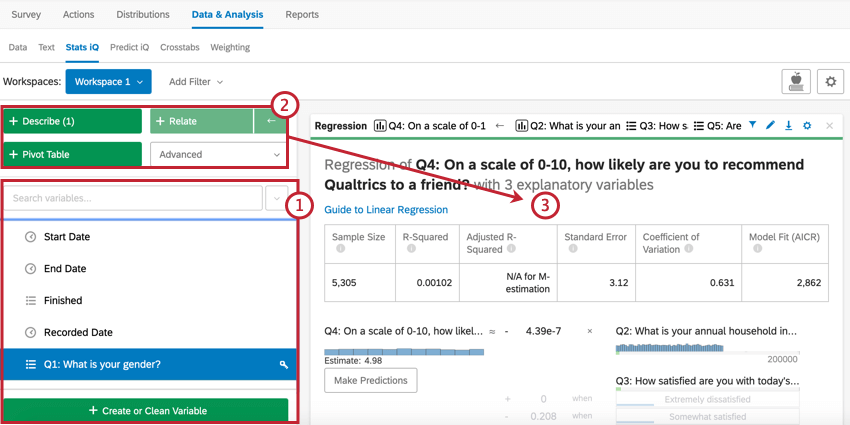
Stats iQ can analyze data collected in Qualtrics, as well as any outside data you’ve uploaded following the Imported Data Projects instructions. For more information, visit the Stats iQ Basic Overview page.
Crosstabs Section
Crosstabs perform multivariate analysis (i.e., analyzing 2 or more variables at a time) while calculating p-value, Chi-Square, and T-Test stats.
Typically used with multiple choice and matrix table questions, you can also add embedded data to your crosstabs.
In any crosstab visualization, rows are called stubs and columns are called banners.
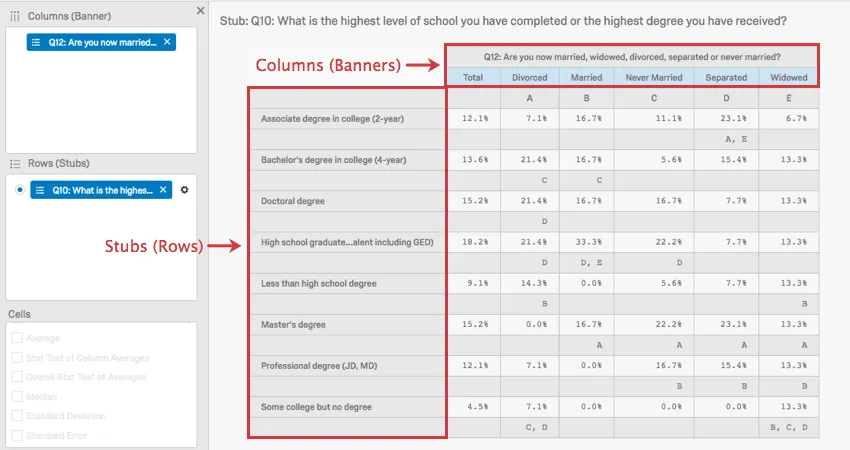
In the above image, you can see that marital status is being associated with level of education.
The capital letters in this image represent statistical comparisons between columns. In the case of where the “Divorced” column intersects with the “Bachelor’s degree” row, there is a capital C. This means that respondents that are Divorced are significantly more likely than those in column C, the Never Married respondents, to indicate that they have a Bachelor’s degree.
Qtip: The example above was an example of the Column Percentages (Answering) and Column Stats Test (Answering) calculations. Review the Crosstabs page for step-by-step instructions on how to perform these kinds of calculations, and more
Significance is determined by adjusting the Confidence Level. Click the button in the upper-right to change the threshold in which difference are considered statistically significant.
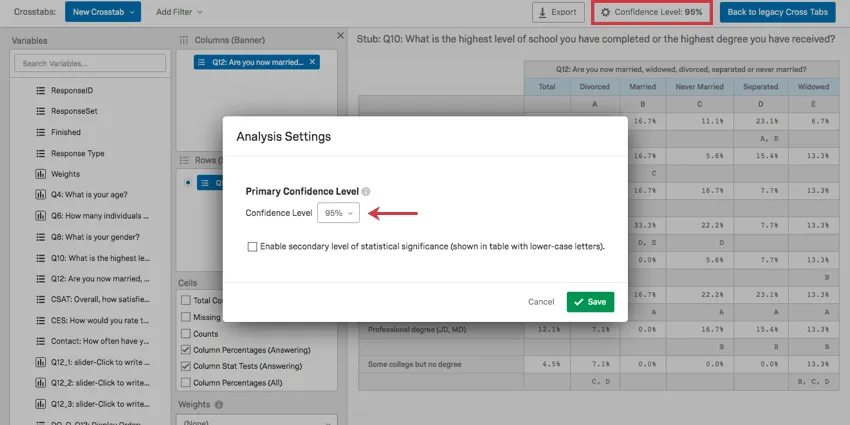
Qtip: Read the Crosstab Options page for instructions on additional options that can inform your calculations.
Weighting Section
Surveys sample larger populations. The Weighting section lets you adjust your sample to account for underrepresented populations.
Qtip: For step-by-step instructions on how to apply weighting, visit the Response Weighting page.
For example, say that you are surveying conference attendees from all over Canada, yet you need your sample to proportionally reflect each province. You may want to re-weight the survey to reflect your desired distribution. In the below image:
- Alberta is underrepresented, hosting just 7.5% of survey takers, but 11.57% of the population of Canada.
- Ontario is also underrepresented, containing 38.26% of the population, yet only contributing 7% of the survey respondents.
- The Yukon territory is overrepresented with 10.4% of the survey participants, yet they are only 0.10% of the Canadian population.
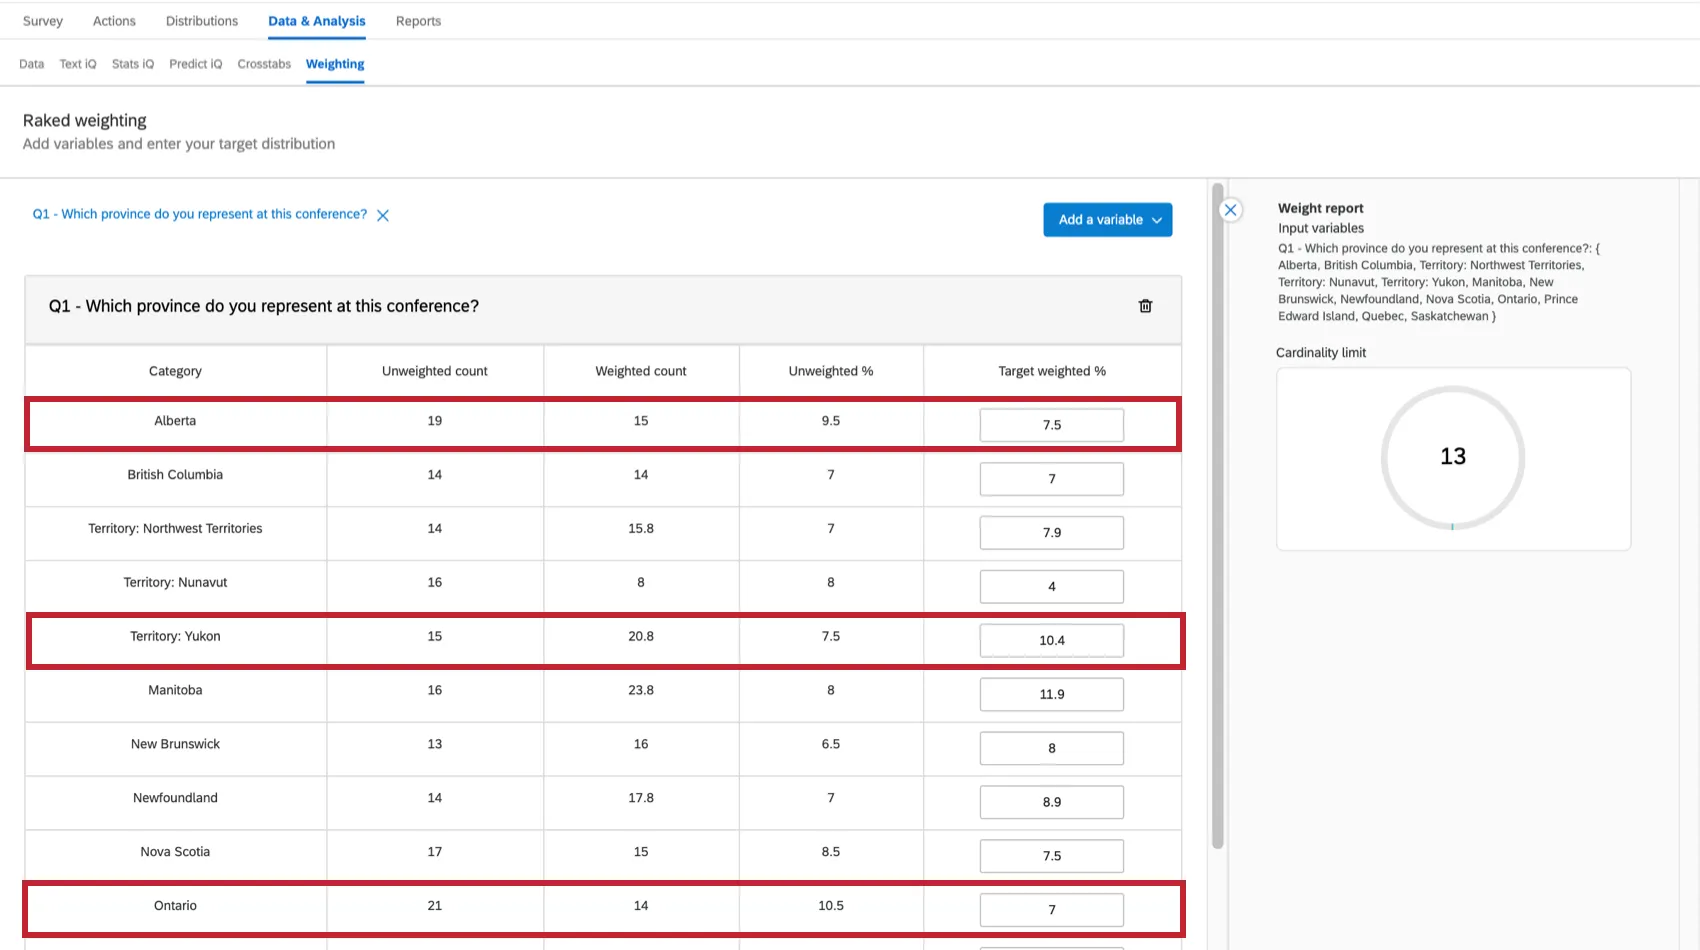
It’s easy to change the weighting (by percentage) in the Target weighted column. Your percentages will equal 100% in the end.
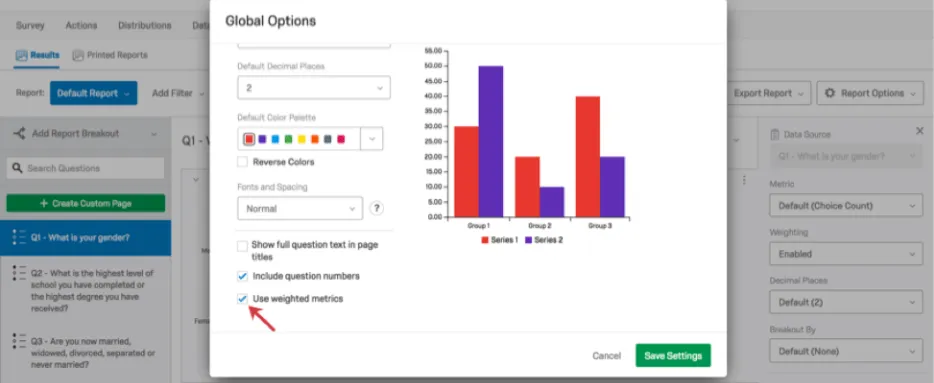
Response weighting can be applied to your Results-Reports. You can turn your weightings on or off globally (for a whole report) or for a single visualization (a graph or table).
Multiple Variables
There are 2 options for weighting multiple variables:
- Raked Weighting: Calculate 2 (or more) variables independently and display them side-by-side.
- Interlocked Weighting: Overlay 2 or more demographics. For example, melding a “Years of Experience” variable with a “Province” variable.
Qtip: For more information about interlocked and raked weightings, explore the Response Weighting page.
Making Decisions About Weighting
There are many potential causes of a skewed survey:
- Non-response: Certain demographics fail to respond to your survey.
- Panel design: Your panel (list of targeted respondents) hasn’t been properly selected.
- Self-selection: Those who opt into your survey don’t reflect your targeted demographic.
- Sample size: You may not have enough respondents to be significant.
This is where the Weighting section is helpful. It’s here that you can study and interpret problems with the representativeness of your data that may make it difficult to reach reliable conclusions based upon your response distribution.
Qtip: Read more about interpreting statistics on the Understanding Statistics page.
Audio and Video Section
If your survey contains a video response question, you can view and edit the audio and video responses within the Audio & Video tab in Data & Analysis. From here, you can view transcripts, make clips from audio and video responses, and assemble them into highlight reels. You can also leverage AI-driven insights to identify themes in your video responses.
For more information, see Audio & Video Editor.
FAQs
How do I filter my responses?
How do I filter my responses?
What responses actually count toward my license?
What responses actually count toward my license?
Licensed responses are any completed responses that are not Survey Previews or Survey Tests. Completed responses can include imported responses, finished surveys, and partial surveys that were moved out of responses in progress and recorded. If you ever want to know the exact number of interactions you’ve used, reach out to your Brand Admin. You can also view your response usage by going to Account Settings to view the legacy Account Usage report.
Contact Account Services or your Account Executive prior to importing historical responses, as this may require an update to your license.
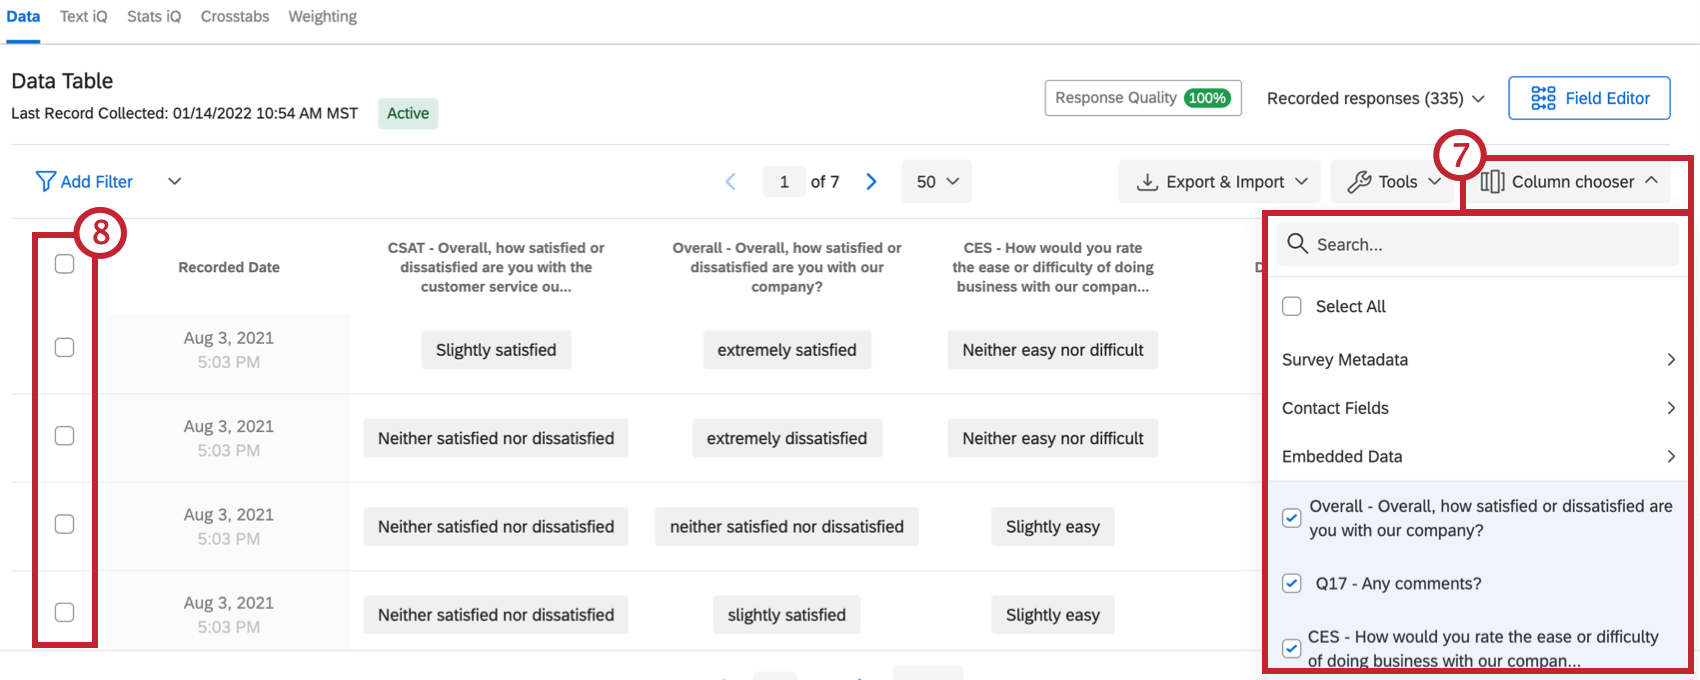
How do I set which columns show in my response viewer?
How do I set which columns show in my response viewer?
Can a participant retake their survey?
Can a participant retake their survey?
Note that in Retake Survey links, all of the participant’s original answers are prepopulated. If new questions have been added to the survey in the meantime, those questions will be blank.
Can I import my own data into Qualtrics?
Can I import my own data into Qualtrics?
Where do I access the Cross Tabulation feature?
Where do I access the Cross Tabulation feature?
How do I export my data into a CSV or SPSS file?
How do I export my data into a CSV or SPSS file?
How do I get a retake link for a response so a respondent can change their answer or fill out a question they missed originally?
How do I get a retake link for a response so a respondent can change their answer or fill out a question they missed originally?
I only see a couple columns of information displayed in the Data & Analysis tab. Can I choose different columns of data?
I only see a couple columns of information displayed in the Data & Analysis tab. Can I choose different columns of data?
How do I delete responses I do not want?
How do I delete responses I do not want?
For more information regarding deleting responses, see Deleting Responses.
I don't have the tab described on this page! What do I do?
I don't have the tab described on this page! What do I do?
Why have my contact fields been replaced with “******”?
Why have my contact fields been replaced with “******”?
That's great! Thank you for your feedback!
Thank you for your feedback!