
Understanding Your Dataset
What's on this page
About Your Response Dataset
For additional analysis outside of Qualtrics, you can download a dataset file for any survey. This dataset includes all your survey’s raw response data, which covers everything from answers to survey questions, to additional metadata like duration and dates, to embedded data, and more.
On this page, we will:
- Explain different columns of information you might see in your data file.
- Explain how answers may be formatted in this data file, depending on the column.
- Link out to other resources that allow you to understand or customize your data download.
However, this page does not discuss statistical analysis, or tell you how to interpret the results of your data, beyond the literal (e.g., this respondent marked that they were highly satisfied). There are so many different variables and projects that go into research, and while we’d love to say we know everything, it really depends on the specifics of your study and how you set it up!
Attention: The file used in screenshots on this page was downloaded in the CSV format and is opened in Excel. It has also been formatted using the wrap text feature for easier reading. Other file formats include the same data points, but may display the contents with a slightly different layout.
Types of Response Datasets Covered By This Page
This page can help you understand the raw data you export from the following types of projects:
There are a few other types of projects where you can export response data. However, there are important differences to keep in mind:
- For 360 projects, see Understanding Your Response Dataset (360).
- For all other Employee Experience projects, see Understanding Your Response Dataset (EX).
Technically, Conjoint and MaxDiff datasets are also formatted as described on this page when exported from Data & Analysis. However, this data export excludes Conjoint- and MaxDiff-specific data.
File Format Basics
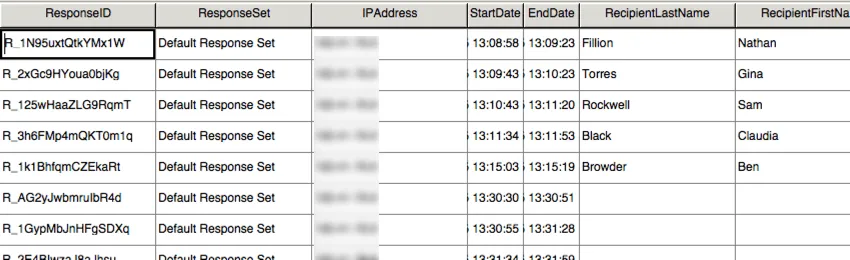
Every row of the file is a different survey response (although not necessarily different respondents, if you let people answer multiple times). Every column is a type of survey data.
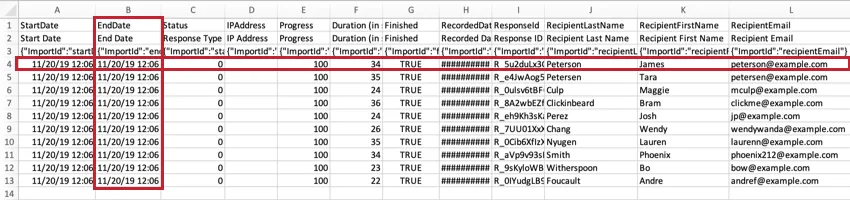
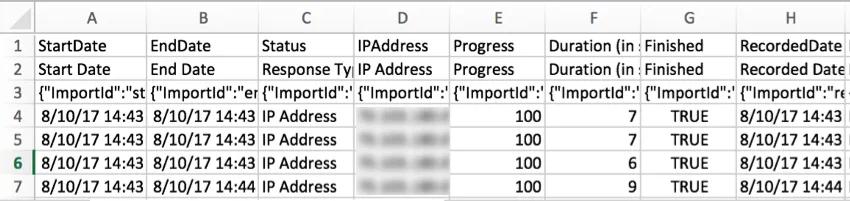
CSV and TSV files come with 3 rows of headers. The first header is the internal Qualtrics ID of the field (e.g., EndDate, Q1, Q2, and so on). The second header is the field’s name or text (e.g., End Date, How satisfied are you with Qualtrics?). The third header has import IDs. All 3 of these headers are included because they are needed to upload the data to a survey. Respondent data starts on the fourth row of the file.
Qtip: Based on the file format you downloaded (SPSS, Excel, etc.), you may see different headers. See Export Formats for more information on the formats available.
Respondent Information
The first several columns in a dataset include information about each respondent and their response, such as their name, IP address, response submission dates, and so on. We’ll list each of those columns and how to understand their content here.
Qtip: The time zone used for all dates and times recorded in your Qualtrics account correlates to the time zone set in your Account Settings.
StartDate
These date and time values indicate when the respondents first clicked the survey link.
Qtip: If your Start Date and End Date columns in Excel contain ######, try making the columns wider. Excel uses # symbols when a date won’t fit.
EndDate
These date and time values indicate when the respondent submitted their survey. If the entry is an incomplete response, this date will indicate the last time the respondent interacted with the survey.
Qtip: When you import a response, you can give the response any end date or start date you want. However, once a response is recorded, the end date and start dates are set, and cannot be edited.
Status / Response Type
The value in the Status column indicates the type of response collected. These are the possible statuses, presented in both value and label format:
- 0 / IP Address: A normal response
- 1 / Survey Preview: A preview response
- 2 / Survey Test: A test response
- 4 / Imported: An imported response
- 16 / Offline: A Qualtrics Offline App response
- 17 / Offline Preview: Previews submitted through the Qualtrics Offline App. This feature is deprecated in latest versions of the app
- 256 / Synthetic: A synthetic panel response.
Qtip: Old files may also have the codes 6, 8, or 12, relating to Spam. All Spam statuses have been deprecated. For better tools that will help you identify spam, check out Fraud Detection and Response Quality.
Qtip: If you export your data with Export labels enabled, your export will contain the text for each status (e.g. Survey Preview) instead of the numeric code.
Qtip: Licensed responses are any completed responses that are not survey previews or survey tests. Completed responses include finished surveys and incomplete surveys that were moved out of responses in progress and recorded. Contact your Account Executive for pricing on Imported responses. If you ever want to view the number of responses you’ve used, go to Account Settings, then Account Usage.
IPAddress
This column includes the respondent’s IP address. This data will not be available if responses have been completely anonymized.
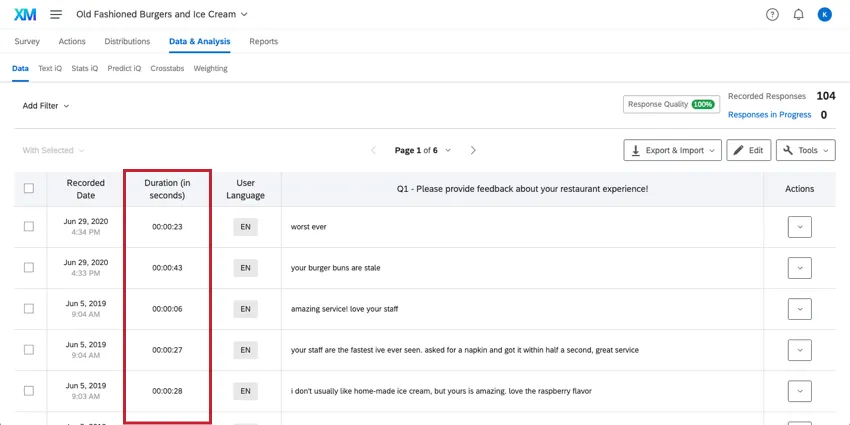
Duration
The number of seconds it took the respondent to complete the survey. This is the entire duration of the response; if a respondent stops in the middle of the survey, closes the browser, and comes back another day, that time is counted.
Qtip: While the export measures duration in seconds, in the Data tab this field is displayed in hours:minutes:seconds.
Finished and Progress
The Finished column details whether the response was submitted or closed. A “1” or “True” indicates the respondent reached an end point in their survey (hitting the last Next/Submit button, being screened-out with Skip or Branch Logic, etc.). A “0” or “False” indicates the respondent left their survey before reaching an end point and the response was instead closed manually or due to session expiration.
The Progress column shows the progress a respondent made in the survey before finishing. For those marked as “1” or “True” in the Finished column, the Progress is marked 100. For those whose responses are marked “0” or “False,” you will get an exact percentage of how far they got in the survey based on the question they left off on.
Qtip: The progress percentage is calculated based on all elements in the survey, including elements in the survey flow. If your survey contains many elements, the progress percentage can be less than 1% even when questions are answered. Progress less than 1% is rounded to 0%.
RecordedDate
This column indicates when a survey was recorded in Qualtrics. For users taking surveys online, this date and time will be very similar to End Date. However, for responses that are imported, or uploaded from the Offline App, Recorded Date will often differ from End Date, reflecting when you manually uploaded the results, not when the survey taker finished.
Qtip: Noticing a difference of several minutes between End Date and Recorded Date? A slow internet connection can delay the time between when the respondent submits their survey data and when Qualtrics officially saves it to the website.
Qtip: Response export order is organized based on Recorded Date with the oldest recorded response appearing first.
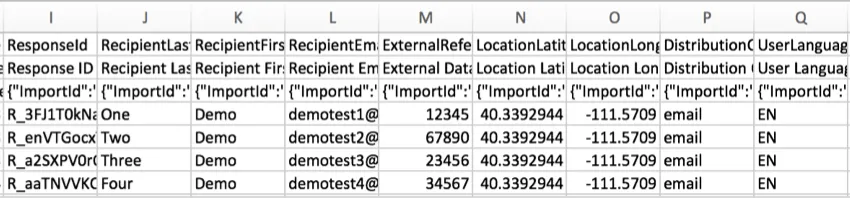
ResponseID
The ResponseID is the ID Qualtrics uses to identify each response in the database. This unique identifier is provided as a reference and generally does not have a use in data analysis.
RecipientLastName, RecipientFirstName, and RecipientEmail
Respondents’ names and email addresses will display in these columns if your survey was distributed using a contact list. Some of the common distributions that use contact lists include:
For all other responses, such as those collected with an anonymous link or with certain Survey Options enabled, these columns will be blank. Please note that any distribution can be anonymized, regardless of the method of distribution.
Qtip: The respondents’ names will be drawn from the contact list that the distribution was based on. Deleting the contact list or deleting information from the contact list won’t impact the response data unless you do it before the respondent starts the survey (or before the distribution is sent). If you delete or edit a contact list after the response is collected, the response will still contain the original contact data. You can always edit the response as needed.
Qtip: For questions related to respondent privacy and GDPR, see our Qualtrics & GDPR Compliance support page.
ExternalDataReference
Frequently used when uploading a contact list to Qualtrics for use in an authenticator and occasionally in an email distribution, an external data reference can be included for each participant. This is a generic field that can store any information you like (and is most often used for unique identifiers like employee or student IDs). If an external data reference was added to the contact list, it will display in this column. If you did not choose to use this field, the column will be blank.
Qtip: For greater flexibility with email distributions and data gathered from survey links with query strings, we generally recommend uploading additional details as embedded data rather than using external data reference.
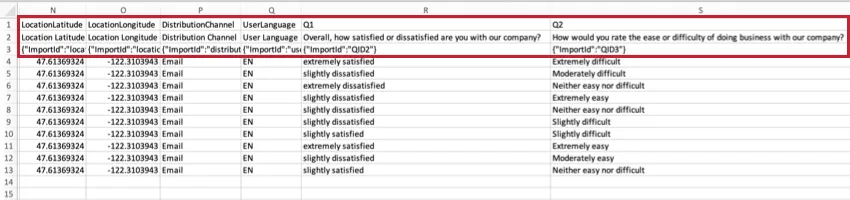
LocationLatitude and LocationLongitude
If the respondent completed the survey using the Qualtrics Offline App on a GPS-enabled device, this data will be an accurate representation of the respondent’s location.
For all other respondents, the location is an approximation determined by comparing the participant’s IP address to a location database. Inside the United States, this data is typically accurate to the city level. Outside the United States, this data is typically only accurate to the country level.
This data will not be available if responses have been completely anonymized.
Qtip: Latitude and longitude data values are based on city/zip code and cannot be used to identify a specific location or individual.
DistributionChannel
This column describes the method of survey distribution.

In the above example, the survey was emailed to participants.
Qtip: If this column says “test,” this was a test response. “Preview” refers to a response completed with the preview link.
UserLanguage
If your survey has multiple languages, the respondent’s language code will be displayed in this column.
Qtip: For more details on setting the language for a participant, see the linked support page.
Qtip: To set up display logic and make custom content based on users’ languages, try Q_Language instead of UserLanguage.
Even if a survey has only 1 language, every response should have data in the UserLanguage column, including previews. The only exception is test responses, which will have a blank UserLanguage column.
LastSeenFlowID
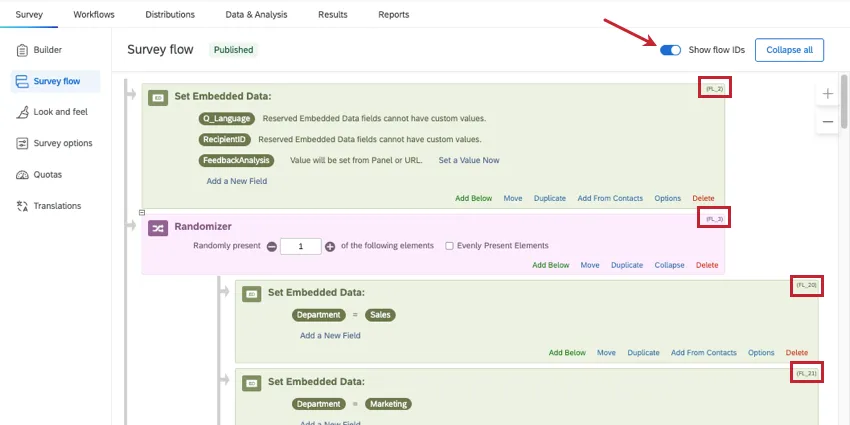
The LastSeenFlowID, also known as Last Seen Flow ID, tells you the last survey flow element the respondent saw before they stopped the survey. Elements are represented by their flow IDs (e.g., FL_XX).
An element is “seen” when it appears on a page the respondent has submitted. In other words, the last elements encountered before the “Next” button was pressed.
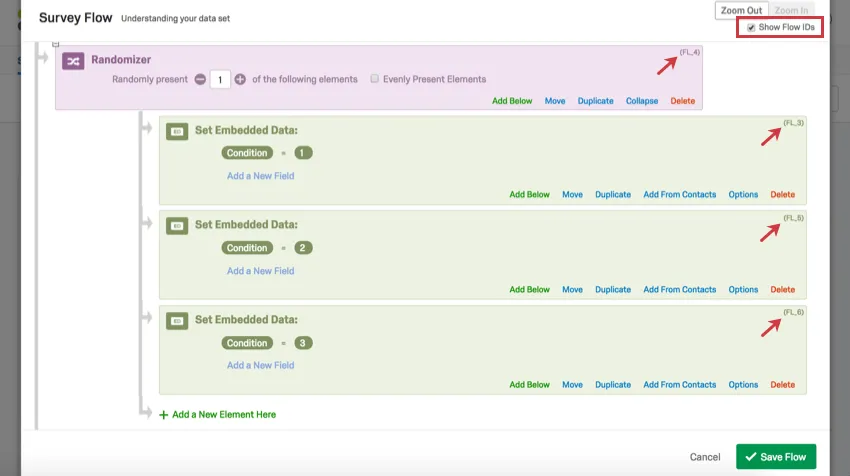
Qtip: To learn an element’s flow ID, open the survey flow, then select Show flow IDs. These will appear in the corner of each element.
Qtip: Responses collected before July 29, 2026 will not contain LastSeenFlowID.
LastSeenQuestions
The LastSeenQuestions, also known as Last Seen Question IDs, tells you the last question IDs (QID#) the respondent saw before they stopped the survey. Because there can be multiple questions on a page, there may be multiple QIDs in this field.
A question is “seen” when it appears on a page the respondent has submitted. In other words, the last questions encountered before the “Next” button was pressed.
LastSeenQuestions will include questions even if they were hidden with in-page display logic.
Qtip: Responses collected before July 29, 2026 will not contain LastSeenQuestions.
Qtip: Aren’t sure which question corresponds to which QID?
- In the survey builder, you can search questions by their IDs.
- Display QIDs in the survey builder on all questions by selecting Tools, then Show Internal IDs.
You can also find QIDs in the question’s column header in your exported data, if you exported with Use internal IDs in header.
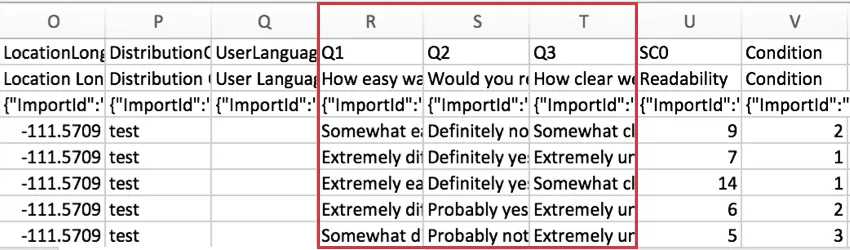
Question Responses
The next columns in the dataset display the answers provided for each survey question. Columns are headed with the question numbers (e.g., Q1) and then the beginning lines of the question text (e.g., How easy was it to understand the reading assignment?).
Simple questions (text entry, multiple choice – 1 answer, etc.) will be contained in 1 column, but more complex questions with multiple statements (matrix table, side by side, etc.) will be spread across multiple columns.
Qtip: Different question types store data differently, so we recommend generating sample data and checking its downloaded form before launching your survey. That way you can be sure you’re obtaining the type of results you want.
By default, data is downloaded in labels (i.e., the exact text of questions and answers). However, you can also choose to export it as values (called “recode values“) for each answer choice. For example, on a 5 point scale, “Strongly Agree” would display as a “5”, making it easier to find a mean or do other statistical analysis.
Qtip: For more details on exporting in label vs. value format, and other export options that can affect data formatting, see Export Options.
If the numeric coding of your choices doesn’t match your expectations, you can always return to the Survey tab to change them and then export your data again. You can also export your survey to Word to retrieve a code book outlining how each choice is coded in the dataset.
Guide to Specific Question Types
The exported data will often look different based on the question types you chose to include. These differences are explained on the question’s individual page. We have linked to the relevant sections below.
- Multiple choice (Including how multiple-answer exports appear)
- Matrix table
- Text entry
- Form field
- Slider
- Rank order
- Side by side
- Constant sum
- Pick, group, & rank
- Hot spot
- Heat map
- Graphic slider
- Drill down
- Net promoter® score
- Highlight
- Signature
- Timing
- Meta info
- File upload
Questions in Loop & Merge Blocks
When viewing your data, each loop is treated as a separate set of questions. If you have 5 possible loops, you will see the looped questions repeated 5 times in the data. Even if a respondent isn’t shown all of the loops, all possible loops will be represented in the data.
See Viewing Loop Order in Your Data.
Scoring Results
For surveys using Scoring, the score for each category is included in the dataset. Each scoring category gets its own column of data. In the example below, the survey only had 1 scoring category, called “Readability.”
This score is a sum of the points the respondent earned in the category, not an average.
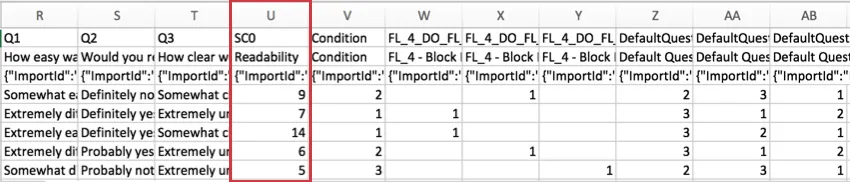
The “SC” in the header stands for “Scoring Category,” and the number represents the number category it is, counting up from zero. Because the example survey above has 1 scoring category, we see SC0, but if there were more, we would see SC1, SC2, and so on.
Qtip: For data on average score, minimum, maximum, and other statistics, check out your Results. There’s usually a Statistics Table for your scoring categories towards the bottom of the report.
Embedded Data
For surveys using embedded data, embedded data information is included in the columns following scoring information.
Only embedded data fields saved in the survey flow are included in the downloaded dataset. Embedded data fields with values from a contact list or URL can be saved to the survey flow at any point before or after data collection. In addition to creating your own embedded data, Qualtrics provides a list of pre-built fields to choose from. See Built-In Embedded Data Fields for more details on how each field works and the kind of data they result in.
Qtip: For surveys created after June 8, 2026, embedded data fields with names longer than 45 characters will have a hashed internal ID in the ImportId row (the third header row) of the export file instead of first 45 characters of the field name (for example, 1f7b296ef91a88028e819ac1bc8361ce). The column's human-readable header (first row) displays the full field name.
Qtip: Curious about the Q_DataPolicyViolations column? See Sensitive Data Policy. Not every license has sensitive data policies enabled, so if this column is blank, don’t worry. For help interpreting fraud detection fields (bot detection, duplicate submissions, etc), see Fraud Detection.
Randomization Data
Qtip: For step-by-step instructions on how to include randomization data in your response data export, see Exporting Randomized Data.
You will see randomization columns following your question response data. There will be a column for each randomized element in the survey. For example, if you randomized a block with 5 questions in it, you’ll have 5 columns, 1 for each question. If you had a randomizer in your survey flow with 7 elements under it, you’d have 7 columns, 1 for each element that was randomized.
If you randomize the order of all elements presented, the column will show what order that element was presented, e.g., 1, 2, 3, and so on.
Example: In the screenshot below, the order of the questions was randomized and the columns show the order each question appeared in the sequence. Note that the question numbers are in the headers.
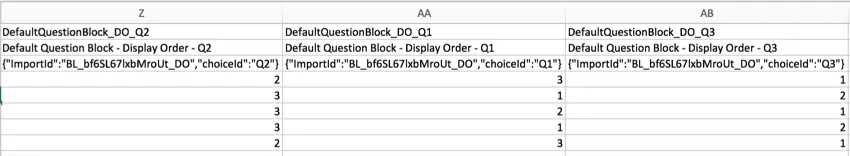
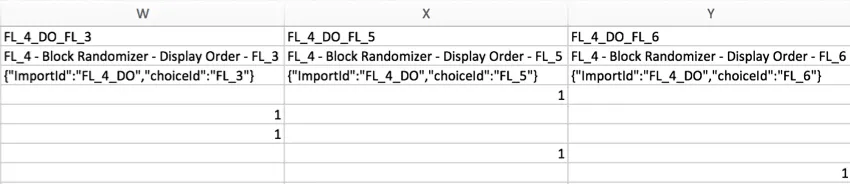
When you randomly present 1 element out of a list of several, elements that were displayed will be marked as 1. Elements that were not displayed to the respondent will be blank.
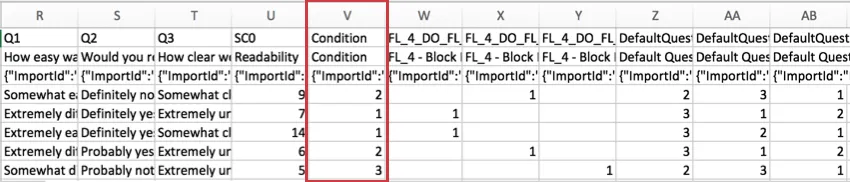
Example: In the example below, 1 element was randomly presented from a list of 3. The columns indicate which element was shown to the respondent by placing a 1 beneath the column labeled for the element presented.
Qtip: Confused about how to read the headers in the second example? Because the survey flow randomizer was used in this example, the column displays flow IDs instead of Question IDs. You can retrieve flow IDs by going to your survey flow and selecting Show flow IDs in the top-right corner. Flow IDs cannot be edited.
Troubleshooting a Data File
This section will go over some common questions and concerns that many users have regarding their data file. We’ll also highlight some helpful features you can use to customize your data exports.
Guide to Exporting Data & All the Options Available
For instructions on how to export data, see the following support pages:
- Exporting Response Data: Step-by-step instructions and tips.
- Data Export Options: Guide to additional options, such as exporting randomized data, labelling seen but unanswered questions, exporting in value vs. label format, and so on.
- Data Export Formats: Guide to different file types you can export.
Customizing the Columns Included in the Export
To customize the columns in your exports,
Exporting Filtered Data
To export filtered data,
Features That Do Not Have Data to Include in an Export
If you have included a descriptive text (such as an introduction paragraph with no attached question) or a graphic (such as a picture with no attached question), these fields will not have their own columns in the data export, since they have no answers for the respondent to select. If you noticed question numbers being “skipped” in your survey export, it may be because you have fields like this included.
However, if you randomized when descriptive text or graphic fields are displayed to respondents, you can find this data by exporting the randomized data. See Exporting Randomized Data for step-by-step instructions, and see Randomization Data for a guide on how to read the output.
Certain Answer Choices Excluded From File / How to Exclude Values from Analysis
See Exclude from Analysis. Some values, based on how they are worded, are excluded by default. These responses are recorded and can be added back to the data at any time with no issue.
Qtip: If you do not have any values excluded from analysis, and have not collected a lot of data yet, it may be that no respondents have selected that answer yet. If this is an answer with display logic on it, be sure to double-check the conditions of the logic.
Embedded Data Excluded From File
Make sure the embedded data element is added to the survey flow and is pulling in all contact fields.
For deeper troubleshooting with embedded data, please see the linked support pages.
Other Fields Excluded From File
Make sure you have Download all fields selected when you export your data. Randomized data is not included by default, but can be added according to these instructions.
See additional export options.
Customize Question Numbers
See Auto-Numbering Questions and Question Numbers.
Customize the Question or Answer Wording in the Data Export, but not the Survey
You can use question labels to change how questions themselves are worded in the export, without affecting how the questions appear to survey respondents. You can use variable names to change the wording of answer choices. It is safe to edit question labels and variable names at any time during survey collection.
Question labels and variable names also affect how this data appears in results and reports.
Example: Your questions and answers are really long, and you want to shorten the names for easier skimming and reporting.
Wording of Questions / Answers Differs from Survey Editor
If the wording of questions is different from what you see in the survey editor, double-check that there are no question labels added. If the wording of your answers differs from what you see in the survey editor, check your variable names under recode options. If you created your survey from a copy of an older version, these settings can be carried over. It is safe to edit question labels and variable names at any time during survey collection.
CSV Export Issues
If your CSV export doesn’t look right – e.g., has symbols instead of the expected text or has columns running into each other – export the data in TSV format instead. TSV is especially useful for data that contains special characters.
For additional troubleshooting, see Trouble with Downloaded CSV Files.
Response Files from 360, Engagement, Lifecycle, and Ad Hoc Employee Research Projects
For 360, see Understanding Your Response Dataset (360).
For all other EX projects, see Understanding Your Response Dataset (EX).
File Format Differences
Though all file types download the same data fields described above, each features a layout that may be slightly different.
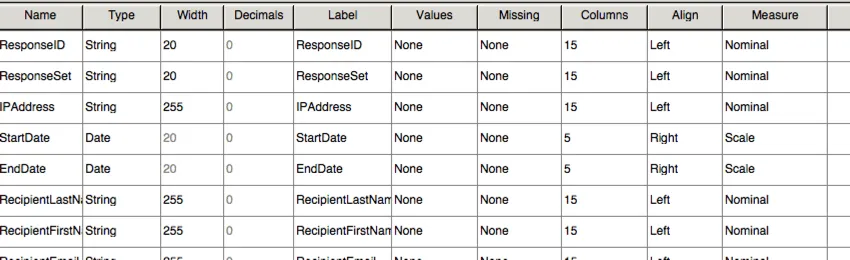
SPSS
The Data View in SPSS includes the exact same layout as the CSV file, with fewer headers.
SPSS includes another view, called the Variable View. This view lists all the variables from your dataset with information about each, such as the variable type and the possible values.
XML
The XML file type is often used when integrating Qualtrics data with a third-party database. This file type can be parsed easily by common database software.
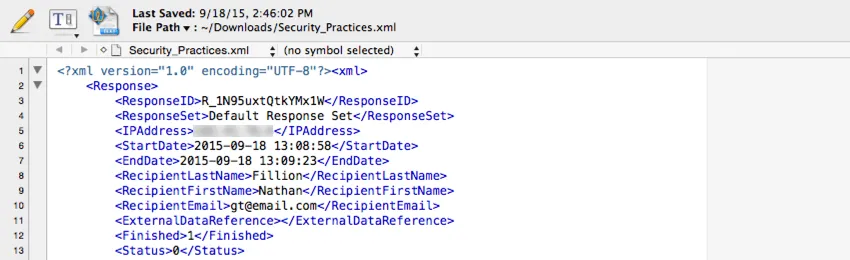
An XML element is provided for each response, with a child element for each piece of data stored in that response.
FAQs
Why is my contact list information not appearing in the downloaded data?
Why is my contact list information not appearing in the downloaded data?
If you forgot to put Embedded Data in the Survey Flow, you can add it to your data retroactively, so long as there are values in the contact list. See the Embedded Data support page for further instruction.
Note that if the contact list information you’re trying to download was not included in the contact list at the time the members took the survey, retroactively adding the Embedded Data fields to the Survey Flow will not add that information to the downloaded data later.
How do I export my data into a CSV or SPSS file?
How do I export my data into a CSV or SPSS file?
What are the numbers in my exported data file, and can I change them?
What are the numbers in my exported data file, and can I change them?
How do I export either the answer choice text or the recode values my respondent selected in the survey?
How do I export either the answer choice text or the recode values my respondent selected in the survey?
Why is my exported data file not showing all of my columns of data?
Why is my exported data file not showing all of my columns of data?
Data can also be excluded from the export if you you have a filter applied when you export the data.
If you are missing information that is stored in a contact list, you will want to make sure that you added Embedded Data to your Survey Flow so that your survey knows to collect this information. This Embedded Data can be added retroactively if you forgot the first time. You can find instructions for this on the Embedded Data support page.
If redaction is set up for a topic, will data exports also redact that data?
If redaction is set up for a topic, will data exports also redact that data?
Why have my contact fields been replaced with “******”?
Why have my contact fields been replaced with “******”?
That's great! Thank you for your feedback!
Thank you for your feedback!