What is employee performance management?
Performance management is all about balancing the relationship between employees and the value they deliver to a business through communication with, and support from, their line manager.
It includes performance evaluation and reviews, which establish business objectives, help to improve performance, and give employees more accountability.
Performance management is about continuously supporting your employees to attain individual goals in a timely manner, so that your business achieves its wider objectives. It’s a multifaceted set of processes and behaviors to encourage high performance. And the very best performance management creates a close link between successful employees and successful companies.
Free eBook: The EX High Performing Benchmark Report
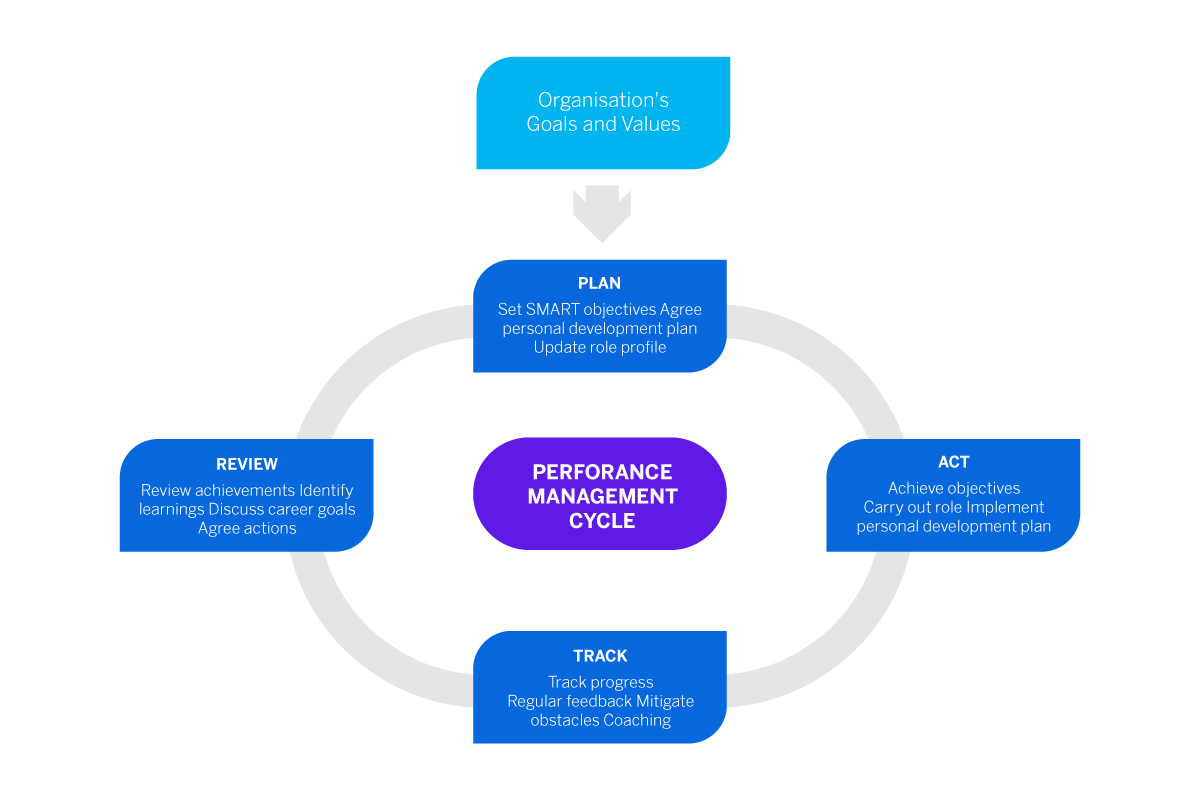
What is the performance management cycle?
Traditional performance appraisals would run on a yearly cycle. An employee would sit down with a manager at the start of the year to set objectives, then 12 months later they would analyze how they’d done. These traditional performance management systems usually followed this routine:
- Plan: setting SMART (Specific, Measurable, Agreed, Realistic and Timely) objectives, and other development planning.
- Act: the employee works and achieves their objectives, with consistent performance coaching from their managers and the wider organization.
- Track: employees log their progress, reaching milestones on their way to bigger targets.
- Review: a formal performance appraisal sit-down between a manager and employee, to maintain or evolve individual objectives.
- Reward: Employees with high performance are recognized for their sterling work with rewards such as an annual bonus, salary increase, promotion, autonomy or awards.
The performance management cycle
Why is performance management important?
It helps you retain your talented people
People are your business’s most important and valuable asset, so it’s essential to find ways to retain your employees. Replacing an employee can be twice as expensive as keeping one, and 52% of all voluntary resignations are preventable – if leaders know what’s causing disengagement. When they have the opportunity to work continuously and autonomously towards performance goals, while highlighting areas they want to work in, employees have good reasons to stay with your company.
You can identify risky individuals
Performance management enables you to identify under-performing or unmotivated employees. In some industries, underperforming employees pose real risk, and the earlier you can identify them, the quicker you can re-engage them. Performance management can help you to find out what the problems are, and support the employee back onto the right path.
There are many reasons why an employee may be struggling: mental or physical health, burnout, personal issues, lack of training, poor resources, workplace conflict, having too high a workload or not being challenged enough. Performance management data will flag up issues with a particular employee, and then it’s up to you to have an open, human-to-human conversation to dig deeper and resolve the issue.
You’ll engage and motivate your employees more
Higher employee engagement leads to improved customer satisfaction, which leads to increased profitability. A continuous approach to performance management means that you ensure your employees are working towards goals and objectives in real time, allowing them to get the most out of their skills and roles, as well as iron out issues before they become bigger and more problematic. This approach gives employees greater job satisfaction and a sense of achievement.
You’ll identify star performers
An agile performance management approach means that you can readily identify those employees who are performing well, going the extra mile, and are perhaps suitable for promotion.
Business performance will improve
All of the above contribute to better business performance overall. Employees who are engaged and thriving deliver better work and are more motivated to innovate and keep making progress. Performance management, when done well, brings value to the whole workforce and organization.
Performance management challenges
1. Unsuitable systems with poor performance standards and metrics
There’s no point getting halfway through developing a performance management process then deciding to try to fit it into an existing software system. Unless you put in place consistent standards and metrics, you’ll erode credibility and fairness in the way you manage performance.
It’s also essential to link it to your human resources strategy and HR processes for a joined-up picture: talent management, onboarding, learning and development, compensation and rewards and succession planning.
Start with the performance management systems – the best ones are customizable, with all the basic functions you need, and options to add on ones that are more specific to your business. A decent system will automate data collection, consolidate and centralize information, and provide tools for analysis and reporting.
Then build your strategy with your system.
2. Inadequate feedback and communication
When employees don’t receive feedback, they’re left uncertain about what they’re contributing to the business, and when you add in poor communication, they’ll be unclear about their goals and expectations. No employee can develop properly like this.
The key here is to train managers to communicate well and deliver constructive feedback. Their team will flourish when encouraged to develop, and it will foster a positive work environment.
360 feedback combines timely feedback from an employee’s manager, direct reports, team and the employee themselves. These surveys are becoming more popular in employee performance management, and the most successful ones are:
- Relevant – aligned with business goals and performance targets
- Credible – people need to be trained to understand and use them effectively
- Accountable – 360-degree feedback insights need to drive tangible action and continuous improvement
- Completed – it’s up to management to encourage people to take 360 surveys seriously and complete them
3. Engaging employees
Gone are the days of performance management being only what your boss told you to do. There’s now a manager/employee shared responsibility to do a good job and achieve results.
Yet when employees are not fully invested in their work, their performance levels and productivity drop. Low engagement can be for a myriad of reasons, such as lack of recognition and reward, poor work-life balance or a toxic work environment.
Employee listening is essential here, asking employees to provide feedback about their experiences and suggest improvements. You’ll glean valuable insights, be able to pinpoint concerns, then act to improve your employees’ experience and performance.
When employees take shared ownership of their performance management process, they’re more committed, more motivated and more engaged.
4. People need to feel they belong
Employee performance drives business results. Only shortsighted companies don’t take effective performance management seriously. Employees also need to feel like they belong to an organization and are doing things they value.
A culture of belonging is linked to an extraordinary 56% increase in job performance, a 50% drop in turnover risk, and a 75% reduction in sick days. It’s essential to foster a culture of belonging that nurtures everyone at your company, whatever their level. When you implement a culture of belonging:
- Each individual understands how their team efforts contribute to the organization’s wider vision and greater good
- Each manager knows their team well, appreciates everyone, and is equipped to monitor and manage team performance effectively
- Leaders, who have a clear appreciation of their people as well as the company’s strategy, purpose and values, will find they deliver the expected results
Without a culture of belonging woven into the company, departments work in silos, employees are disengaged, and even the most impressive, high-tech performance management systems and processes are wasted. Instead, a culture of belonging does much of the heavy lifting when it comes to ensuring employees perform at their best.
5. Make learning a continuous process – for employees and managers
Few people want to remain static in a job, doing the same thing day in, day out, and not developing – and do you want people like this in your organization anyway? The best businesses create an environment where their people can develop, by:
- Goal setting
- Making full use of feedback
- Offering training, coaching, and development activities
- Tracking and measuring development progress
These apply not only to your frontline and shop floor workers, but also to your managers. Without proper training, your managers may lack the skills needed to lead teams, evaluate employees, provide feedback, set goals and support their growth. For example, implement leadership development programs, or schemes where experienced senior managers mentor junior managers.
You’ll notice how similar continuous learning and performance management are. Get learning right for all levels and strong performance will follow.
Technology in performance management
No organization that cares about its employees’ success in achieving goals, growing professionally, and being productive, can afford not to use performance management technology. The right software, as a performance management system:
- Defines and sets your company goals; employee performance expectations can be aligned with business objectives
- Sets clear expectations for both managers and employees
- Sets performance standards (e.g. time, quality, output or sales) which are helpful parameters in managing employee performance
- Encourages a culture of effective communication resulting in engaged employees whose individual objectives align with business objectives
- Determines your training and development needs – measuring employee performance is pointless if it’s not backed up with relevant training and development
What is a performance management system?
It’s a mechanism for tracking employees’ performance consistently and measurably. Spreadsheets and manual tools are out, in favor of performance management software, powered by AI, natural language processing (NLP) and machine learning.
Employees can report regular, candid feedback on how they’re performing against their individual goals, then evolving those objectives as they’re reached or become irrelevant due to changing business priorities. It also includes giving constant and job-specific coaching in between major reviews.
Practically speaking, your performance management system can include many different, interconnected processes, such as:
- Personal achievements: a list of major successes in an employee’s career aligned to the company’s strategic objectives
- Employee journey: from application to exit and all the moments in between
- Attendance statistics: how many days absence and presence
- Individual goals and objectives: these should be matched to the job description and required competencies
- Surveys: including pulse, 360 feedback and employee engagement
- Employee development plans: with actions and objectives for the employee
- Regular performance appraisals: usually led by a manager
- Leadership development programs: to nurture your current leaders and identify your future ones
What you include will depend on your organizational structure and job-specific skills and competencies.
An effective performance management program should be:
- Tailored to your organization: and your industry and structure, as well as taking into consideration your current appraisal system and performance periods
- Supported by senior management: if the C-suite isn’t signed up to your performance management system, it will eventually fail, as employees realize their objectives aren’t really tied to business’ goals or their successes are not properly recognized
- Clearly communicated: employees should understand what’s expected of them and how they fit into the company’s wider goals
- Fair, consistent and constant: from the vice president of sales to the frontline junior sales rep, everyone should feel as though the system will assess them even-handedly and reward their successes
- Measured properly: you should use performance metrics that have been tested and validated outside your organization, to avoid any biases or favoritism
- A model of continuous development: if it’s simply a box-ticking exercise, it won’t work
- Linked to rewards: you can integrate performance-based rewards as part of your system: a powerful way of rewarding good work
- Trackable: managers and employees should use performance management software that allows them to log how they’re doing and get an idea of how they’re tracking against objectives
Performance management and employee engagement
“If you do a job you love, you’ll never do a day’s work in your life”, so the saying goes. Every employee wants job satisfaction, motivation, and engagement.
So, how can a good performance management process contribute to your employees’ experience? It:
Increases engagement and employee motivation
With continuous performance management, leaders help employees to work towards goals and objectives in real-time, support them to get the most out of their skills and roles, and nip issues in the bud.
Sets clear objectives and expectations
We all like to know what we are doing, when, and with what available resources, so we can simply get on with the job. SMART goals in performance management provide employees with clear objectives to strive towards and the opportunity to contribute to their development. Defined expectations mean your employees always know what’s expected of them, which reduces work stress and conflict, and in turn means that leaders can be confident that everyone is working to the best of their abilities.
Identifies development and progression opportunities
No employee wants to stay in the same role for the rest of their life. With performance management, employees can analyze their own career advancement, and choose the areas they want to develop and work towards. Regular catch-ups with managers review their progress and ambitions.
Shines a spotlight on training gaps
Another major benefit of employee performance management is the ability to identify areas where people would benefit from further staff training and development opportunities. Working with SMART goals and performance management tools also helps employees to highlight these areas themselves and communicate specific training needs to managers and leaders.
Sounds a wellbeing early warning system
Wellbeing at work is vital. A study by Gallup showed that 61% of employees give ‘greater work-life balance and better personal wellbeing’ as a reason to change jobs.
Where a performance management system flags up an employee as underperforming or lacking motivation, an open conversation with a line manager in a performance appraisal can help you get to the root of disengagement. You can then put measures in place to help and support the employee so they choose to stay, and not leave or burn out.
The impact of culture on performance management
It’s your organizational culture that shapes how you do performance management. A traditional culture that’s very much bottom-line-driven may set employees specific targets early in the year and measure their performance strictly against those. A collaborative and agile culture may need only a light management touch, allowing employees to take risks, innovate, and bounce ideas off leaders.
Whatever type of company culture your organization has, it’s essential that the performance management process you choose has a positive effect on it. All too often, performance reviews that only happen once or twice a year are ineffectual, their goals and timeframes unrealistic or unrelated to what’s going on in the now. Your people then may view the performance management process as something of a waste of time – a box-ticking exercise that they hope may lead to a promotion or salary increase. Or worse, they may disengage completely and become quiet quitters.
The worst thing your performance management process can become is a mechanism for identifying and exiting poorly performing employees. Instead, it needs to focus on all those things that make a company culture really great, so that people want to work there, such as:
- maintaining a clear vision
- enabling both team and individual achievement
- growth
- continuous feedback
- regular check-ins
- recognition
Future trends in performance management
Continuous performance management – the new approach on the block
Many big brands have largely jettisoned the annual performance management approach, and in place of annual reviews is now continuous performance management.
The ‘Plan – Act – Track – Review – Reward’ cycle is still there, but it has been shortened, allowing employers to get more connected to their employees, break achievement into smaller chunks, gather real-time feedback, and avoid issues festering for months before there’s an opportunity to deal with them.
Continuous performance management means more regular communication about what’s going well, and how that can be maintained, as well as what could be improved. It’s a two-way, ongoing process where employees feel empowered to share feedback on their progress and on the managerial support they’re receiving, and managers feedback on employee efforts.
This agile approach allows more flexibility, rapid problem-solving and opportunity for feedback and action. It ties neatly in with the five objectives of performance management, because:
- Priority is given to training and employee development
- Goals are more short term, more flexible, and can be achieved quickly
- Collaboration and communication occur naturally in a continuous environment
- Good performance can be rewarded, and poor performance picked up to be remedied much sooner
- Rewards can be made more frequently