
One of the most critical decisions your business will ever make is how to price your products. Your price determines the quality of your product. It sends a signal about your brand. It determines which channels will distribute it. It establishes your profitability. Your go-to-market price decision will echo throughout your entire business.
So conducting pricing research may be the most critical research you ever do.
Here’s the bad news. Price-point research can be wildly misleading if you don’t use a sound methodology. People make famously unreliable buying decisions in research settings because their real money isn’t at stake.
But here’s the good news. There’s a statistical research technique that was designed especially to intelligently suggest the correct price by simulating the trade-off decisions customers make in the real world.
Conjoint Analysis – How You Know What To Charge
Conjoint Analysis is your best friend when it comes to establishing your price points because it comes close to forcing customers to behave like they would in the real world using trade-offs. When a respondent answers a conjoint analysis survey, they are presented with different product features at different prices and asked choose which one they would buy. This trade-off process reveals which features are most preferred and drive willingness to pay.

Like hotel rooms, most products offer an array of different features at different pricing points. Conjoint analysis helps you isolate which features are driving willingness to pay.
Willingness-To-Pay
Willingness-to-pay is the maximum a customer will pay for a product or service. If a product is priced above the Willingness-to-Pay, customers will not make the purchase. Willingness-to-Pay can be estimated through testing trade-off comparisons.
Consider a thirsty consumer faced with two simple choices: a large Coke at $1.50 or a medium Pepsi at $1.00. The consumer values the large Coke at $2.00 and the medium Pepsi at $1.25.
Which would the consumer purchase?
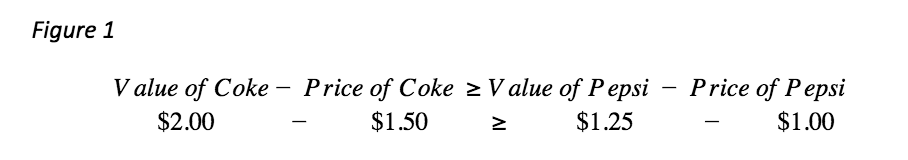
This consumer would choose the Coke because it brings more value at $0.50 compared to $0.25 for Pepsi. This value is sometimes called consumer surplus in economic terms. If we rearrange the terms, we can obtain the Willingness-to-Pay equation:
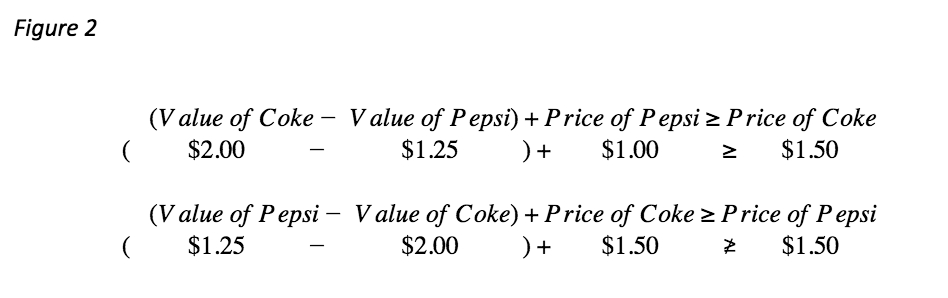
We would say that the Willingness-to-Pay for large Coke is $1.75 (if medium Pepsi is the only other option). The Willingness-to-Pay for medium Pepsi is $0.75.
If the Willingness-to-Pay is greater than the actual price, the consumer would make the purchase. So the consumer would purchase the Coke but not the Pepsi.
But how do we obtain these values?
Using conjoint analysis, we can estimate the value of all the features or attributes of different products. If price is included as a feature of the conjoint study, it can serve as “exchange rate” to transform the value into a dollar amount. From here, the differentiation value of the different levels can be computed. Finally, once two packages have been chosen to compare, the Willingness-to-Pay figure can make an understandable valuation between the packages.
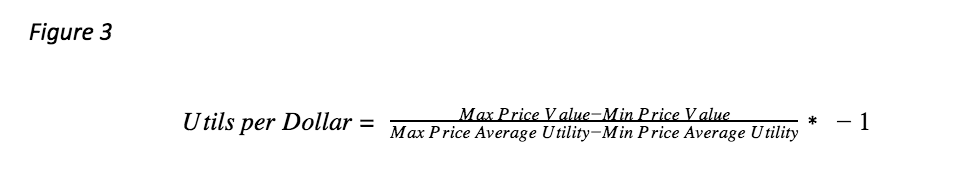
Step 1 – Find the Dollars per Util using price as an “exchange rate”
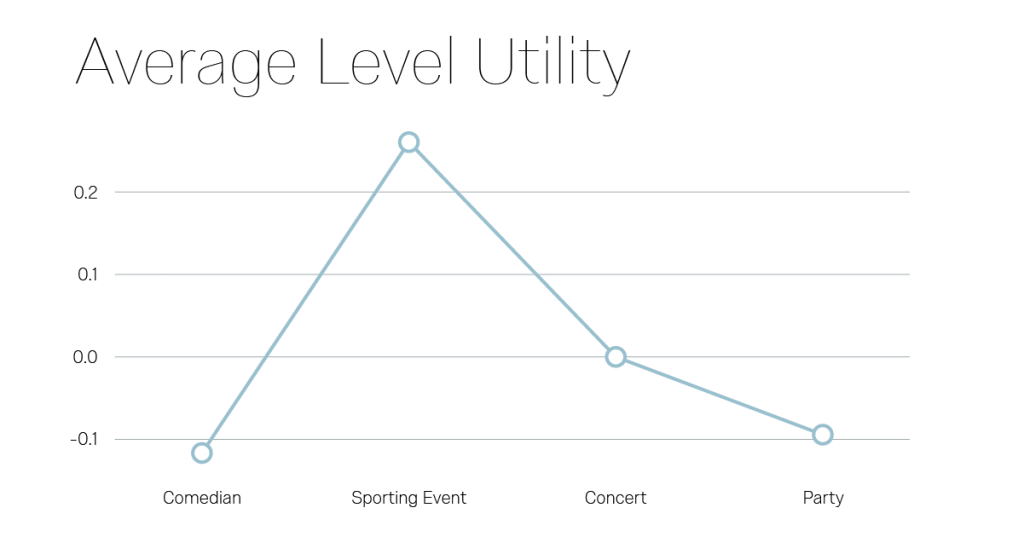
Conjoint analysis produces utility values for each respondent within each feature. Utility is measured in Utils – which have no units and a relative scale. Utility is synonymous with value, preference or satisfaction. Higher utility means higher value; Lower utility means lower value.
When price is included in a conjoint study, it can be used to convert utils into dollars. If price is evaluated on a continuous scale, then the conversion rate would just be the beta coefficient (or part-worth) of price times -1. If price is evaluated as a categorical variable, then a continuous estimate can be made by measuring the difference in price divided by the difference in utility times -1. If the average utility for price is fairly linear, use the max price values and utility and the min price values and utility. If the average utility is not linear, try to choose values and corresponding utilities that make the most intuitive sense.
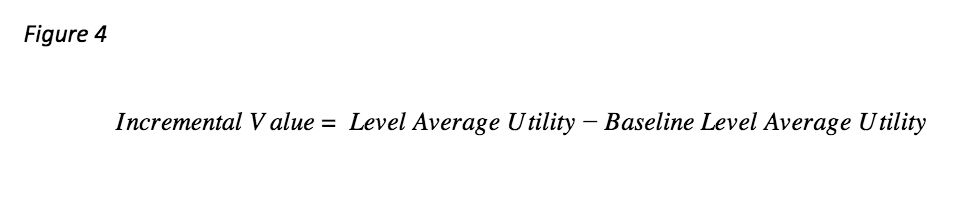
Step 2 – Find the incremental value in utils that a level or attribute brings
For each feature, choose a level to be the baseline – generally, we use the level with the lowest utility so that differentiation value is always positive. Find the difference in utility between each level and the baseline.
Step 3 – Convert the Incremental Value to Differentiation Value
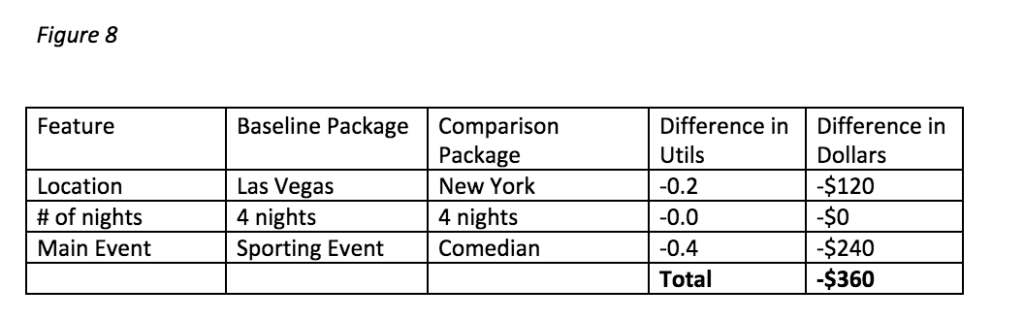
In this example, respondents were asked what kind of live entertainment they preferred. A comedian was the least valued event and was used as the baseline. So respondents will need to get more value out of comedians by lowering the price in order to select this option. This differentiation value is the incremental price at which a respondent is exactly indifferent between two packages.
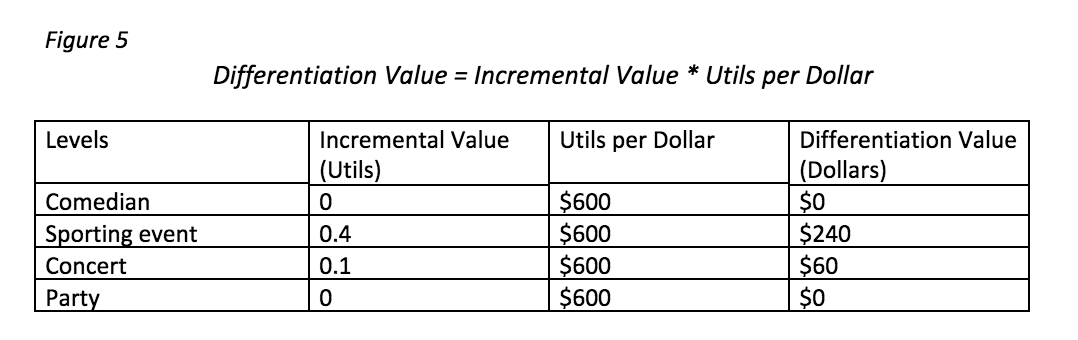
In this example, respondents would pay $240 more for a sporting event than a comedian and still have exactly the same value.
Step 4 – Add the reference price to get Willingness-to-Pay
Willingness-to-Pay is a measurement for the entire package compared to another package. Find the differentiation values for all the features and choose your comparison packages. Let say we are considering offering a 4-night trip to Las Vegas with a Sporting Event for $550. First we add up all the Differentiation Values from the baseline.
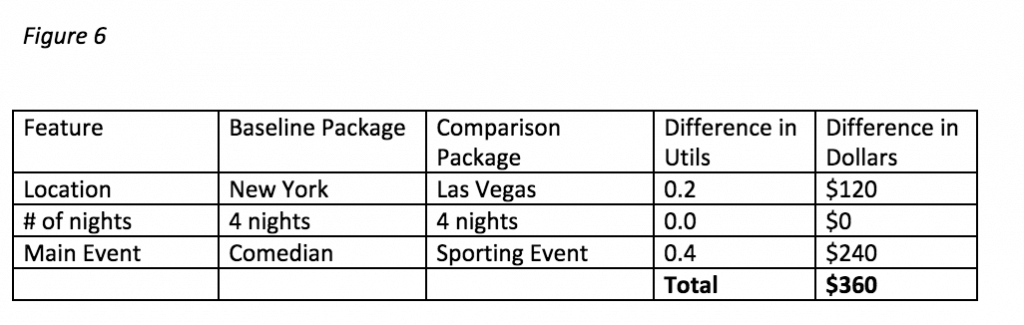
The reference price is the minimum price, $250 in the example. Therefore, the Willingness-to-Pay for our trip is $610. If the actual price is less than the Willingness-to-Pay, respondents will purchase the trip. In this case, $550 (actual price) is less than $610 (Willingness-to-Pay), so respondents will purchase our trip over the baseline trip of New York for 4 nights with a comedian at $250.
Willingness-to-pay can be calculated for any comparisons, not just the lowest valued levels.
In this example, if the baseline is offered at $250 and our package is offered at $550, our Willingness-to-Pay for our package is $250 + $240 = $490. Since our $550 (actual price) not less than $490, respondents will purchase the baseline package over our trip.
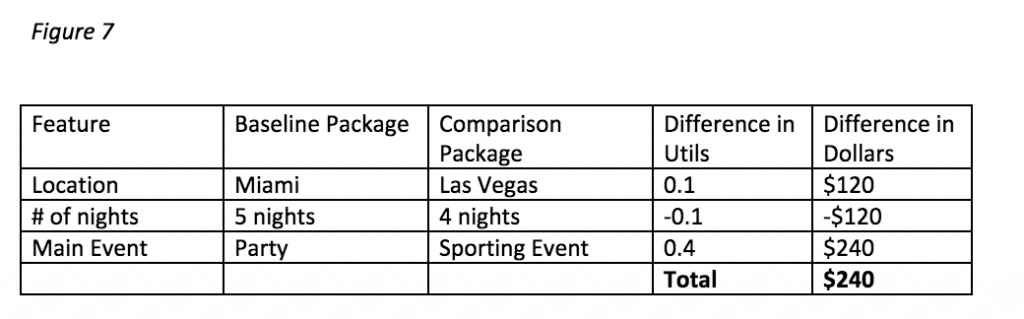
As a final example, we can compute the Willingness-to-Pay for the worst possible package. Let say the baseline package is offered at $550 and our comparison package is offered at $250.
In this example, respondents Willingness-to-Pay for the comparison package is $190. This is less than actual price, so we respondents will choose the baseline.
Final Notes
Qualtrics’ Product & Innovation Research provides the average level utility, so the Willingness-to-Pay can be calculated based on average respondents. On full-service projects, it is possible to calculate the Differentiation Value for each respondent based on their individual utilities. This is useful for determining the percentage of respondents who will choose between different packages. Within the conjoint solution, the simulator provides a breakout of the percentages of respondents who would choose different packages based on their levels.
In these examples, we have always been comparing two packages. However, the comparison could also be a “none” option. Choosing “none” provides utility as well. “None” can be a feature in a full-service project. The same calculations apply.
Alternative Methods to Measure Willingness-to-Pay:
- Gabor-Granger – Iteratively raise or lower prices until a respondent switches
- Becker-DeGroot-Marschak – Incentive customers to be truthful by having customer pay if their stated WTP is lower than a randomly generated number
- Van-Westerndorp – Not recommended for this type of study as there are theoretical issues.