Text feedback is the closest we ever get to a 1:1 conversation with every customer, every citizen, and every employee. In free text, our customers get to tell us what they really care about and why, unconstrained by the questions we decided to ask them. It’s where the customers get to decide what’s most important.
However, internalizing ten thousand pieces of feedback is roughly equal to reading a novel and categorizing every sentence. It’s time-consuming, laborious, and hard to make text actionable. To effectively understand open-text feedback at scale, you need to either scale your team reading feedback or use a text analytics tool to surface the most important pieces and themes of feedback. Let’s go through the basics of text analysis together, and give you some helpful tools to consider using.
Effortlessly integrate feedback collection, research techniques and analytics with Qualtrics
What is text analysis / analytics?
Text analysis is the process by which information is automatically extracted and classified from text data. Within the field of Experience Management text could take the form of survey responses, emails, support tickets, call center notes, product reviews, social media posts, and any other feedback given in free text, as opposed to a multiple-choice format. Text analytics enables businesses to discover insights from within this unstructured data format.
Text analytics can help you answer two core questions:
- How are you performing on the topics you know about like wait time, service reliability, and cost?
- What’s lurking out there that you didn’t even think to look for like bugs in software, confusing onboarding process, or flaws in your product?
A powerful text analytics program can answer both of these – at scale – while keeping you connected to the voice of your customer and the next actions to take.
The two most widely used techniques in text analysis are:
- Sentiment analysis — this technique helps identify the underlying sentiment (say positive, neutral, and/or negative) of text responses
- Topic detection/categorization — this technique is the grouping or bucketing of similar themes that can be relevant for the business & the industry (eg. ‘Food quality’, ‘Staff efficiency’ or ‘Product availability’)
Both techniques are often used concurrently, giving you a view not only of what topics people talk about but also whether they talk positively or negatively when they talk about such topics.
These are broad techniques that encompass all other different ways of identifying emotions, intent, etc. It’s worth mentioning that some software claims to do emotion analysis from text — these tend to use the combination of words used in the text to arrive at the emotion.
This can be rather misleading because one could say “The flight was delayed” with anger, despair, joy (if they did something exciting at the airport), etc. but the text would never show the tonality or the expression behind the sentence.
Hence, using a combination of topics and sentiment from the words is the only way to ascertain emotion, rather than a ‘catch all’ algorithm.
Text analysis, text mining, and natural language processing (NLP) explained
It’s common when talking about text analysis to see key terms like text mining and text analysis used interchangeably — and often there’s confusion between the two.
There is a lot of ambiguity in the differences between the two topics, so it’s perhaps easier to focus on the application of these rather than their specific definitions.
Text Mining is a technical concept that involves the use of statistical techniques to retrieve quantifiable data from unstructured text which can then be used for further applications, for example, MIS reporting, regulatory non-compliance, fraud detection, or job application screening. Quantitative text analysis is important, but it’s not able to pull sentiment from customer feedback.
Text Analysis on the other hand is a very business-focussed concept that involves the use of similar techniques as text mining but enhances them, identifying patterns, insights, sentiment, and trends for customer or employee experience programs. Text analysis focuses on insights discovery for action taking within specialized fields like experience management.
As part of text analysis, there’s also natural language processing (NLP), also termed natural language understanding. It’s a form of sentiment analysis that helps technology to “read” or understand text from natural human language. Natural language processing algorithms can use machine learning to understand and evaluate valuable data, consistently and without any bias. It can be sophisticated enough to understand the context of text data, even with complicated concepts and ambiguities.
Hence, it is very important to use specialized text analytics platforms for Voice of the Customer or Employee data as opposed to general text mining tools available out there.
The importance of text analysis
Text analysis has become an important part of many business intelligence processes, particularly as part of experience management programs as they look for ways to improve their customer, product, brand, and employee experiences.
Before text analysis, most businesses would need to rely on quantitative survey data in order to find areas where they can improve the experience.
However, while still essential to any program, quantitative data has its limitations in that it’s restricted to a predetermined set of answers.
For example, a telecoms company may ask a typical customer satisfaction or CSAT question after a support call – ‘How satisfied were you with the service you received?’.
A follow-up question on customer surveys might look to find out the reasons behind the customer satisfaction score and might have options like:
- Waiting time
- Speed of resolution
- Advisor Attitude
- etc.
These options are limited and hence restrict the analysis that one can do for the scores. For example, if the customer’s reason is not listed in those options, then valuable insight will not be captured.
It would be almost impossible to list every possible reason in a customer survey, so including open text feedback helps to dig deeper into the experience.
This is where text analysis is crucial to identify the unknown unknowns — the themes the business does not know about but could be driving dissatisfaction with customers.
A better alternative is asking an open-ended question on the reasons for the score – ‘Why did you give us that score?’
Using survey text analysis techniques on that open-ended response then enables organizations to understand the topics customers mention when they are dissatisfied, but also helps in identifying extremely negative topics versus not so negative ones.
By being able to ask customers to say in their own words why they were or weren’t satisfied with the experience, you can better pinpoint customer insights. Text analytics helps you to be much more specific about the actions you need to take to improve their experience.
Being able to drive correlations between structured and unstructured data provides extremely powerful information on clear action taking.
It could be that there’s a strong correlation between people who talk about staff giving a clear explanation of the next steps and high CSAT, or between those who talk about the staff having a good knowledge of the product and high CSAT.
And with text analysis techniques, that data can be easily organized and fed into your experience management program in the same way as quantitative data in order to give you deeper insights into what drives the customer, employee, brand, or product experience.
By being able to see what people talk about when they talk in their own words about an experience and being able to perform sentiment analysis and topics in real-time, you can identify improvements that would otherwise have gone unnoticed using only qualitative data.
Business applications of text analytics
Text analysis is used in several different ways within experience management (XM) — if we break out XM into 4 pillars, we can see some of the most common use cases below:
Customer Experience
- Increasing Loyalty – Unearth key insights on the top issues promoters face so action can be taken to stop promoters from becoming detractors.
- Preventing Churn – Smart identification of competitor mentions with highly dissatisfied customers. You can also use text analytics to close the loop on negative sentiment or key topics like Churn Potential that appear in your customer feedback.
- Cross Sell/Up Sell – Combining Operational data like Customer Spend or Lifetime Value with upcoming renewal dates & analysis on their comments for topics like Loyalty, Reward, Incentives, etc. it’s possible to predict cross-sell potential using a combination of AI & text analysis.
Employee Experience
- Employee Attrition – Combine structured data like Engagement scores with Low sentiment around topics like Manager Support etc.
- Employee Wellbeing – Using real-time alerts on topics like Depression & Anxiety, intervention can be done where required.
- Work-Life Balance – Using text analysis to understand topics around Work-life Balance, identifying which segments of employees are most affected, and taking action accordingly.
Product Experience
- New Product Launch – Using text analysis to get valuable feedback on what features to improve or drop in the next release.
- Product Usage – Analysing warranty data can give key insights on what features to invest more in to increase usage, reduce service costs, etc.
Brand Experience
- Campaign Effectiveness – Analyse the top drivers of satisfaction for your campaigns alongside Operational data like Campaign Spend, Reach, etc to ascertain ROI.
- Brand Tracking – Understanding top themes that come to mind for the Brand & competitors.
Learn about Text iQ – our text analysis software
Topic modeling in text analysis
In text analytics, one of the most common techniques of providing structure to this data is a process known as topic modeling (sometimes referred to as categorization or taxonomy structures.)
Here we’ll explore what it is, how it works, and how to use it when analyzing text responses in multiple languages.
What is a topic model?
‘Topics’ or ‘categories’ refer to a group of similar concepts or themes in your text responses.
Say for example a utility company customer says “The dual tariff is expensive” while another says “The dual pricing package is expensive”, while the words they’re using are different (‘tariff’ vs ‘pricing package’) they are both referring to the same topic.
As such, both comments can be grouped under the topic ‘Tariff type’.
Topic modeling is a process that looks to amalgamate different topics into a single, understandable structure. It is possible to have a single-layer topic model, where there are no groupings or hierarchical structures, but typically they tend to have multiple layers.
This type of Parent-Child topic grouping is usually referred to as the Taxonomy, which involves grouping topics into broader concepts that make sense for a particular business.
Common examples could be a parent topic such as ‘Staff attributes’ that contain various children topics (or subtopics) such as ‘staff attitude’, ‘staff efficiency’, and ‘staff knowledge’.
The taxonomy is essential in Experience Management because it can be used for reporting to relevant stakeholders and routing feedback to the right teams and departments that can act on the insights.
For example in a Hotel business, the category ‘Staff Experience’ might be relevant for the Hotel Manager from a training perspective, while the Room Experience may be of specific interest to the Housekeeping Manager.
Having a taxonomy is essential in order to get the right insights, to the right people across the organization.
Key elements of topic modeling in text analysis
Number of layers
A topic model could have many tiers or hierarchical levels. However, it is best practice in Experience Management to restrict the model to two layers. Anything over two layers becomes extremely complex to understand and navigate for a business user, but more importantly, it is very tedious to build and maintain over time.
Exclusive Topics
Another basic concept in topic modeling is the possibility of having multiple topics for the same sentence or response. This means topics need to be mutually non-exclusive. For example, “My baggage loss was a cause of extreme frustration.” could be categorized under two sentiment analysis topics at the same time – ‘Lost Baggage’ and ‘Emotion — Frustration’.
Multi language
The topic model must be able to apply to all languages your business operates in. This means the model should be able to capture multilingual verbatims under the respective topics in your model. For example, if, a customer in London says “long queue at the branch for withdrawing cash using a cheque” while a customer in Paris says “longue file d’attente à la succursale pour retirer de l’argent en utilisant un chèque”, the topic model should be able to capture both pieces of feedback under its topic for ‘Branch Experience – Waiting Time’. So from a reporting perspective, there is consistency in the single model being used.
Learn more about text analysis in multiple languages
How to model topics for text analysis
In our experience, there are two ways to do topic modeling in an Experience Management program:
- Bottom up — the underlying dataset informs the topics being built
- Top down — topics are prescribed independently from the dataset
Bottom-up topic modeling in text analysis
When talking about topic modeling, you’ll often see plenty of jargon (‘bag of words’, ‘ngrams’, and ‘vectors’ being some of our favorites!) but for the purposes of this article, we’ve kept things simple with three main ways to build your topics based on an existing dataset.
Machine learning algorithms — this is a common feature in good text analysis software, and it often uses a reference dataset to come up with topics. These reference datasets are usually created using publicly available text data like research articles, media content, or blogs. While this is great from a linguistic perspective, it may be not helpful when you are using it to formulate topics for a VOC program or an Employee Experience program. So while it’s a useful method, you should be cautious of using learning algorithms alone to develop your topic model.
Statistical techniques — advanced statistical analysis like clustering can be used to suggest top keywords or combinations used based on their occurrence or frequency. While this approach is rudimentary, it makes a lot of sense when looking at experience data using text analysis techniques — especially if you think about specific touchpoints in the Customer Experience that are both specific and tend to have a larger volume of data.
Manual query — the simplest, and also a very effective way of bottom-up topic building approach is to formulate topics manually based on the word count of different words used in the dataset. This may sometimes be discarded as labor-intensive, inefficient, and archaic. However, there are many simple techniques that can be used to expedite this process and make it very relevant for your dataset.
Top-down topic modeling in text analysis
This type of modeling is a much more prescriptive way to build your model and there are typically two main methods:
- Industry models. You can apply pre-built taxonomy models and a lot of text analysis software offers both industry and horizontal models based on their experience with other clients with similar use cases). This is a good way to start the topic modeling exercise, however, it’s important you don’t rely solely on the pre-built model. Companies within the same industries have many different ways or nuances of doing business and their customers will use totally different terminology to refer to the products, services, or promotions which could be very unique in each case. It’s important too that you’re able to check the recall on the model, in case this is a standard approach for a text analysis vendor.
- Manual queries based on domain experience. This is very similar to the manual approach suggested in bottom-up modeling, except that it’s more prescriptive in nature and is based on the experience and bias of the user building the model. Examples include duplicating topics from a historical taxonomy model, or an experienced business user dictating the topics they know their customers refer to.
Our best-practice approach to modeling topics for text analysis
We’ve looked at the pros and cons of each approach, and when it comes to your own modeling for text analytics purposes, we’d recommend a combination of them to be most effective.
Whether it’s customer experience or employee feedback data, the following steps could give you the best topic model in an efficient way.
Step 1: Top Down with a pre-built model
Say your team has 100k verbatims from a particular customer touchpoint and you need to provide an analysis on all the topics in the data. The fastest way to apply a model and get a head start is by using a pre-built model. This could be done in 2 ways:
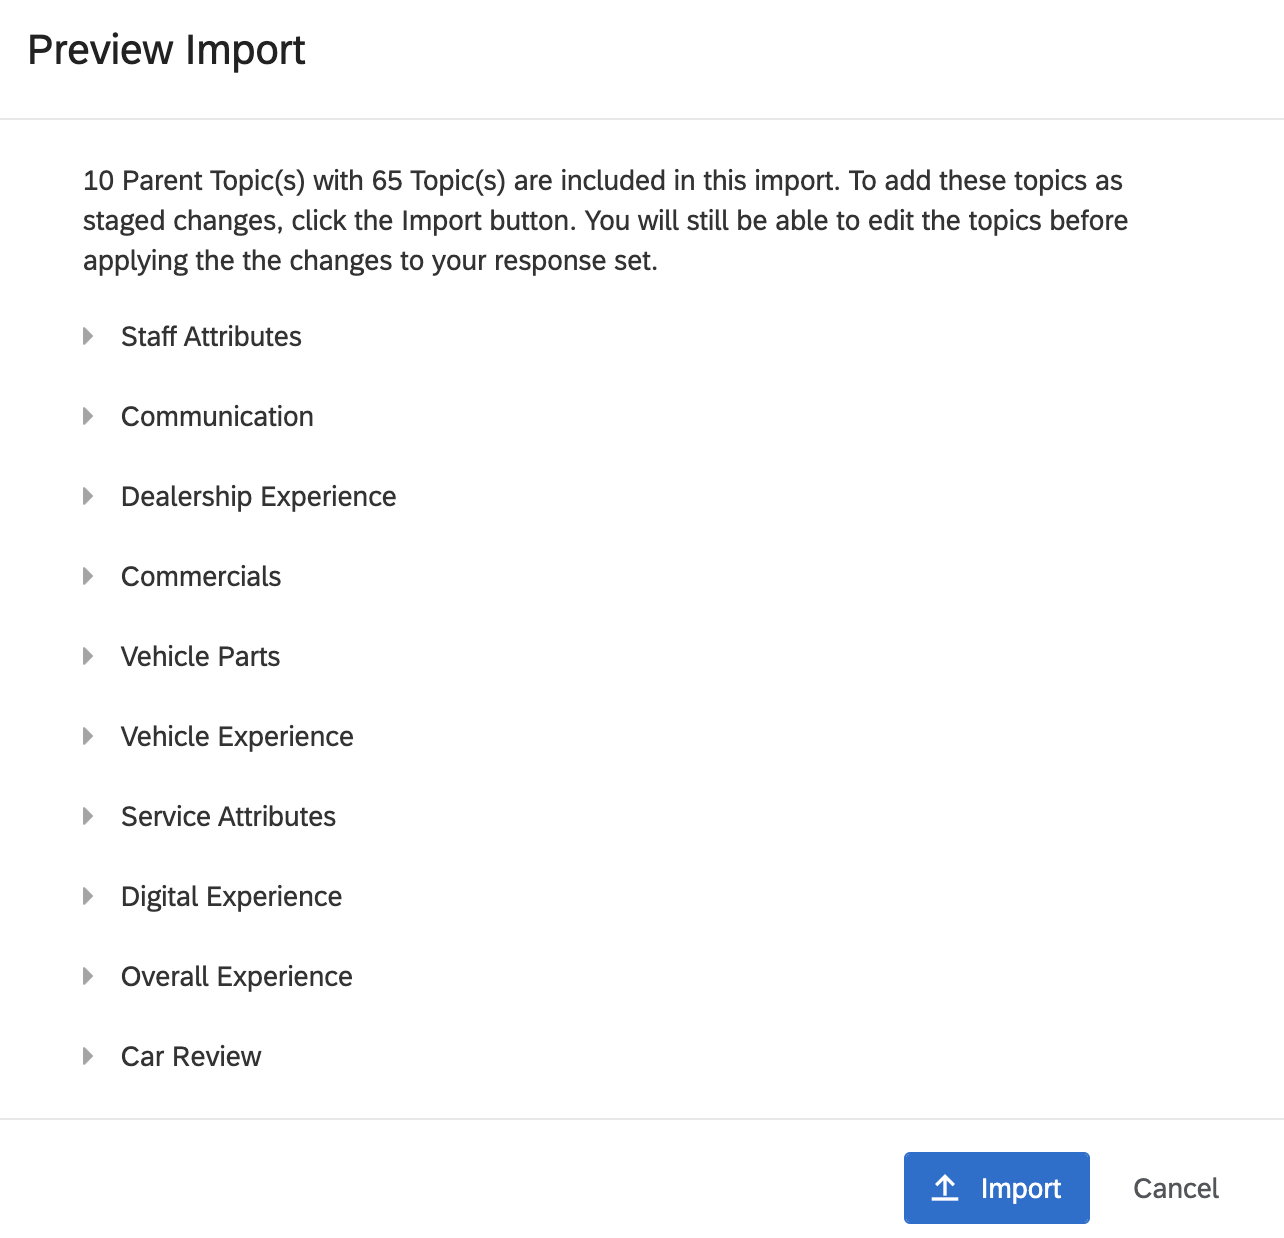
- Industry Models – The text analysis software should be able to give you options of using pre-built horizontal/vertical models to select from within your project area.
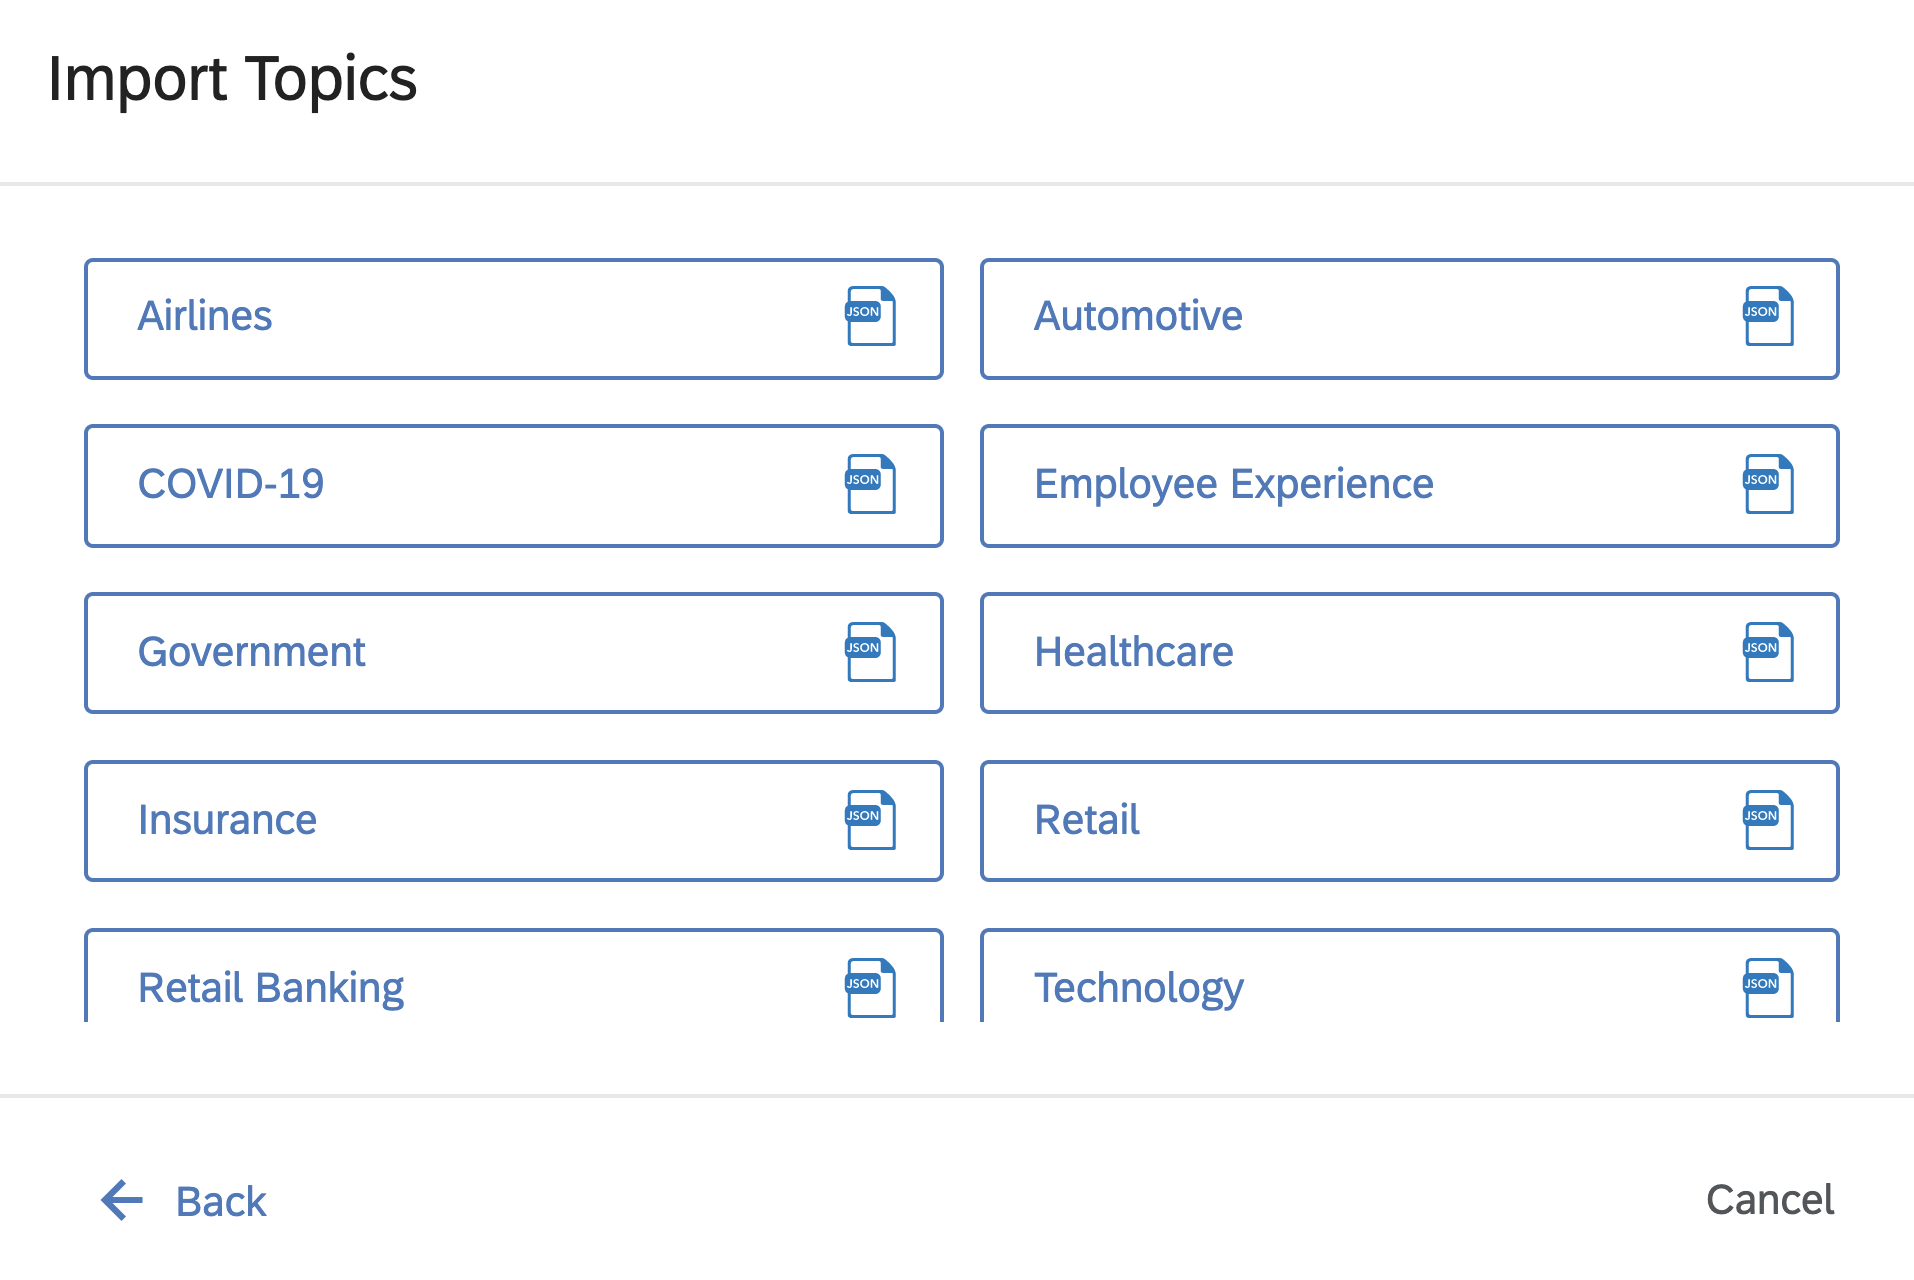
- Pre-configured models – Using a model that had been configured for a similar use-case somewhere else in the organization historically. This is extremely important that the text software provides the capability to use models from other projects. Which could even be a simple export of a pre-configured model from one project into an exportable file, and then importing the file in the new project where the analysis needs to be done. Don’t worry too much about the precision of the topics at this stage.
Step 2: Bottom Up – Automatic Topic Detection
Most text analysis software should be able to detect themes on the dataset or automatically pick up topics from the dataset based on whatever learning or clustering ability it uses.
While you should never fully rely on the automatic topic recommendations, they are a useful second step to bolster the model you’ve used in step one. Once you’ve got your recommendations, it’s very important to go through the automatically generated topics and add the ones that seem interesting, to the existing model.
Step 3: Enhance Precision
The Pre-built model plus the auto-generated topics now need a precision tweak. Go through each topic to check if it’s capturing/tagging the right responses. For the first pass, we would advise checking at least 15 to 20 verbatim responses per topic to get a good level of precision.
It’s imperative here that whatever text analysis software you’re using provides an easy user interface that allows you to:
- Easily select the topics and check the recall on each one
- Check the rules for each topic
- Check the verbatims each topic is part of speech tagging
- Make changes to the rules and check the changes the edit has made to the count of verbatim tagged
Step 4: Increase the Recall.
The final, and arguably most important, step is to increase the recall on the model and make it more effective by manually tweaking it to increase the total percentage of comments that have at least one topic association.
There are two approaches here:
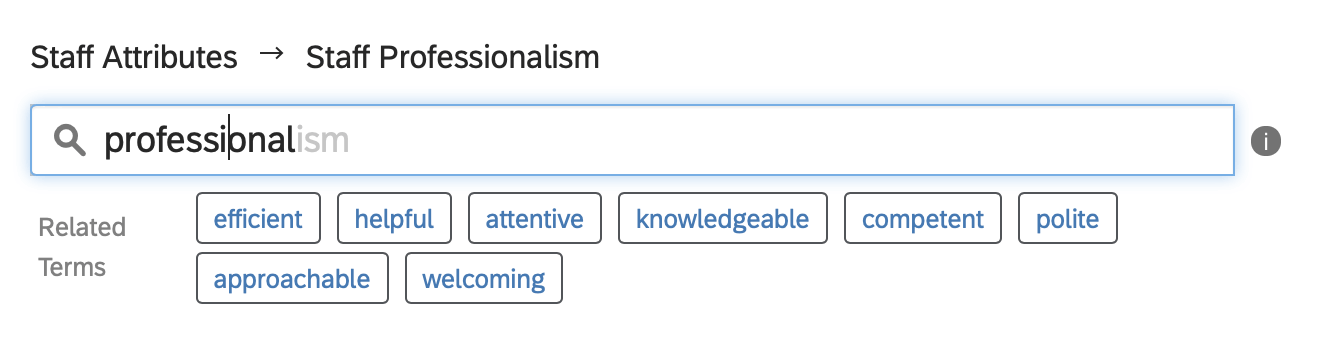
1. Improve existing topics — the existing topics in the model may need to include more similar words or synonyms to increase the frequency/count or verbatim for that topic. To do that, you need to include more words in your existing topic rules — this process could involve significant manual reading and be very time-consuming. Machine learning can help in this process by providing suggestions of word mentions similar to the ones already used in the topic, hugely expediting the process if the software you’re using has it available.
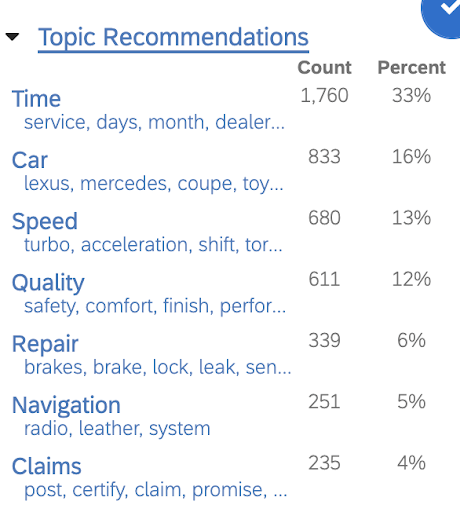
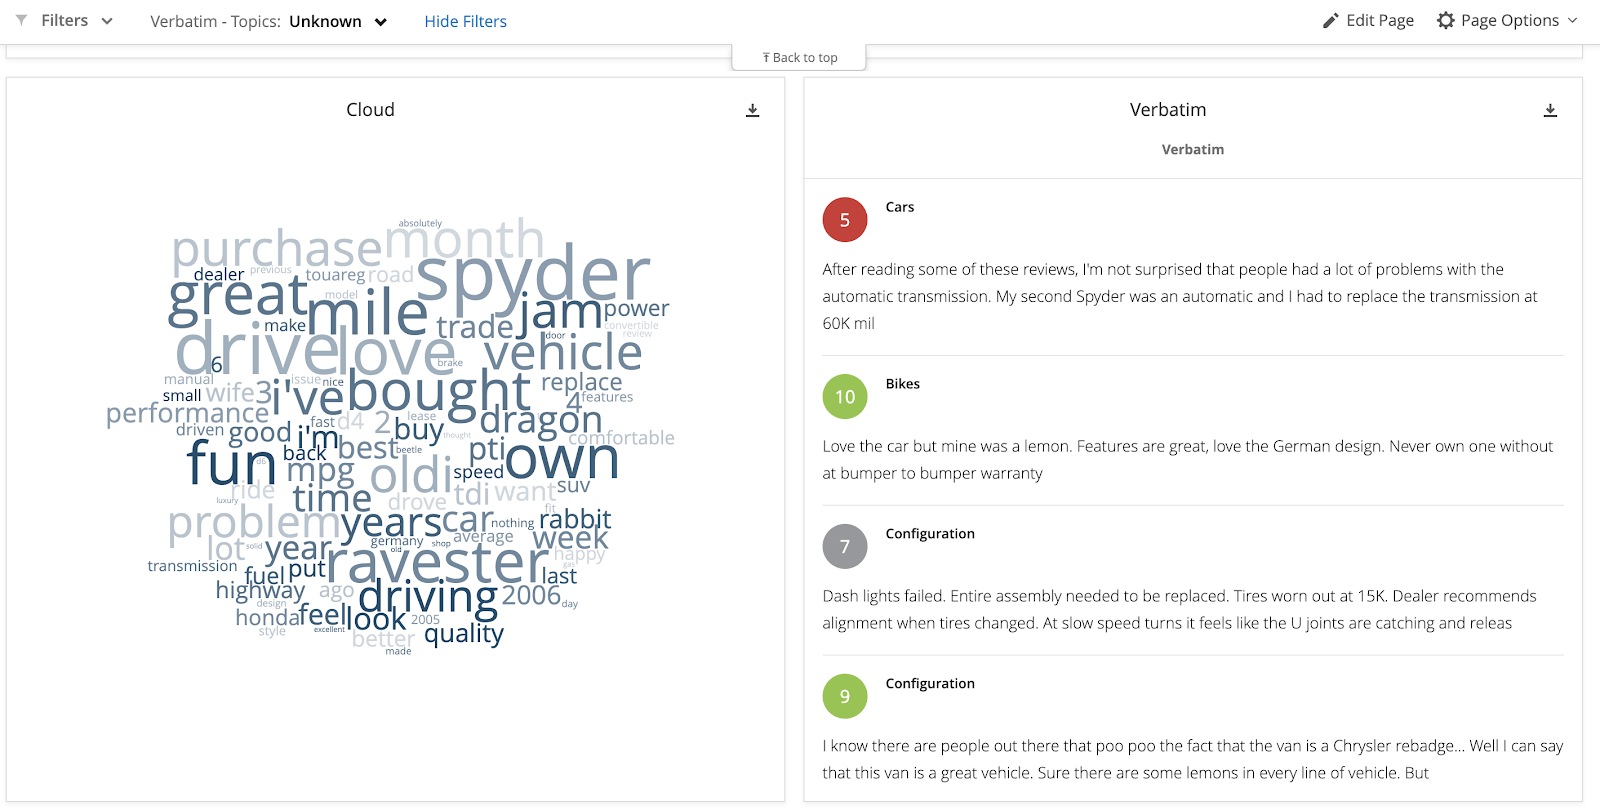
2. Create more topics to capture verbatims from the Untagged/Unknown Bucket — a true bottom-up approach will start from the verbatims and use them to build the model. But who will read 10,000 individual pieces of feedback? Instead, use techniques like lemmatized word cloud reports. These clearly show the most frequently mentioned words in the dataset and, when the report is filtered for the ‘unknown’ bucket, you can see the most mentioned words in that section. This gives you an easy view of which of the words the model has left out, so you can identify which should be assigned to different topics, or indeed if a new topic needs creating.
Accuracy in text analysis
In order to make decisions and take actions based on data, you need to have confidence in that structured or unstructured data. As such, many people obsess over the accuracy of their text analytics.
It does indeed matter, but there are many instances where accuracy can be a red herring, particularly in VOC and other XM programs where signals from text analysis are vital, regardless of their accuracy.
How is text analysis accuracy measured?
When talking about accuracy, it’s important to remember that it will depend on a wide variety of factors, including:
- the source of text data (eg. Tweets, Product reviews, chat transcripts, etc.)
- the complexity of the language in the industry you’re in
- regional and cultural influences, for example, introducing concepts like sarcasm
- the length & complexity of the sentences used by respondents
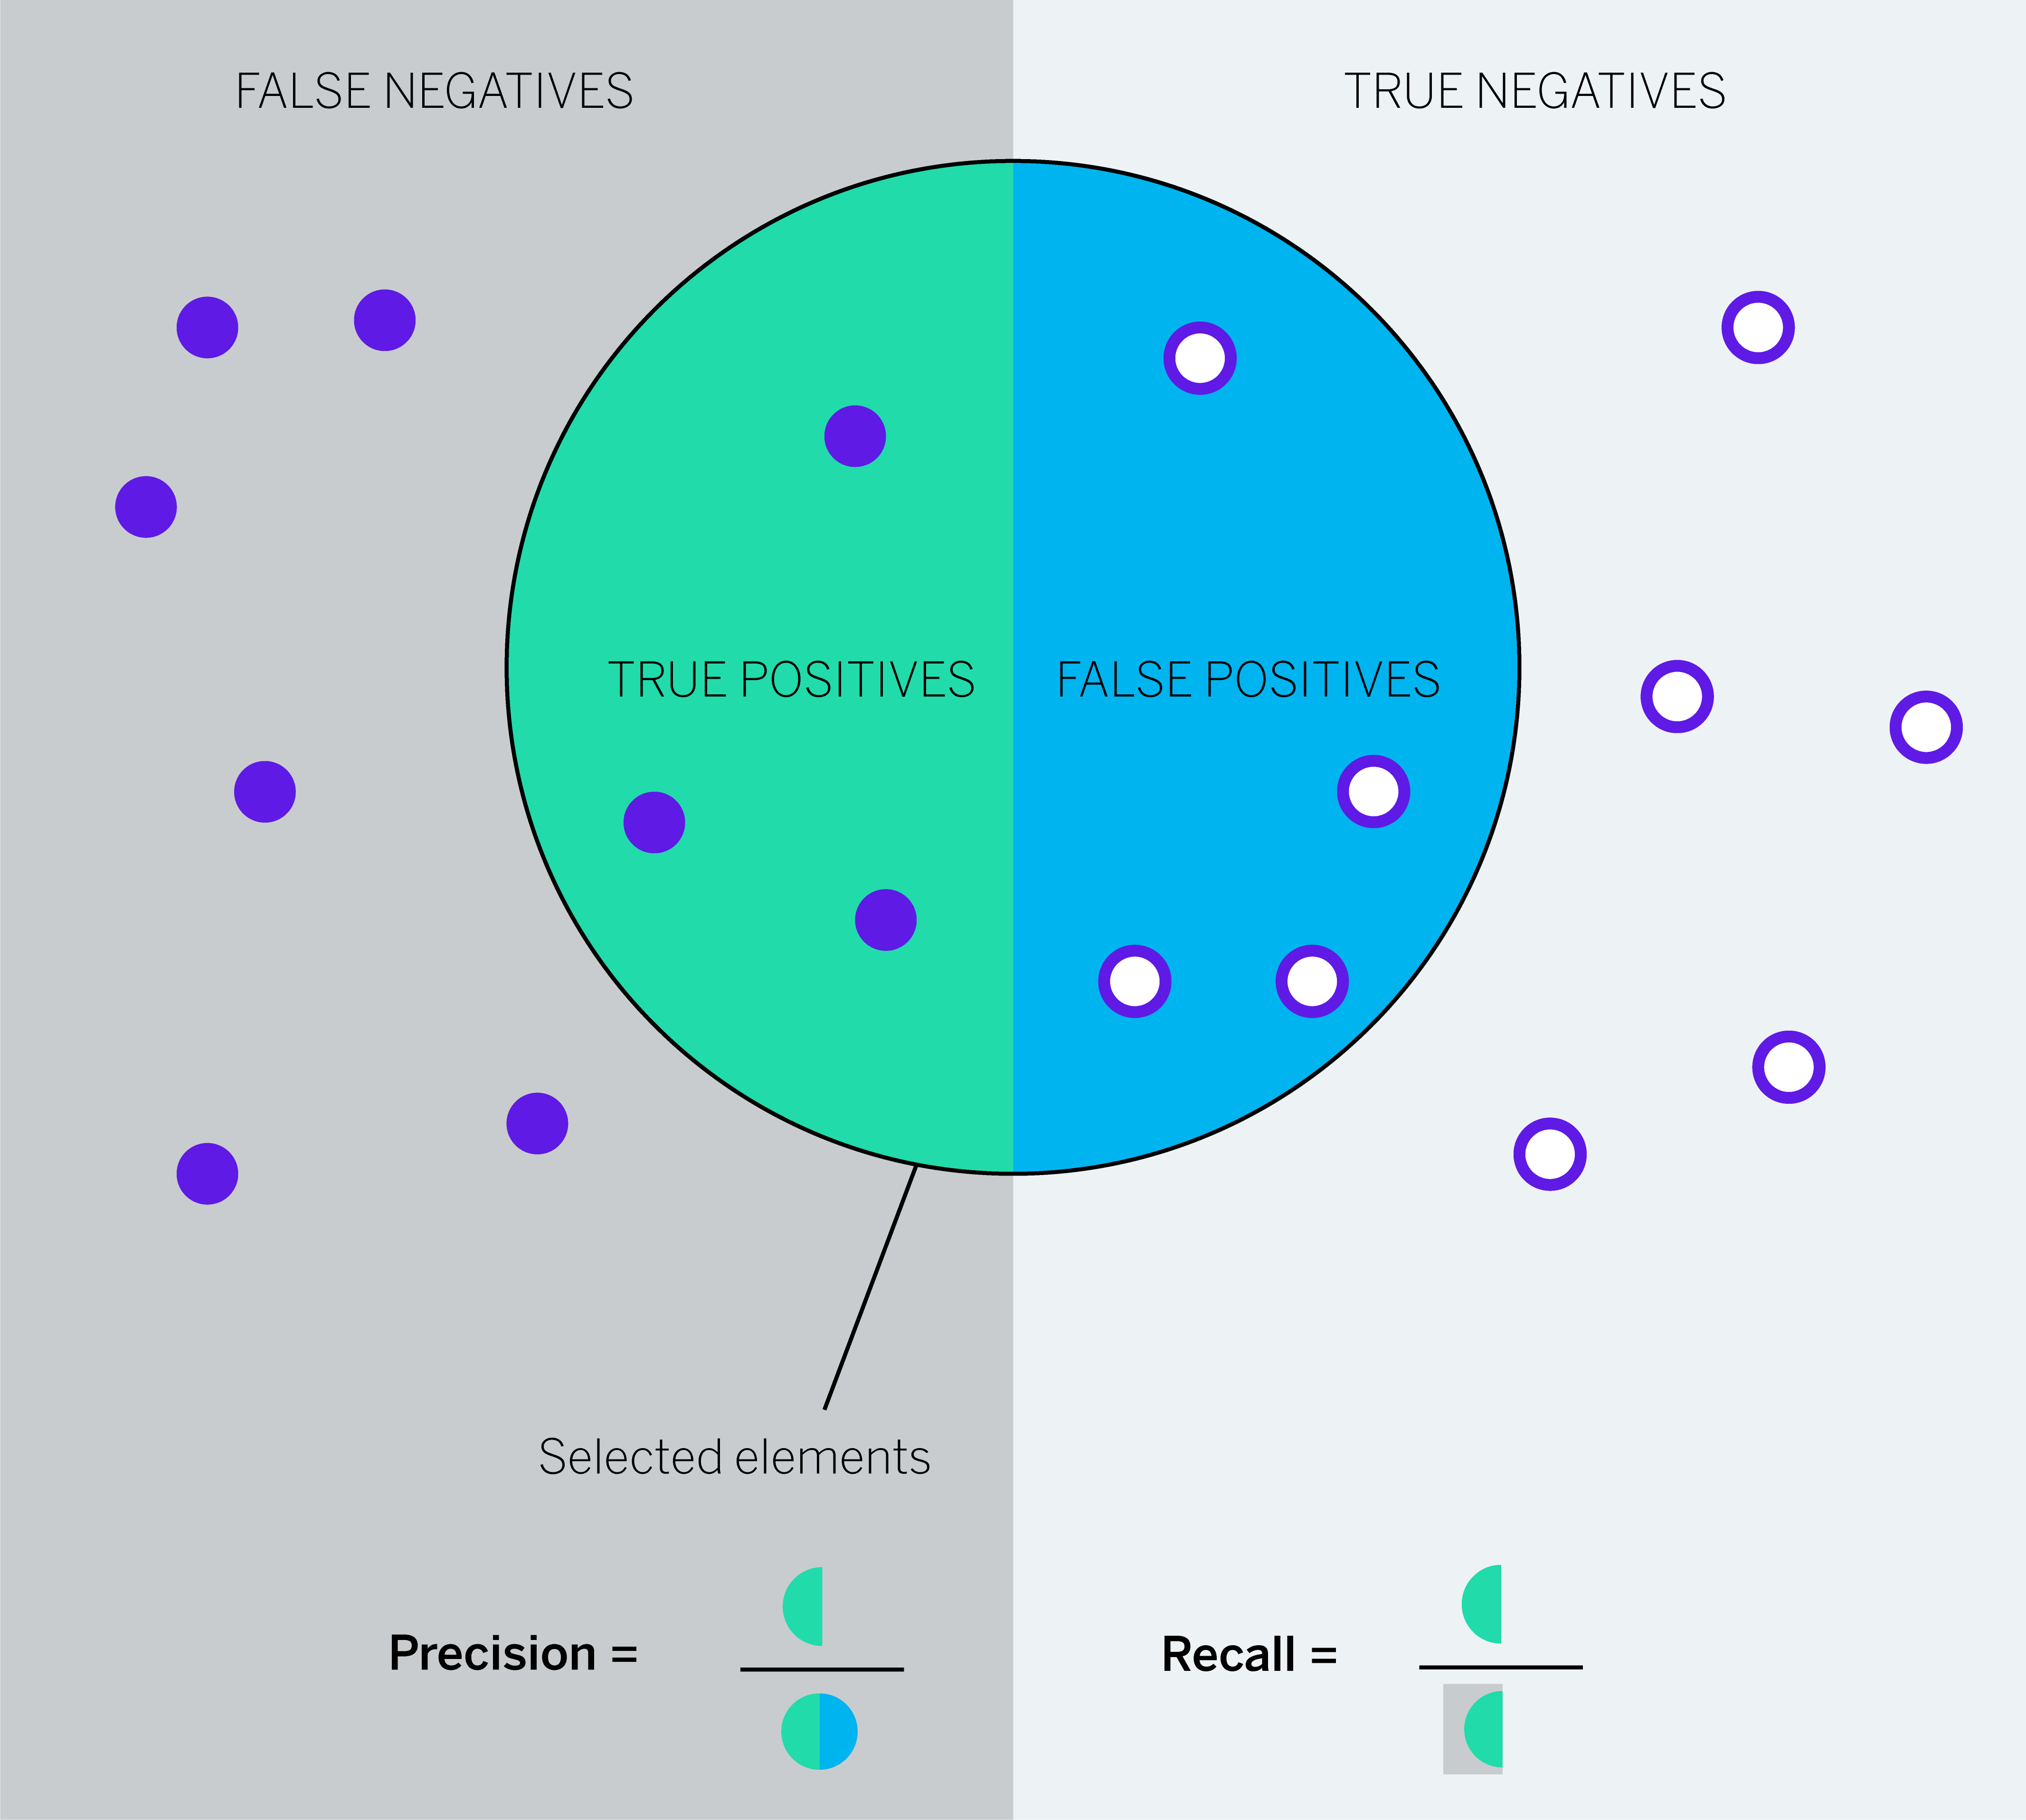
Accuracy in text analysis is usually measured using two concepts – recall and precision.
- Recall is the number of correct results divided by the number of results that should have been returned. 80% recall means that 20% of your data has not been captured by the analysis at all, and has not been tagged in any category or topic.
- Precision is the number of correct results divided by the number of all returned results. 80% precision means that 20% of your data has been incorrectly included in the model.
In Customer Experience and Voice of the Customer programs, recall and coverage are usually measured as the percentage of records that are actually tagged under at least 1 topic in the taxonomy model.
For example, in a customer feedback data set of 100 verbatims for a Telecom provider, we know 70 verbatims refer to the various Tariff Plans available for the customers.
The text analysis model pulls 50 verbatims as relevant for ‘Tariff Plans’.
And of those 50, only 45 correctly contain mentions of ‘Tariff Plans’.
In this example:
True Positives: 45
False Positives: 50 – 45 = 5
False Negatives: 70 – 45 = 25
True Negatives: 30 – 5 = 25
Recall = TP/ (TP+FN) = 45/70 or 64%
Precision = TP / (TP+FP) = 45/50 or 90%
To combine the 2 under 1 score, the statisticians use the F Score. The F1 score is the harmonic mean of precision and recall taking both metrics into account.
F1=2 * Precision*Recall/
Precision + Recall
How accurate does your text analysis need to be?
Now that we understand the concept of accuracy, it’s also useful to understand the dangers of being pedantic about accuracy in text analysis, particularly when it comes to experience management programs like voice of the customer.
There are three main challenges with accuracy calculations:
1. Large datasets present a challenge
Accuracy is a statistical concept and can be very difficult to ascertain in big datasets, say for example where you are applying text analysis techniques to millions of customer feedback records.
2. It takes a lot of legwork
Understanding accuracy relies on sophisticated methods and calculations, and some even use probabilistic calculations to get there. In order to use True Positives and False Negatives to understand your accuracy score, you need up-to-date information about what’s correct, and what’s not. This can only be done by manually tagging the data, and can become a very cumbersome process, even when the analysis itself is done via machine learning.
3. It’s impractical with multiple topics
To understand accuracy, most people look at the recall of the taxonomy or the topic model. For example, if you have 10,000 pieces of verbatim feedback, and your multi-tier (taxonomical/hierarchical) topic model covers tags 8,500 of those as containing at least one of the topics in the model, then we would consider the recall is 85%.
However, the recall calculation in our example above (Tariff Plan) is actually done for just one topic. But what if our telco had 30 topics? The true recall model would be to see the recall of each & every topic or category node within the model – and this is where it runs into difficulty.
Say a piece of text feedback that says “Pay as You Go plan is great but the staff was unhelpful”, was actually tagged under the topic ‘Staff Helpfulness’ topic but not under ‘Tariff Plan’, by the Topic Model level recall calculation, the recall will be 100%. However, if you do the same analysis at the level of Tariff Plan, the Recall is 0.
Accuracy of sentiment analysis in text analytics
We’ve looked at some of the challenges of accuracy in topic analysis, but there are challenges in sentiment analysis too:
Irony & sarcasm
When people express negative emotions using positive words, it becomes challenging for sentiment models. There are different ways to spot these using rule-based or learning-based methods. Rule-based methods however are limited for this approach as they can only catch as many that there are rules for. Learning-based models which use massive reference datasets are more likely to return better accuracy.
The great news, however, is that in a multi-channel Customer Experience program, generally, such instances would be far less than even 0.5% of your overall VOC data.
Negations
This refers to the use of ‘flippers’ or negator words like ‘not’, or ‘never’. Explicit negations like “staff was not polite” are easily picked up by rules-based or lexical/dictionary-based systems. Implicit ones like “it cost me an arm and a leg” require custom rules or learning-based sentiment models to capture them accurately.
Does accuracy matter in text analysis?
The short answer is yes. Being able to take actions and make decisions based on people’s feedback of course requires confidence in the data itself and in your text analysis.
However, as we’ve seen, considering accuracy as a statistical project can be difficult, and potentially limit the value you get from it.
There are instances where high recall is vital because action needs to be taken on just a few instances of feedback. Like a credit card company – just a couple of mentions of the word ‘fraud’ should be enough to trigger an action.
Or a digital team, where any spikes in mentions of ‘Broken Links’ or ‘Page Errors’ should be enough to take action and improve the experience.
There are occasions too where precision doesn’t matter. For example, in brand analysis competitor name mentions should be analyzed regardless of the sentiment.
Or, if you have customer feedback assigned to topics related to Injury, Lawsuits, Legal Proceedings, etc. these don’t need sentiment precision in order to raise a flag and trigger a deeper investigation.
Text analysis in multiple languages
A big part of taking action to improve the experience of customers and employees is the task of listening to the vast universe of unstructured feedback that exists in the form or customer survey responses, call center conversations, emails, social media, and many more channels.
Big global companies have the added challenge of having to systematically listen, analyze, and report on feedback in multiple languages. Indeed, some of the biggest companies need to do this across millions of verbatim responses in 20 or more different types of human language.
There are typically 2 ways to do it:
- Using native language analysis for each respective human language
- Translate all responses into a single ‘base language’ and analyze all content in that language
While there are pros and cons to each approach, the main thing is to balance accuracy and cost.
Weighing up accuracy and cost in text analysis
It’s widely accepted that native language analysis tends to offer greater accuracy. This is true given that translation may lose the linguistic nuances and return grammatically incorrect results.
However, there are a few points to keep in mind:
- translation engines are getting smarter every year with new technologies being added. For example, Google translate has become more accurate over the years with machine learning capabilities that account for linguistic nuances
- translation works pretty well on nouns, adjectives, and adverbs — these parts of speech are typically used most in topic building. The overall sentence structure might lose accuracy, but largely these parts of speech are translated well. And that is what is used in topic building and lexical sentiment tools. If the technology is not lexical, and uses a learning mechanism, then the sentiment results on the translated text can vary in accuracy.
Native language analysis can be costly too.
In most text analysis tools, the taxonomy is built/customized to reflect a consistent structure to capture verbatim feedback that will be used to measure and report on employees’ or customers’ experiences.
So it’s the taxonomy where all the resources have to be invested upfront to build, and then periodically maintain, for consistent accuracy.
The cost of building the topic model goes up exponentially for native language analysis. For example, if it takes 2 weeks to build a fully customized automotive model for the after-sale/service touchpoints in English, it will potentially take 4 weeks to do that in German as well.
This also assumes that the CX team is able to find the local users in each market, train them to use the technology/software & then have them build the local language models.
The cost doesn’t end in the build phase — as you add more touchpoints or surveys, the text models need to be refreshed, in all languages. Every 3 months you would need to audit and add or edit topics to maintain consistent accuracy levels, and you’d need to do this in all languages.
Organizations need to assess whether the incremental value of increasing the accuracy by using native language analysis is worth the extra cost of resources.
There are some other things to bear in mind for native language analysis, too:
Availability of native language capabilities. Language analysis capabilities need to exist for each language in question.
And while it’s easy to find native language analysis capabilities for languages like German, French, Spanish, etc. it’s more difficult to find those capabilities when it comes to Nordic or Baltic languages for example. Some of the biggest text analysis engines in the world only analyze limited languages in their native form for this reason.
- You can always report in all local languages. Text analysis has three different phases — Build, Analyse & Report. You can do model building in any language, but then for reporting to various different countries in role-based dashboards, the reports can always be presented in the local language. So the local users should still be able to read the reports & the analysis in their local language.
- Consistency is key for measurement — irrespective of whether a technology supports 35 languages, the ultimate aim should always be to have consistency in modeling and reporting; and efficiency in building and maintaining a taxonomy model whether that’s through native language analysis, or using a ‘base language’ approach.
- Sentiment analysis is impacted more by translation than topic analysis. Therefore it’s preferable to have the sentiment scoring done in the native language as opposed to the translated language. This should not mean spending any resources, as most of the text analysis solutions use pre-built sentiment analysis techniques which usually do not require any labor-intensive model building work in a CX scenario.
What is best practice for text analysis in multiple languages?
Ideally, model building should be done in no more than 2 base languages keeping in mind the team size, the geographical spread, the linguistic abilities of the insights teams, and the cost/effort to build and maintain multiple language models.
The most effective approach involves four key steps:
- Choose a technology that can seamlessly and automatically translate multi-language verbatims into one or two base languages.
- Build a topic model in the translated language using a combination of bottom-up & top-down approaches. The technology should make it easy to build this using a combination of automatic plus manual methods of categorization.
- The technology must be able to provide sentiment scoring in the native language as that is more accurate
- For reporting purposes, the text model or category labels contained in the base model should be easily translated to the native language at the reporting layer, so that native language users can easily see the reports in their own language along with the original native language verbatim.
Essential tools for text analysis software
Throughout this guide, we’ve looked at the various methods behind text analysis and the complexities of building models and hierarchies and running text analysis in multiple languages.
Running all of this yourself is a big ask — and one very few organizations will be set up to do.
Thankfully, there are plenty of text analysis tools available to help you draw insights out of open text. Here’s what you need to look out for in a text analysis tool for your organization:
Collection
Multi-Channel – solicited and unsolicited collection of text data is absolutely essential for an enterprise CX program. If you’re only analyzing survey data, then you’re missing out on a lot of actionable insights in sources such as Social media, Call center interactions, Online Chat, etc.
The best text analysis tools can analyze data from multiple sources rather than being limited to just one or two. This helps you to see the complete picture of what customers or employees are saying, wherever they’re saying it, so you can build up a better picture of the experience and therefore take the right actions to improve it.
Data analysis
Statistical + Text Analysis – Must have the ability to run regression analysis on the Text Topics & Sentiment, to determine the actual impact on the CX KPI score. Whether the Staff Attitude has more impact on my NPS or the Product Quality, it’s very important to understand the correlation and regression of structured scores with text information.
Action taking
Text analysis may not just be used for aggregate root cause analysis & driving improvements from the back office. It must be able to enhance real-time close the loop for dissatisfied customers based on their open-ended comments. Close the loop must not be confined to conditions based on scores given by the customer but should be able to get triggered based on the topic or sentiment definitions from the comments.
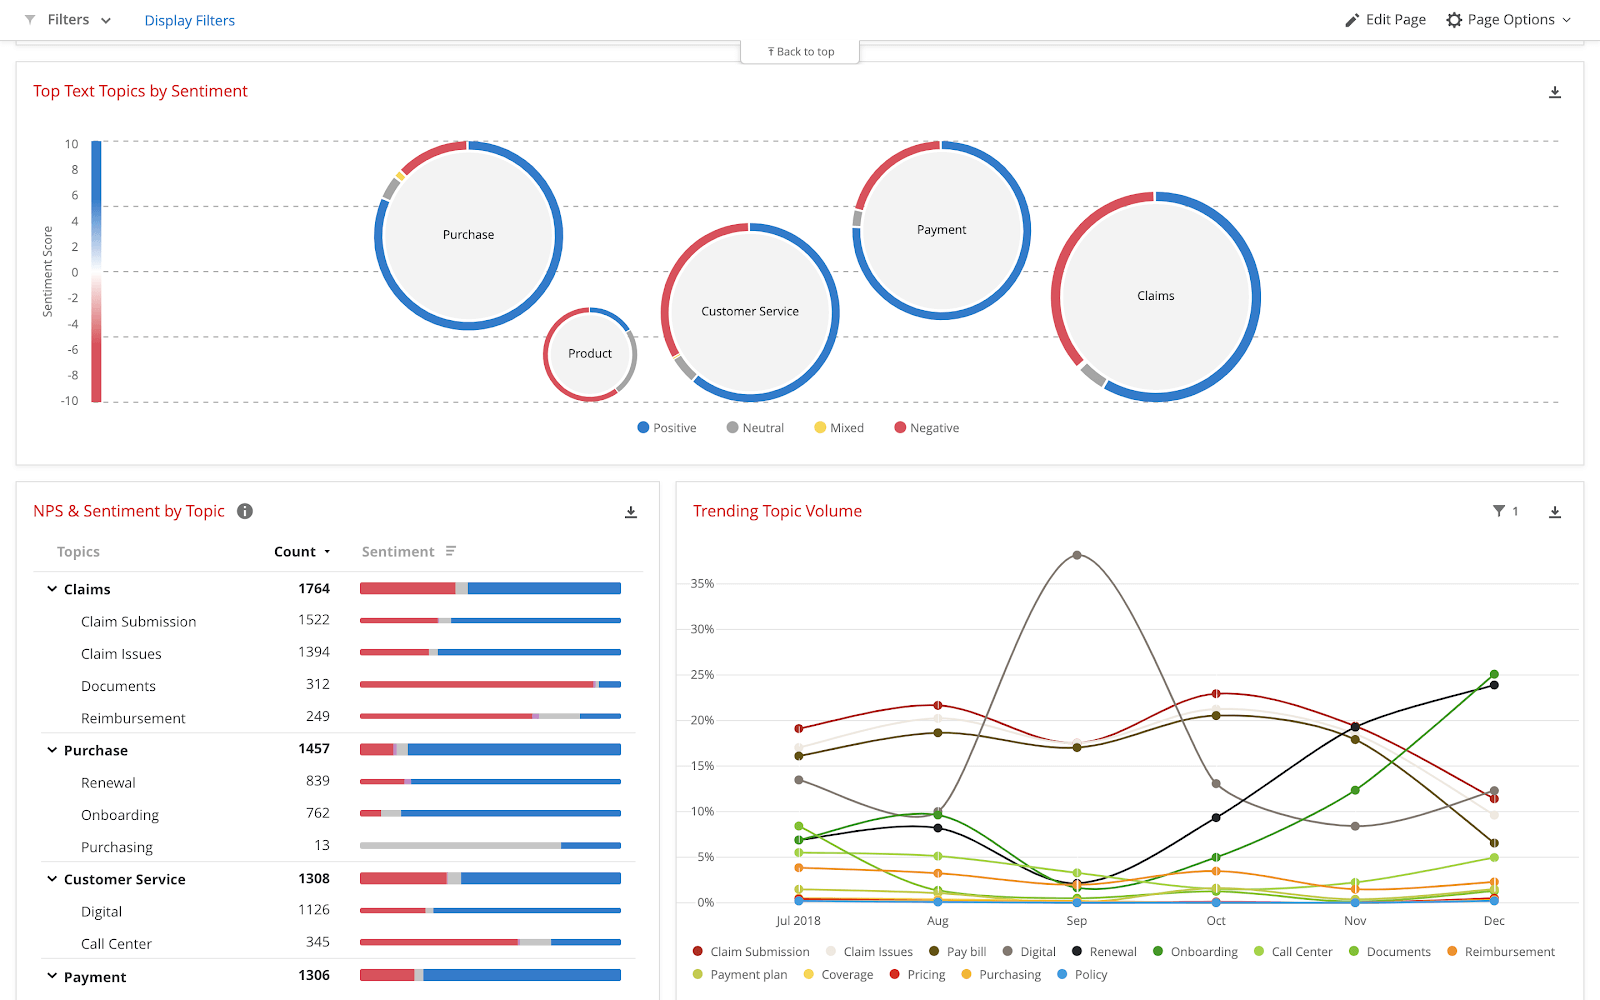
Data visualization
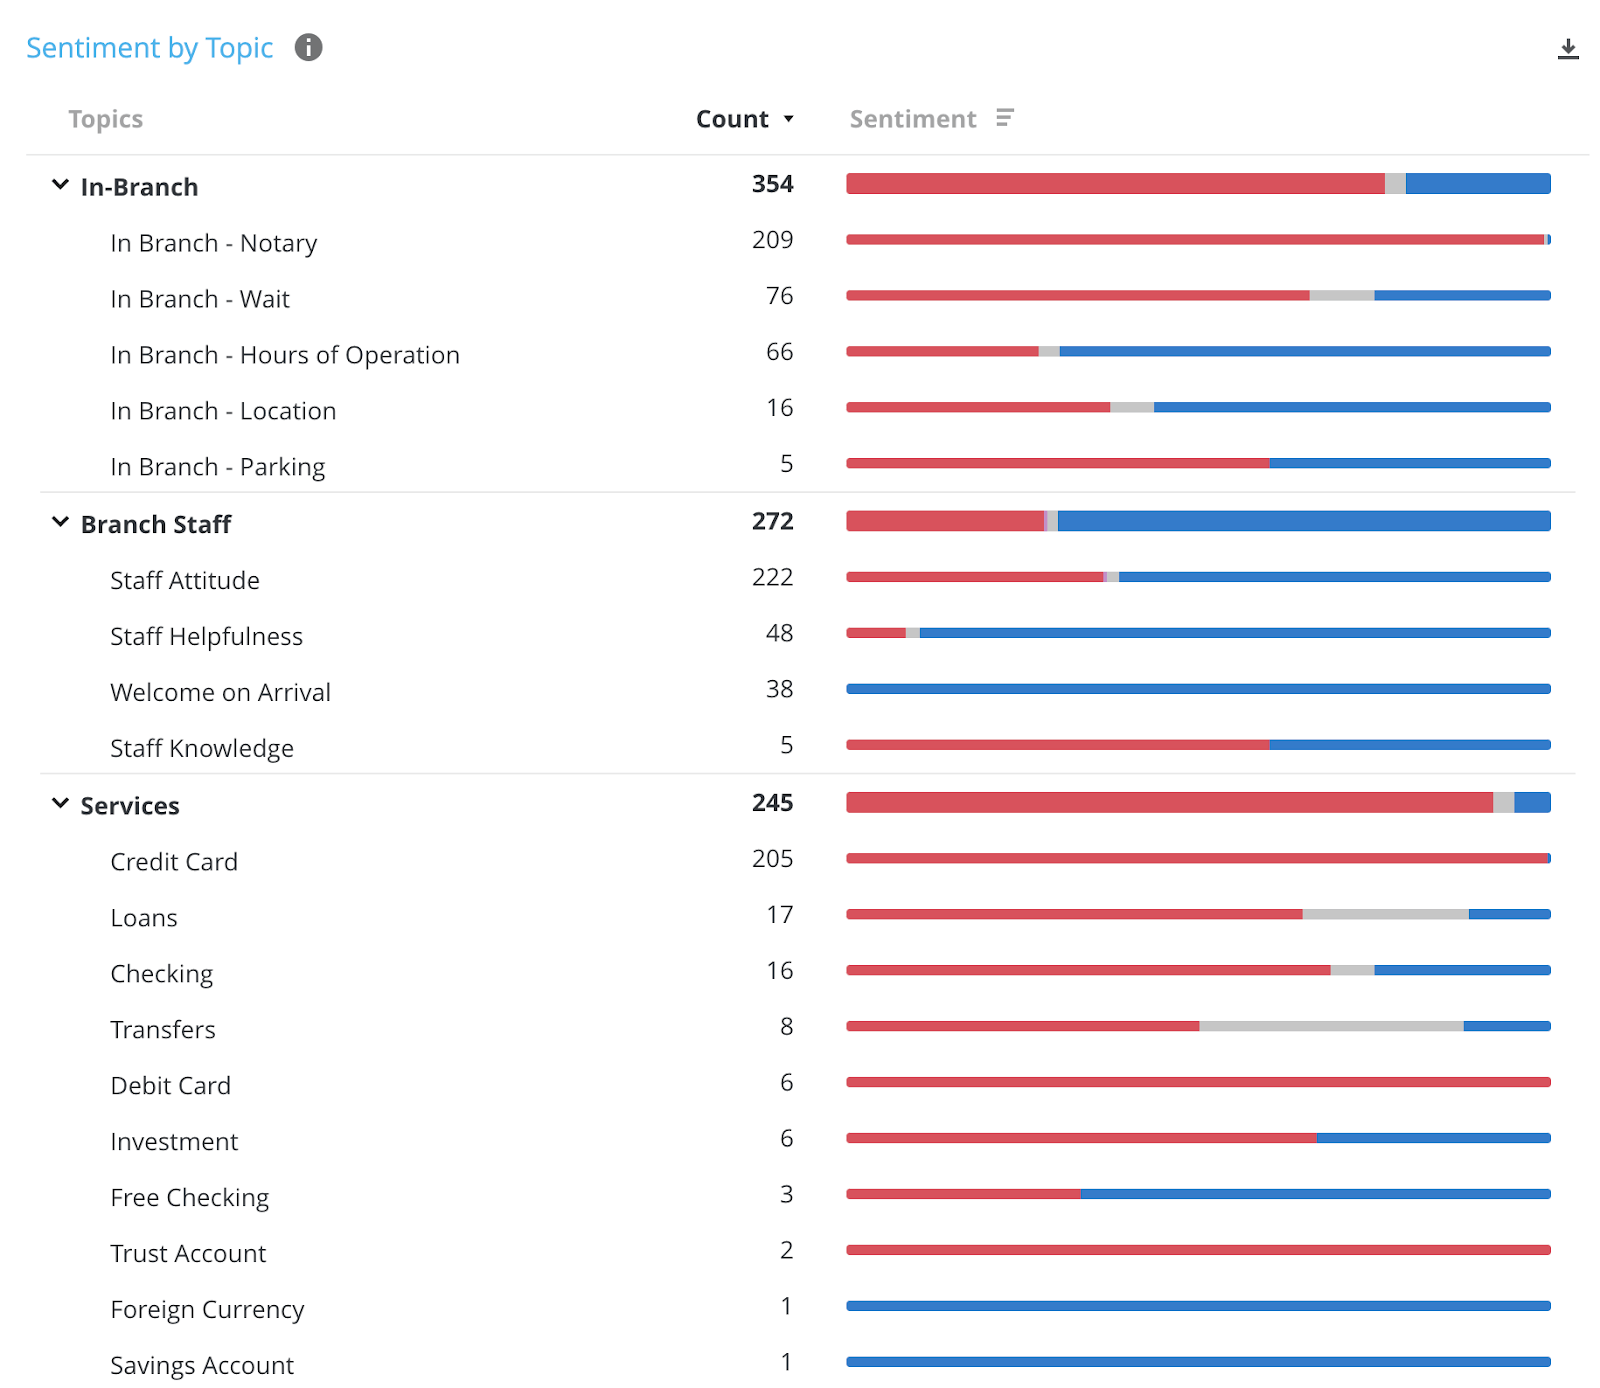
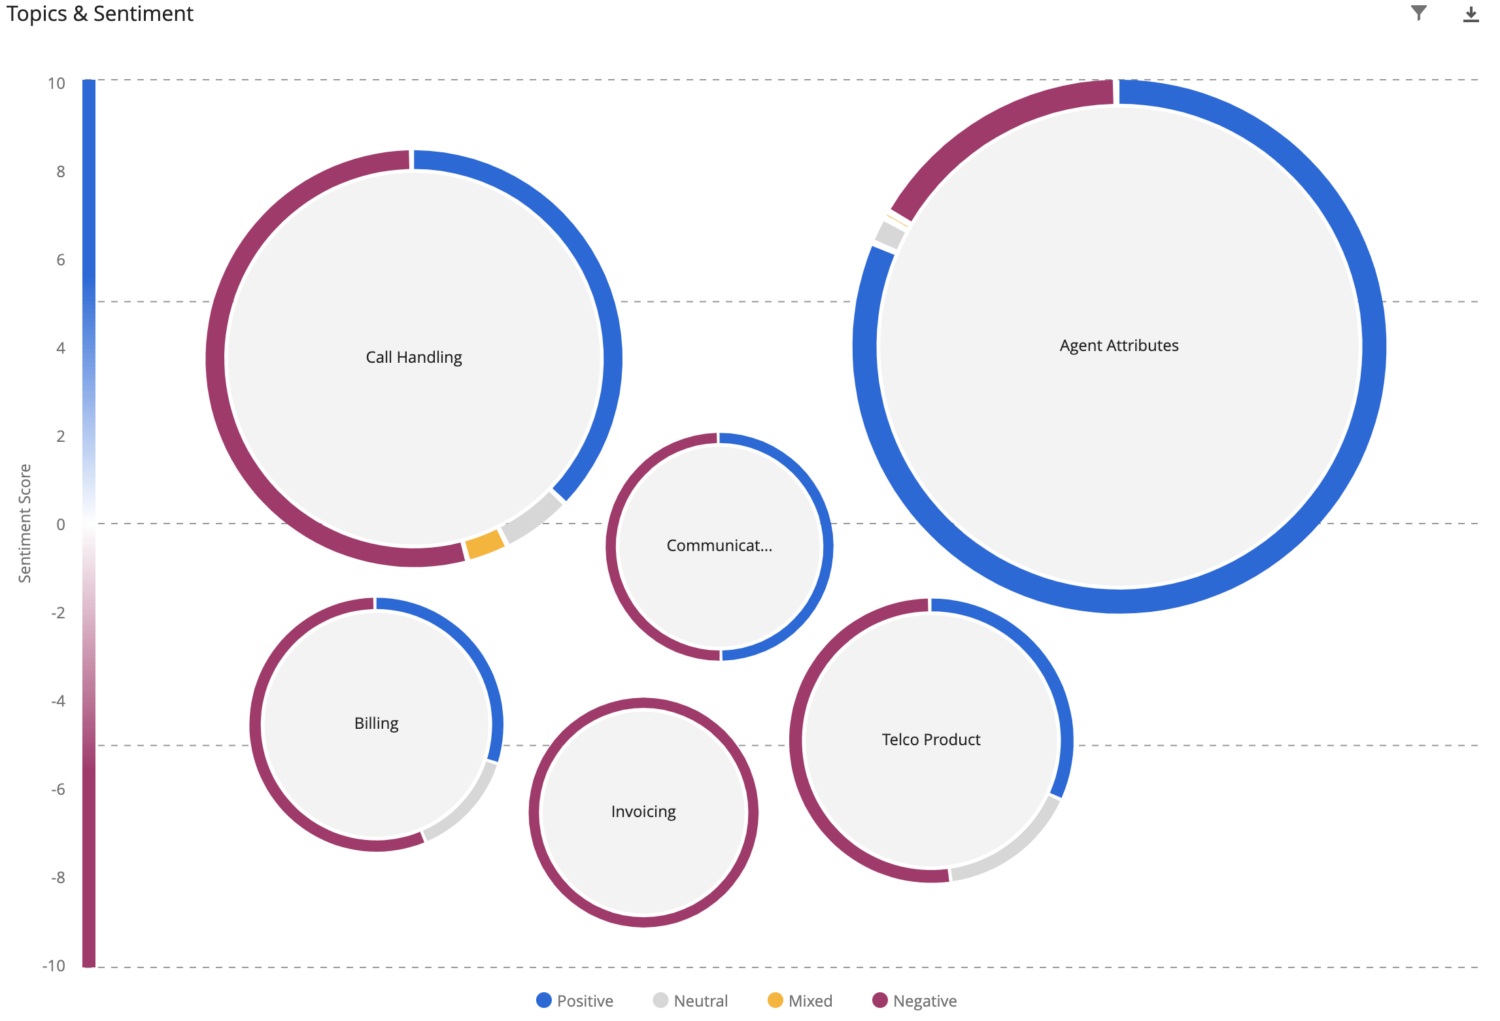
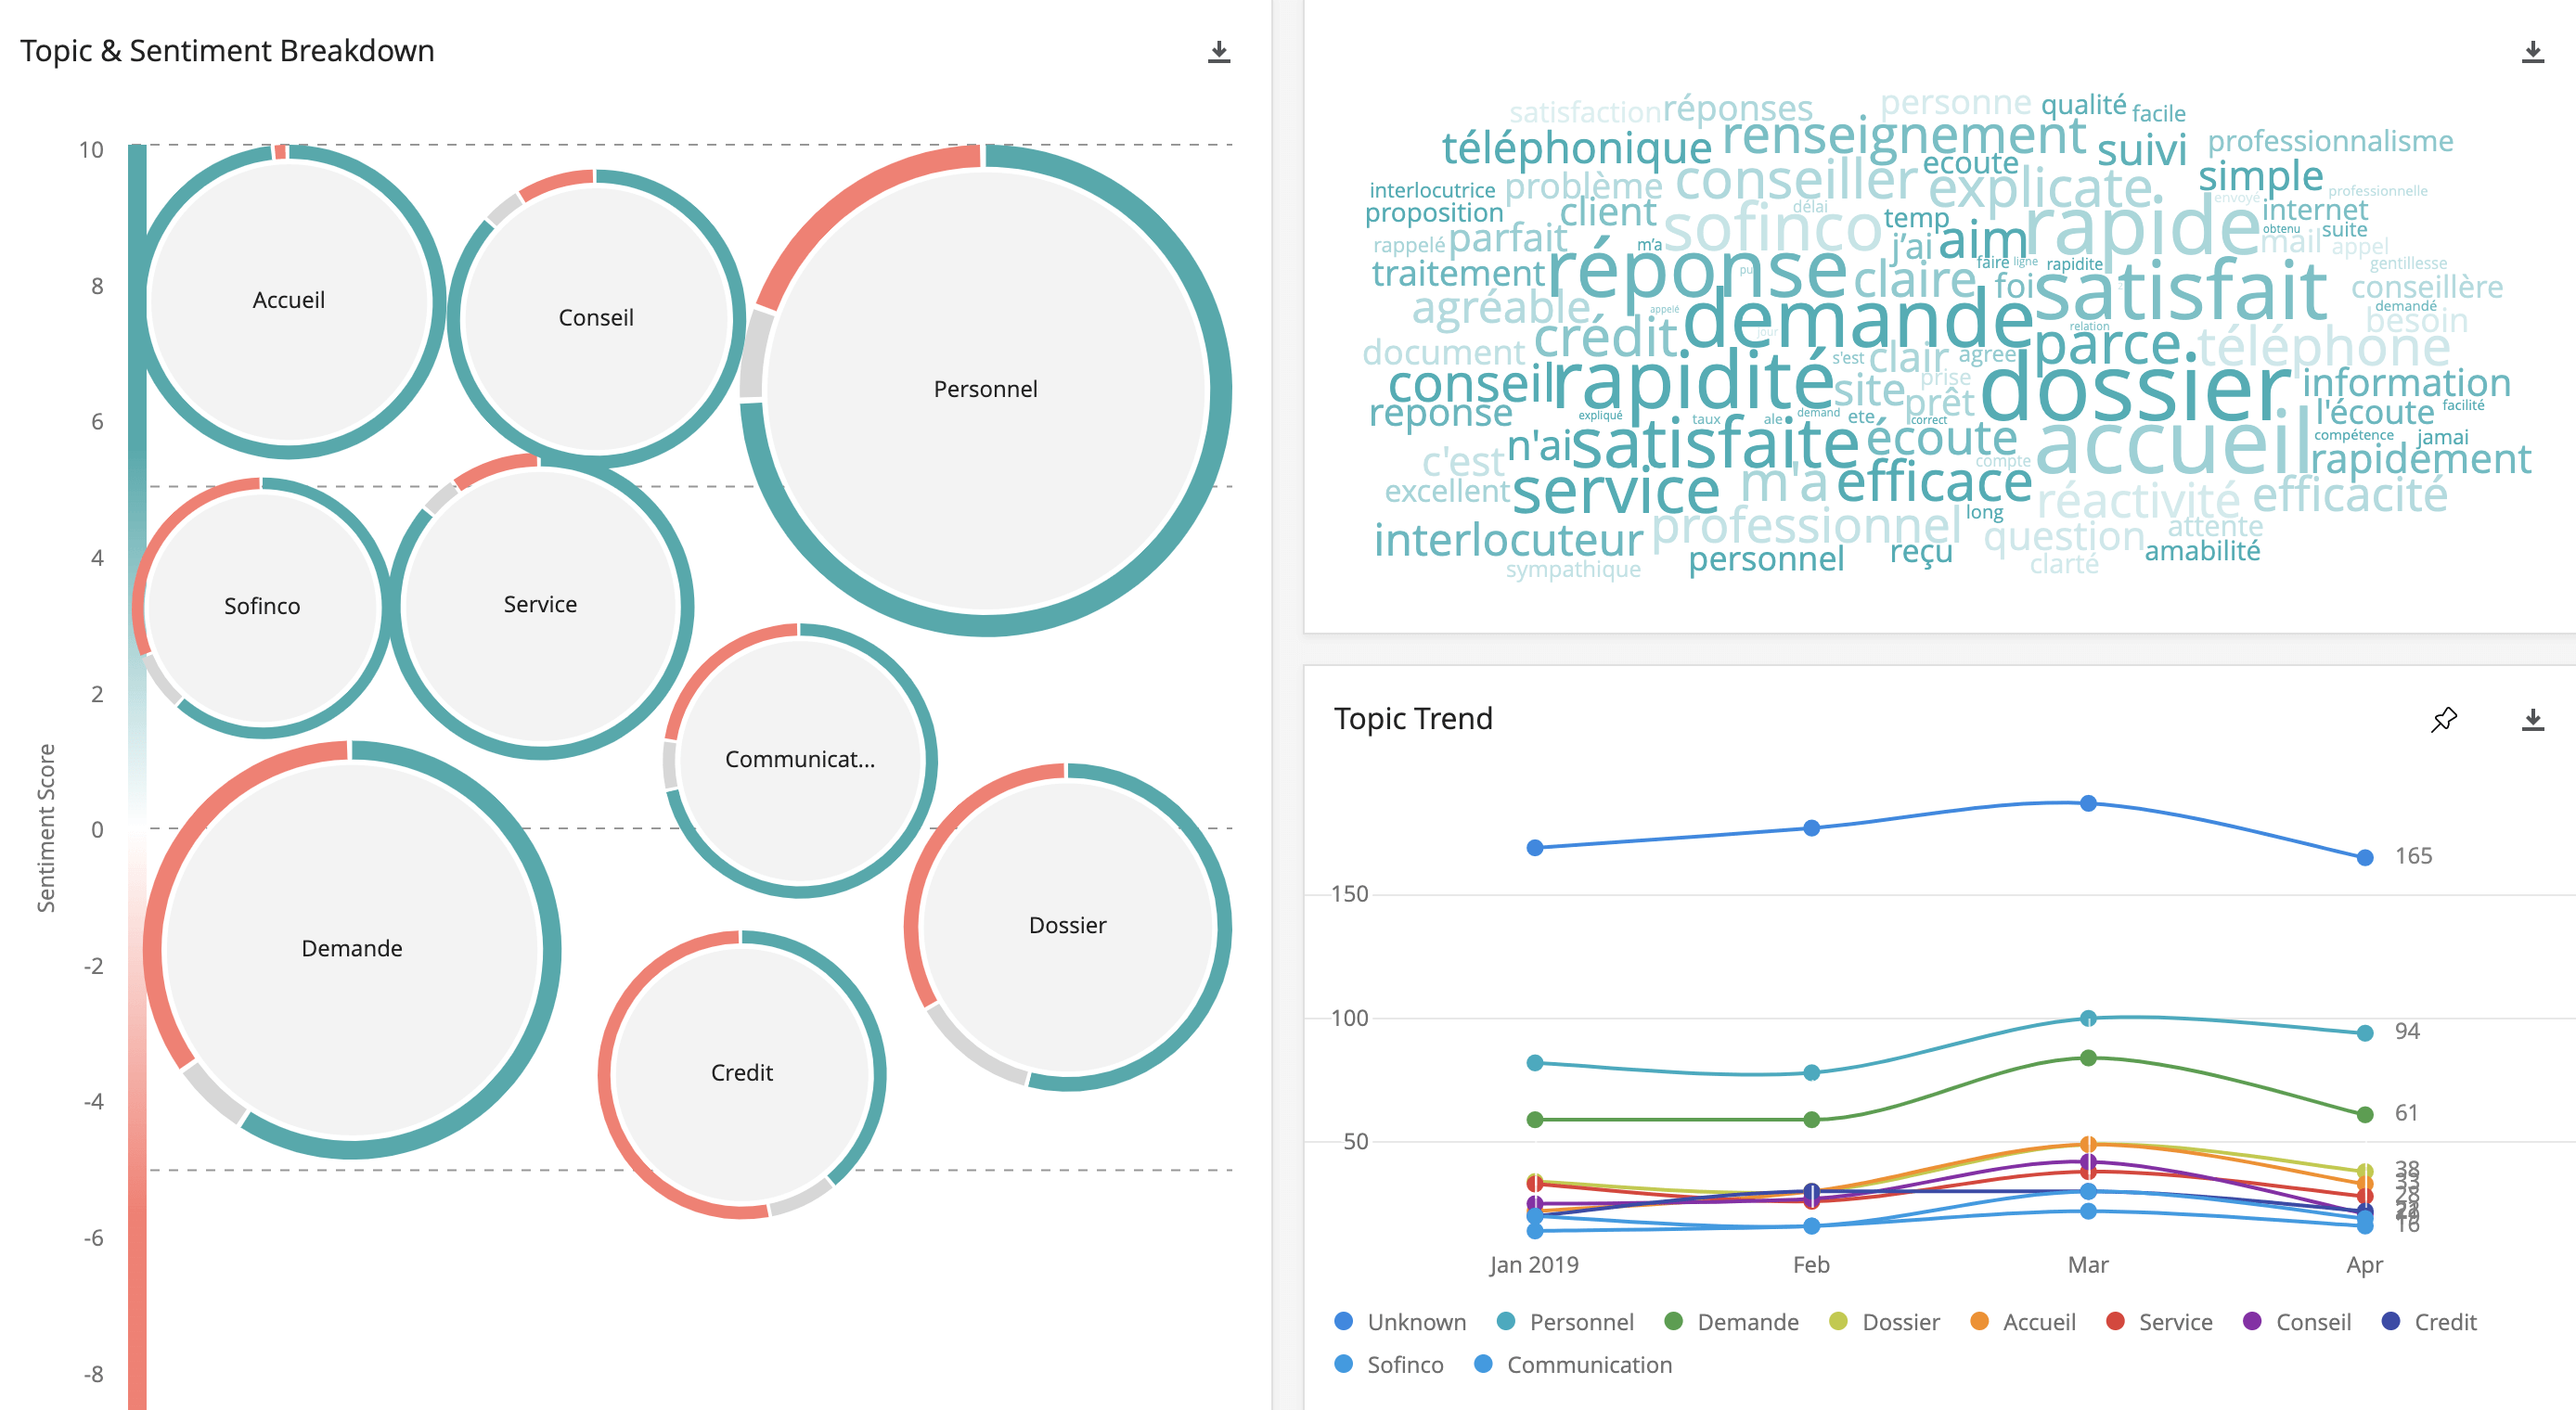
Flexibility in Visualisations – Text analysis is more than just colored word clouds or topic bubbles. Giving endless flexibility in visualizing text analysis information with Structured Data (like Segments, Regions, NPS, Effort Score, etc) and Operational Data (like Call Volumes, Handling Time, Customer Lifetime Value, etc), enables ease & speed of insights discovery & action prioritization. The most useful ones are Hierarchical Topic & Sentiment Bar chart, Stacked Bars with Topic & Operational Data, Loyalty Group Bars with Sentiment line, etc.
Easy-to-understand — make sure the visualizations are easy to interpret for everyone in the organization. Typically you should be able to see at a glance trending topics, a breakdown of sentiment, plus changes over time
Drill-down into comments — knowing the trends in topics and sentiment are the start, but you’ll also want to be able to drill down into reports through to individual responses. Of course, you’re not going to read every comment in full, but it’s useful to dig deeper to see what people are actually saying in dipping trends or low NPS segments. And also to sense check that your topic model is working well.
Ecosystem + integrations
One platform — for any experience management program, it’s better that your quantitative and text data are collected and analyzed on the same platform. This saves hours of manual effort bringing different data sets and technologies together to get the complete picture
Integrations — if you’re running a closed-loop customer experience program, make sure your text analytics tool is integrated into your existing systems like your ticketing application. This means that, based on sentiment and topic, relevant customer comments can automatically trigger a follow-up in the systems your teams are using already, making it faster to follow up and ensuring people have the right information to close the loop effectively with a customer.
X + O data together — the ultimate goal of any experience management program is to drive value back to the business. So look for a platform that brings together experience data (X-data) like text, alongside operational data (O-data) like sales figures, or HR data. This helps you to make connections between what people are saying, and their behavior – for example, do people who talk about helpful staff in-store spend more than those who don’t. That way, the actions you take based on the insights you gather from text analysis will be geared towards delivering ROI and growing the business.
How Qualtrics can help
The Qualtrics XM Platform offers best-in-class text analytics that’s powered by AI, machine learning, and deep-learning algorithms. But ours is a platform that goes a step further, bringing text, voice, and third-party sources together into one seamless solution via natural language processing.
Qualtrics XM™ is built on three key pillars that help brands turn customer insights into action:
1. Listen and understand
We help brands do this by empowering them to actively engage with their audience – via customer surveys, questionnaires, and research – while text analytics and natural language processing help you discover what people are saying – wherever they say it – in real-time.
So whether customers are calling to complain, emailing your support address, mentioning you on social platforms, or leaving praise on third-party review sites, you’ll know about it. Importantly, voice and text analytics is able to assign sentiment and meaning to all your otherwise unstructured text data.
2. Remember everything and get context
Contextual data is much more useful than reams of static numbers. XiD can create experience profiles for each customer and employee, connect their profiles to your CRM/HRIS systems, and orchestrate the ideal journey for target groups. With rich data visualization, you’ll be able to see where experience gaps lie and what needs to be fine-tuned.
3. Act with empathy and speed
With proactive suggestions and intelligent insights, you’ll be able to immediately take the appropriate next-right-action based on your customer or employee history and context, at scale.
Learn more about Qualtrics XM here
Why you should use text analytics in customer experience
Having your customer experience management (CXM) platform and text analytics software integrated means that you can use the outputs from your text analytics of customer feedback throughout your program to drive change throughout the organization.
- Include text visualizations in reports to trend, baseline, and identify key drivers
- Deeply analyze text data, such as topic and sentiment tags, alongside other quantitative measures from statistical analyses to find clusters and root causes of desired behaviors
- See trends over time to ensure that proactive action can be taken on areas of concern
- Automatically deliver role-based dashboards that include relevant text insights in Customer Experience and Employee Experience dashboards
- Trigger ongoing action items based on topic and sentiment to close the loop with upset and at-risk customers
- Benchmark topic categories and sentiment ratings to set goals for the future
You will also be able to uncover previously unknown themes lurking out there that you never knew to look for. Text analytics uses sophisticated machine learning models to discover blind spots that are hidden in free text comments, leading you to uncover customer pain points you never knew to look for.
Open-text is a great way to discover pain points you weren’t aware of, provide specific context to why a customer respondent left a negative NPS score, and prepare your customer service teams with the background needed to close the loop with the customer.
Text analysis with Qualtrics’ Text iQ
As outlined, your text analysis software needs to be sophisticated and manageable to accurately parse textual data.
Qualtrics Text iQ automates key processes to help you focus on the actions you need to take, rather than the analysis you need to make. Powered by patented machine learning and natural language processing, this complex but easy-to-use software is always listening and evaluating your customers’ key sentiments.
With the ability to monitor trends over time and analyze both structured and unstructured text, Text iQ can deliver you and your frontline staff the insights they need to understand and win over your target audience.
Effortlessly integrate feedback collection, research techniques and analytics with Qualtrics