
What is statistical significance?
If you’re not a researcher, scientist or statistician, it’s incredibly easy to misunderstand what’s meant by statistical significance. In common parlance, significance means “important”, but when researchers say the findings of a study were or are “statistically significant”, it means something else entirely.
Put simply, statistical significance refers to whether any differences observed between groups studied are “real” or simply due to chance or coincidence. If a result is statistically significant, it means that it’s unlikely to have occurred as a result of chance or a random factor.
Even if data appears to have a strong relationship, you must account for the possibility that the apparent correlation is due to random chance or sampling error.
For example, consider you’re running a study for a new pair of running shoes designed to improve average running speed.
You have two groups, Group A and Group B. Group A received the new running shoes, while Group B did not. Over the course of a month, Group A’s average running speed increased by 2km/h — but Group B (who didn’t receive the new running shoes) also increased their average running speed by 1.5km/h.
The question is, did the running shoes produce the 0.5km/h difference between the groups, or did Group A simply increase their speed by chance? Is the result statistically significant?
How do you test for statistical significance?
In quantitative research, you analyze data using null hypothesis testing. This procedure determines whether a relationship or difference between variables is statistically significant.
- Null hypothesis: Predicts no true effect, relationship or difference between variables or groups. This test aims to support the main prediction by rejecting other explanations.
- Alternative hypothesis: States your main prediction of a true effect, relationship or difference between groups and variables. This is your initial prediction that you want to prove.
Hypothesis testing always starts with the assumption that the null hypothesis is true. With this approach, you can assess the probability of obtaining the results you’re looking for — and then accept or reject the null hypothesis.
For example, you could run a test on whether eating before bed affects the quality of sleep. To start with, you have to reform your predictions into null and alternative hypotheses:
- Null hypothesis: There’s no difference in sleep quality when eating before bed.
- Alternative hypothesis: Eating before bed affects sleep quality.
When you reject a null hypothesis that’s actually true, this is called a type I error.
From here, you collect the data from the groups involved. Every statistical test will produce a test statistic, the t value, and a corresponding p-value.
What’s the t-value?
The test statistic, or t value, is a number that describes how much you want your test results to differ from the null hypothesis. It allows you to compare the average value of two data sets and determine if they come from the same population.
What is the p-value?
It’s here where it gets more complicated with the p (probability) value. The p-value tells you the statistical significance of a finding and operates as a threshold. In most studies, a p-value of 0.05 or less is considered statistically significant — but you can set the threshold higher.
A higher p-value of over 0.05 means variation is less likely, while a lower value below 0.05 suggests differences. You can calculate the difference using this formula: (1 - p-value)*100.
What this means is that results within that threshold (give or take) are perceived as statistically significant and therefore not a result of chance or coincidence.
The next stage is interpreting your results by comparing the p-value to a predetermined significance level.
What is a significance level?
Now, the significance level (α) is a value that you set in advance as the threshold for statistical significance. In simple terms, it’s the probability of rejecting the null hypothesis when it’s true. For example, a significance level of 0.05% indicates a 5% risk of concluding that a difference exists when there’s no actual difference.
Lower significance levels mean you require stronger, more irrefutable evidence before rejecting the null hypothesis. Also, though they sound similar, significance level and confidence level are not the same thing. Confidence level assesses the probability that if a poll/test/survey was repeated over and over again, the result obtained would remain the same.
You use the significance level in conjunction with your p-value to determine which hypothesis the data supports. If your p-value is less than the significance level, you can reject the null hypothesis and conclude that the results are statistically significant.
But surely there’s an easier way to test for statistical significance?
Calculate statistical significance with ease
Our statistical significance calculator helps you to understand the importance of one variable against another, but without the need for complex equations.
What you need to know before using the tool
You need to get your variables correct. Start by defining two scenarios (or hypotheses):
- Scenario one has a control variable that indicates the ‘usual’ situation, where there is no known relationship between the metrics being looked at. This is also known as the null hypothesis, which is expected to bring little to no variation between the control variable and the tested variable. This can be verified by calculating the z score (see below).
- Scenario two has a variant variable which is used to see if there is a causal relationship present.
You can test your hypotheses by calculating the z score and p value.
What is the z score?
The z-score is the numerical representation of your desired confidence level. It tells you how many standard deviations from the mean your score is.
The most common percentages are 90%, 95%, and 99%. It’s also recommended to carry out two-sided tests — but more on that later.
To find out more about z scores and how to use them, check out our sample size calculator tool.
How does the tool calculate statistical significance?
When you’re confident in the variables you placed in your hypotheses, you’re ready to use the tool. The tool works in two stages:
- First, it calculates the impact of two metrics across the two scenarios,
- Then, it compares the two data sets to see which scenario did better, and to what extent (is there a large difference or a small difference between new flavor sales on a hot day and a cold day?).
You’ll then be left with an error-free indication of the impact of an action (e.g. eating) on a reference data set (sleep quality), while excluding other elements (mattress, weather etc). This will show researchers the extent – or significance – of the impact (if there is a large or small correlation).
This is essentially a two-sided test, which is recommended for understanding statistical significance. Unlike a one-sided test that compares one variable with another to give an out-of-context conclusion, a two-sided test adds in a sense of scale.
For example, the performance level of the variant’s impact can be negative, as well as positive. In this way, a two-sided test gives you more data to determine if the variant’s impact is a real difference or just a random chance.
Here’s another example: let’s say you launch a brand-new ice cream flavor. On the first day of marketing it to customers, you happen to have excellent sales. However, it just so happens that it was also the hottest day of the year.
How can you say with certainty that rather than the weather, the new flavor was the cause for the increase in sales revenue? Let’s add the ice cream sales data to the calculator and find out.
Insert snapshot graphic of the ice cream variables into the calculator using example data: e.g.
May 1st (new flavor is the constant on a cold day – this is the control): Ice cream scoops sold = 50 and total sales revenue = £2500
May 2nd (new flavor is the constant on a hot day – this is the variant): Ice cream scoops sold = 51 and total sales revenue = £2505
In this case, the hot weather did not impact the number of scoops sold, so we can determine that there is almost zero chance of the hot weather affecting sales volume.
So, how do I know when something is statistically significant?
This is where the p-value comes back into play.
Where there is a larger variation in test results (e.g. a large conversion rate) between the control and variant scenarios, this means that there is likely to be a statistically significant difference between them. If the variant scenario causes more positive impact – e.g. a surge in sales – this can indicate that the variant is more likely to cause the perceived change. It’s unlikely that this is a coincidence.
Where there is less variation in results (e.g. a small conversion rate), then there is less statistical difference, and so the variant does not have as big an impact. Where the impact is not favorable – e.g. there was little upwards growth in sales revenue – this could indicate that the variant is not the cause of the sales revenue, and is therefore unlikely to help it grow.
Did the p-value you expected come out in the results?
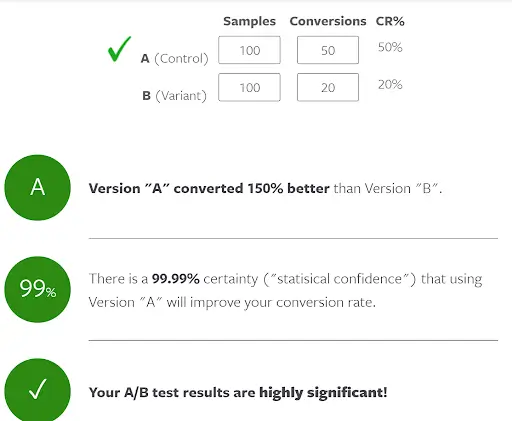
Example: A/B Testing Calculator
Another example of statistical significance happens in email marketing. Most email management systems (EMSs) have the ability to run an A/B test with a representative sample size.
An A/B test helps marketers to understand whether one change between identical emails – for example, a difference in the subject line, the inclusion of an image, and adding in the recipient’s name in the greeting to personalize the message – can enhance engagement. Engagement can come in the form of a:
- Higher open rate (by A/B testing different subject lines)
- Higher click-through conversion rate or more traffic to the website (by A/B testing different link text)
- Higher customer loyalty (by A/B testing the email that results in the fewest clicks on the unsubscribe link)
The statistical significance calculator tool can be used in this situation. An example of exploring the conversion rate of two subject lines with A/B testing this looks like:
Why is it important for business?
There are many benefits to using this tool:
- Management can rapidly turn around on products or services that are under-performing
- Using statistical significance can help you measure the impact of different growth initiatives to increase conversions or make positive impact
- Testing is quantitative and provides factual evidence without researcher bias
- By having a confirmed causal relationship, this can give you a confidence level that supports agile changes to a product or service for the better. For example, a low confidence level that a new ice-cream flavor affects sales can support the decision to remove that flavor from the product line