What is cluster analysis?
Cluster analysis is a statistical method for processing data. It works by organizing items into groups – or clusters – based on how closely associated they are.
Cluster analysis, like dimension reduction analysis (factor analysis), is concerned with data collection in which the variables have not been partitioned beforehand into criterion vs. predictor subsets.
The objective of cluster analysis is to find similar groups of subjects, where the “similarity” between each pair of subjects represents a unique characteristic of the group vs. the larger population/sample. Strong differentiation between groups is indicated through separate clusters; a single cluster indicates extremely homogeneous data.
Cluster analysis is an unsupervised learning algorithm, meaning that you don’t know how many clusters exist in the data before running the model. Unlike many other statistical methods, cluster analysis is typically used when there is no assumption made about the likely relationships within the data. It provides information about where associations and patterns in data exist, but not what those might be or what they mean.
Product Tour: XM for Strategic Research
When should cluster analysis be used?
Cluster analysis is for when you’re looking to segment or categorize a dataset into groups based on similarities, but aren’t sure what those groups should be.
While it’s tempting to use cluster analysis in many different research projects, it’s important to know when it’s genuinely the right fit. Here are three of the most common scenarios where cluster analysis proves its worth.
Exploratory data analysis
When you have a new dataset and are in the early stages of understanding it, cluster analysis can provide a much-needed guide.
By forming clusters, you can get a read on potential patterns or trends that could warrant deeper investigation.
Market segmentation
This is a golden application for cluster analysis, especially in the business world. Because when you aim to target your products or services more effectively, understanding your customer base becomes paramount.
Cluster analysis can carve out specific customer segments based on buying habits, preferences or demographics, allowing for tailored marketing strategies that resonate more deeply.
Resource allocation
Be it in healthcare, manufacturing, logistics or many other sectors, resource allocation is often one of the biggest challenges. Cluster analysis can be used to identify which groups or areas require the most attention or resources, enabling more efficient and targeted deployment.
How is cluster analysis used?
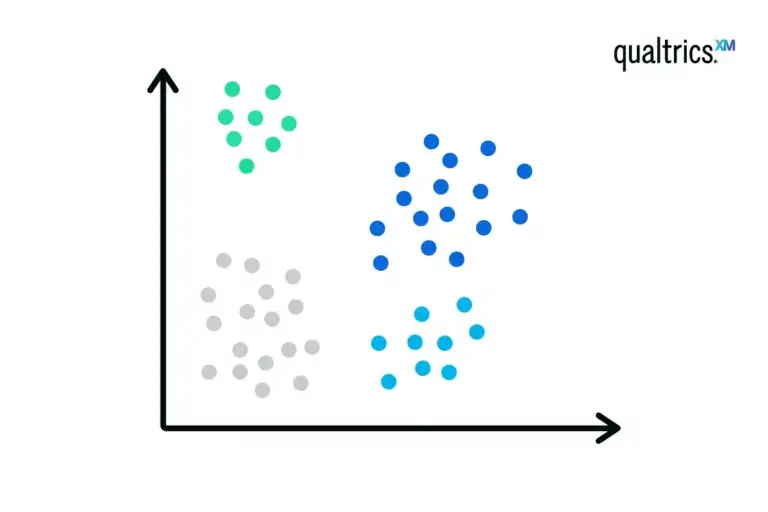
The most common use of cluster analysis is classification. Subjects are separated into groups so that each subject is more similar to other subjects in its group than to subjects outside the group.
In a market research context, cluster analysis might be used to identify categories like age groups, earnings brackets, urban, rural or suburban location.
In marketing, cluster analysis can be used for audience segmentation, so that different customer groups can be targeted with the most relevant messages.
Healthcare researchers might use cluster analysis to find out whether different geographical areas are linked with high or low levels of certain illnesses, so they can investigate possible local factors contributing to health problems.
Employers, on the other hand, could use cluster analysis to identify groups of employees who have similar feelings about workplace culture, job satisfaction or career development. With this data, HR departments can tailor their initiatives to better suit the needs of specific clusters, like offering targeted training programs or improving office amenities.
Whatever the application, data cleaning is an essential preparatory step for successful cluster analysis. Clustering works at a data-set level where every point is assessed relative to the others, so the data must be as complete as possible.
Cluster analysis in action: A step-by-step example
Here’s how an online bookstore used cluster analysis to transform its raw data into actionable insights.
Step one: Creating the objective
The bookstore’s aim is to provide more personalized book recommendations to its customers. The belief is that by curating book selections that will be more appealing to subgroups of its customers, the bookstore will see an increase in sales.
Step two: Using the right data
The bookstore has its own historical sales data, including two key variables: ‘favorite genre’, which includes categories like sci-fi, romance and mystery; and ‘average spend per visit’.
The bookstore opts to hone in on these two factors as they are likely to provide the most actionable insights for personalized marketing strategies.
Step three: Choosing the best approach
After settling on the variables, the next decision is determining the right analytical approach.
The bookstore opts for K-means clustering for the ‘average spend per visit’ variable because it’s numerical – and therefore scalar data. For ‘favorite genre’, which is categorical – and therefore non-scalar data – they choose K-medoids.
Step four: Running the algorithm
With everything set, it’s time to crunch the numbers. The bookstore runs the K-means and K-medoids clustering algorithms to identify clusters within their customer base.
The aim is to create three distinct clusters, each encapsulating a specific customer profile based on their genre preferences and spending habits.
Step five: Validating the clusters
Once the algorithms have done their work, it’s important to check the quality of the clusters. For this, the bookstore looks at intracluster and intercluster distances.
A low intracluster distance means customers within the same group are similar, while a high intercluster distance ensures the groups are distinct from each other. In other words, the customers within each group are similar to one another and the group of customers are distinct from one another.
Step six: Interpreting the results
Now that the clusters are validated, it’s time to dig into what they actually mean. Each cluster should represent a specific customer profile based solely on ‘favorite genre’ and ‘average spend per visit’.
For example, one cluster might consist of customers who are keen on sci-fi and tend to spend less than $20, while another cluster could be those who prefer romance novels and are in the $20-40 spending range.
Step seven: Applying the findings
The final step is all about action. Armed with this new understanding of their customer base, the bookstore can now tailor its marketing strategies.
Knowing what specific subgroups like to read and how much they’re willing to spend, the store can send out personalized book recommendations or offer special discounts to those specific clusters – aiming to increase sales and customer satisfaction.
Cluster analysis algorithms
Your choice of cluster analysis algorithm is important, particularly when you have mixed data. In major statistics packages you’ll find a range of preset algorithms ready to number-crunch your matrices.
K-means and K-medoid are two of the most suitable clustering methods. In both cases (K) = the number of clusters.
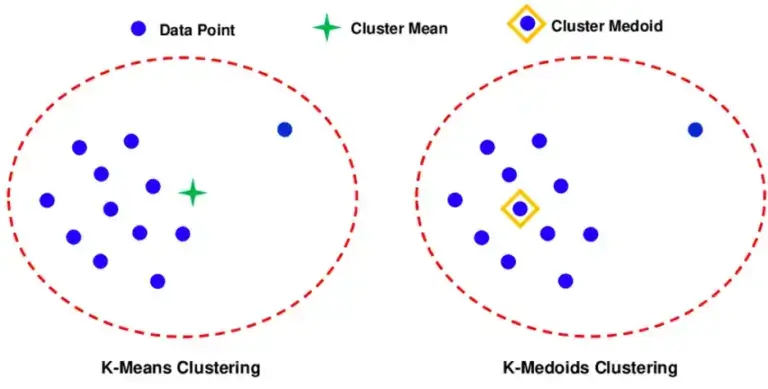
K-means
The K-means algorithm establishes the presence of clusters by finding their centroid points. A centroid point is the average of all the data points in the cluster. By iteratively assessing the Euclidean distance between each point in the dataset, each one can be assigned to a cluster.
The centroid points are random to begin with and will change each time as the process is carried out. K-means is commonly used in cluster analysis, but it has a limitation in being mainly useful for scalar data.
K-medoids
K-medoid works in a similar way to K-means, but rather than using mean centroid points which don’t equate to any real points from the dataset, it establishes medoids, which are real interpretable data-points.
The K-medoids clustering algorithm offers an advantage for survey data analysis as it is suitable for both categorical and scalar data. This is because rather than measuring Euclidean distance between the medoid point and its neighbors, the algorithm can measure distance in multiple dimensions, representing a number of different categories or variables.
K-medoids is less common than K-means in clustering analysis, but is often used when a more robust method that’s less sensitive to outliers is needed.
Measuring clusters using intracluster and intercluster distances
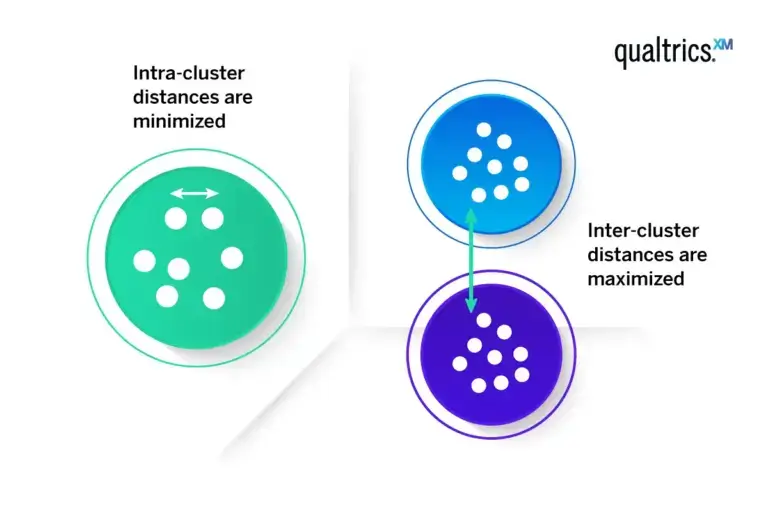
Evaluating the quality of clustering involves a two-pronged approach: assessing intracluster and intercluster distances.
Intracluster distance is the distance between the data points inside the cluster. If there is a strong clustering effect present, this should be small (more homogenous).
Intercluster distance is the distance between data points in different clusters. Where strong clustering exists, these should be large (more heterogenous).
In an ideal clustering scenario, you’d use both measures to gauge how good your clusters are. Low intracluster distances – known as high intra-cluster similarity – mean items in the same cluster are similar, which is good; high intercluster distances – known as low inter-cluster similarity – mean different clusters are well-separated, which is also good.
Using both measures gives you a fuller picture of how effective your clustering is.
Key considerations in cluster analysis
When getting started with cluster analysis, it makes sense to start with methods that assign each data point to a single, distinct cluster. It’s commonly accepted that within each cluster, the data points share similarities.
The assumption here is that your data set is composed of different, unordered classes, and that none of these classes are inherently more important than the others. In some cases, however, we may also view these classes as hierarchical in nature, with sub-classes within them – here we could apply hierarchical clustering and hierarchical cluster analysis.
Cluster analysis is often a “preliminary” step. That means before you even start, you’re not applying any previous judgments to split up your data; you’re working on the notion that natural clusters should exist within the data.
This initial approach differs from techniques like discriminant analysis, where you have a dependent variable guiding the classification. In cluster analysis, however, the focus is purely on inherent similarities within the data collection itself.
So, the key questions for cluster analysis would be:
- What metrics will you use to measure the similarity between data points, and how will each variable be weighted when calculating this measure?
- Once you’ve determined the similarities, what methods will you use to form the clusters?
- After forming clusters, what descriptive metrics will help define the nature of each cluster?
- Assuming you’ve adequately described your clusters, what can you infer about their statistical significance?
This should offer a clearer yet still approachable overview of the essential questions in cluster analysis.
Non-scalar data in cluster analysis
So far, we’ve mainly talked about scalar data – things that differ from each other by degrees along a scale, such as numerical quantity or degree. But what about items that are non-scalar and can only be sorted into categories?
When you’re dealing with such categories like color, species and shape, you can’t easily measure the “distance” between data points like you can with scalar data. Various techniques, like using dummy variables or specialized distance measures, can be employed to include non-scalar data in your cluster analysis.
Dummy variables are a way to convert categories into a format that can be provided to a mathematical model. For example, if you have a color category with options like red, blue and green, you could create separate “dummy” columns for each color, marking them as 1 if they apply and 0 if they don’t.
Specialized distance measures, on the other hand, are custom calculations designed to figure out how “far apart” different categories are from each other. For example, if you’re clustering based on movie genres, a specialized measure might decide that “action” and “adventure” are closer to each other than “action” and “romance”.
Ideally, the data for cluster analysis is categorical, interval or ordinal data. Using a mix of these types can complicate the analysis, as you’ll need to figure out how to meaningfully compare different kinds of data. It’s doable, but it adds an extra layer of complexity you’ll need to account for.
Cluster analysis and factor analysis
When you’re dealing with a large number of variables – for example a lengthy or complex survey – it can be useful to simplify your data before performing cluster analysis so that it’s easier to work with. Using factors reduces the number of dimensions that you’re clustering on, and can result in clusters that are more reflective of the true patterns in the data.
Factor analysis is a technique for taking large numbers of variables and combining those that relate to the same underlying factor or concept, so that you end up with a smaller number of dimensions. For example, factor analysis might help you replace questions – like “Did you receive good service?”, “How confident were you in the agent you spoke to?” and “Did we resolve your query?” – with a single factor: customer satisfaction.
This way you can reduce messiness and complexity in your data and arrive more quickly at a manageable number of clusters.
Ready to dive into cluster analysis? Stats iQ™ makes its easy
If you’re keen to perform cluster analysis but don’t have a stats degree, don’t worry – Stats iQ has you covered.
The world’s most powerful statistical analysis tool does the heavy lifting, running the appropriate tests and translating complex results into straightforward language.
Whether you’re looking to segment your market or explore new datasets, Stats iQ gives you the confidence to take the next step.
Product Tour: XM for Strategic Research