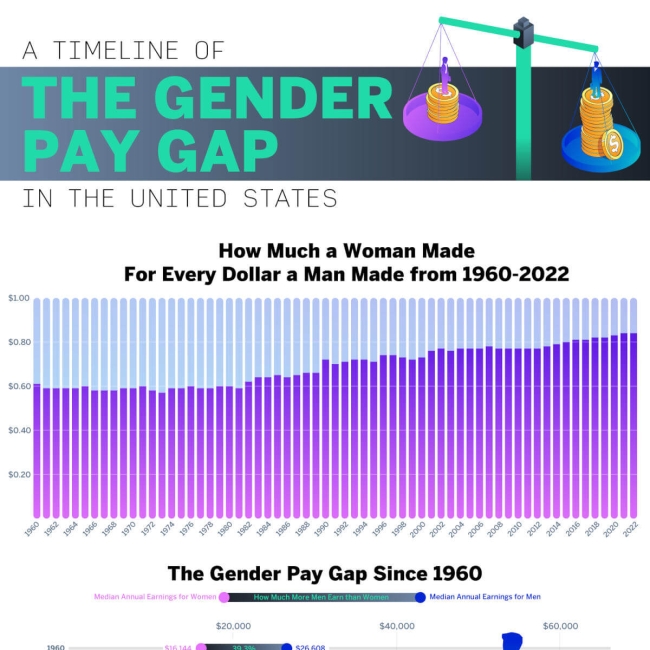
Although the pay gap has gotten slightly better over the past several decades, the gender pay gap is real, and past legislation has only done so much to minimize it. The Equal Pay Act passed in 1963 was created to abolish the wage disparity between men and women, but sixty years later, the gender pay gap continues with today’s women only earning 84 cents to every dollar earned by men. When the Equal Pay Act was first passed into law women only earned 59 cents for every dollar, so while the pay gap has lessened there is still work to be done to prevent it from taking an additional thirty years before women earn the same amount of money as men. The Qualtrics team used earnings data from the U.S. Census to create a timeline of the gender wage gap in the U.S. to see how it has changed since 1960. Unfortunately, it may be a few more decades until gender inequality in pay is a thing of the past.

<a href="https://www.qualtrics.com/articles/employee-experience/timeline-gender-pay-gap/"><img src="https://www.qualtrics.com/sites/default/files/styles/standard_xl/public/migrations/content/timeline-gender-pay-gap-3.png.webp?itok=zAv8nrna" alt="A Timeline of the Gender Pay Gap in the United States – Qualtrics.com Diversity, Equity, and Inclusion - Infographic" title="A Timeline of the Gender Pay Gap in the United States - Qualtrics.com - Infographic"></a><br><a href="https://www.qualtrics.com" alt="Qualtrics.com Diversity, Equity, and Inclusion" title="Qualtrics.com">By Qualtrics.com
1. What is the gender pay gap?
The gender pay gap is a measure of the difference in earnings between working men and working women. Women have generally been found to earn less than men, even when doing the same job. The gender wage gap is a problem in the U.S. and around the world; it reduces economic output and leaves women to be more dependent on welfare benefits. The gender pay gap is said to be a result of social and economic factors that include motherhood, gender discrimination, and gender roles in the workplace.
2. How much do women earn to every dollar men earn?
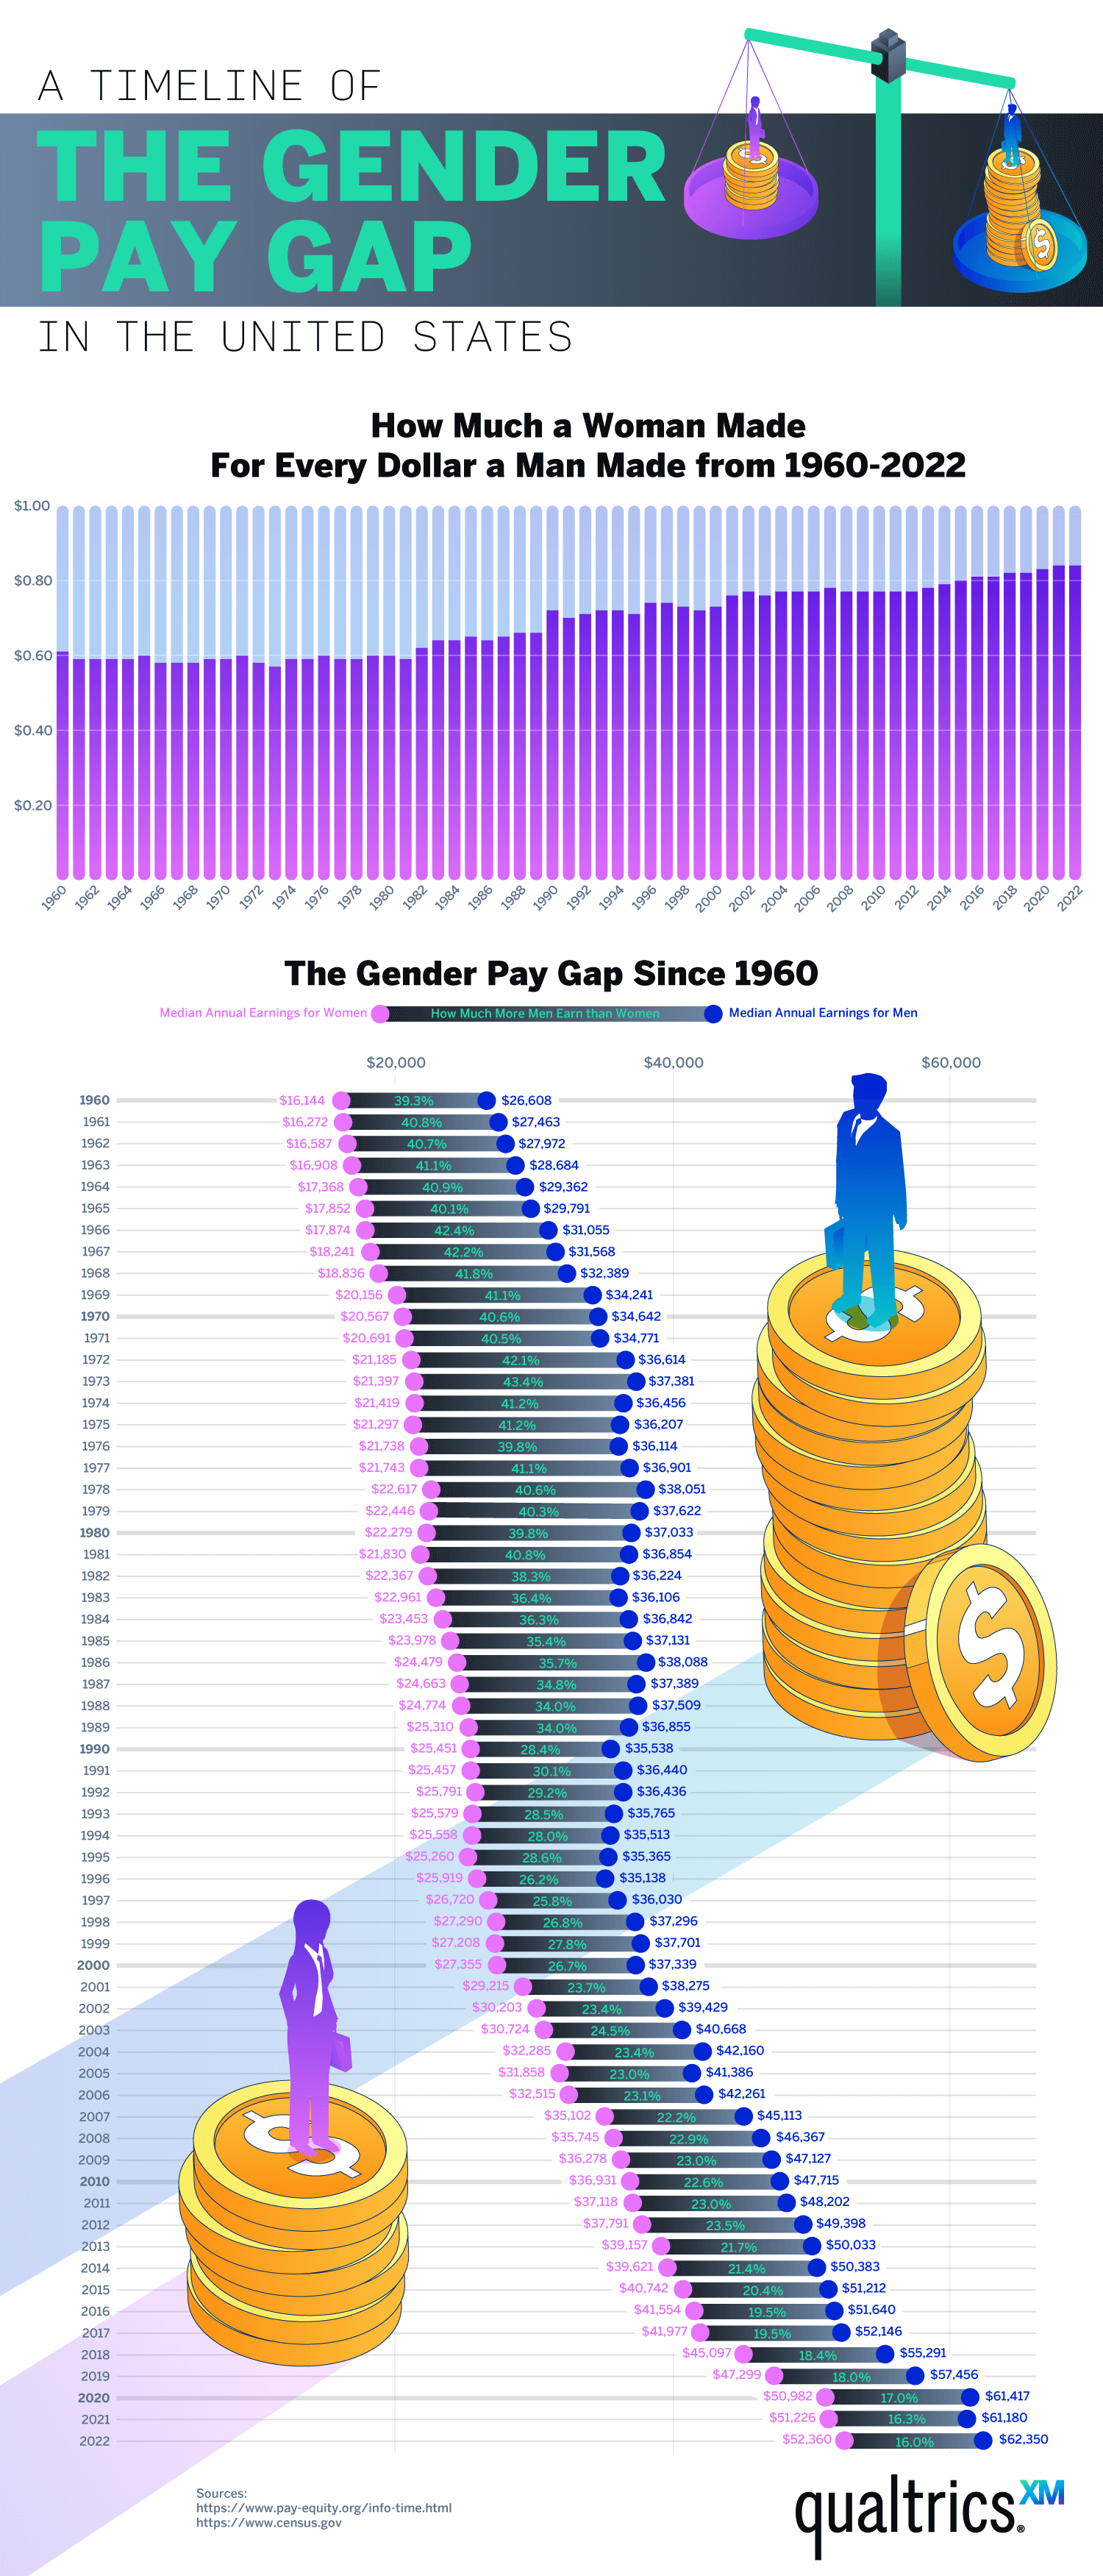
When the gender wage gap first started being tracked in 1960, women earned $0.61 for every dollar men earned. The wage gap fluctuated between $0.57 and $0.61 for the following twenty years until 1982 when the gap payment slowly began to decrease. At the turn of the century, in 2000, women earned $0.73 cents for every dollar earned by men. What is the wage gap now? By 2022, the gender pay gap has lessened to women earning $0.84 per dollar earned by men. It took sixty years for the pay inequality between men and women to decrease by half, it could take many more years until women and men are finally paid equally.
Amount women earned to every dollar men earned (by decade)
- 1960: $0.61
- 1970: $0.59
- 1980: $0.60
- 1990: $0.72
- 2000: $0.73
- 2010: $0.77
- 2020: $0.83
3. What is the Equal Pay Act?
The Equal Pay Act is a U.S. labor law that was passed in 1963 to amend the Fair Labor Standards Act. While the Fair Labor Standards Act of 1938 established fair labor standards in employment, like the right to minimum wage and prohibiting child labor, the Equal Pay Act of 1963 was created to abolish pay disparity by gender. Has the Equal Pay Act helped to lessen the wage gap between men and women? While the wage gap in America has grown smaller over the past sixty years, the pay gap between men and women continues as men were paid 16% more than women in 2022. This may be an improvement over the gender income gap between 1960 and 1980 when men earned an average of 40% more than women, but more progress needs to be made when it comes to the gender pay gap going forward.
4. Will the Gender Wage Gap Ever Close?
The Equal Pay Act of 1963 was passed into law over sixty years ago but it could take an additional thirty years before pay equity has been reached and we see equal pay for women, according to a recent analysis by the Center for American Progress. The CAP analysis found that if the gender wage gap continues to shrink at the same rate, pay parity won’t be reached until 2056. Lawmakers need to do more to address the U.S. wage gap so that it doesn’t take ninety years after the 1963 Equal Pay Act was passed for pay parity to finally be reached.
Learn how Qualtrics® can help you design an organization that embraces diversity, equity, and inclusion with our DEI solutions.
5. How much a woman made for every dollar a man made from 1960-2022
| Year | The Average Amount a Woman Makes For Every Dollar a Man Makes |
|---|---|
| 1960 | $0.61 |
| 1961 | $0.59 |
| 1962 | $0.59 |
| 1963 | $0.59 |
| 1964 | $0.59 |
| 1965 | $0.60 |
| 1966 | $0.58 |
| 1967 | $0.58 |
| 1968 | $0.58 |
| 1969 | $0.59> |
| 1970 | $0.59 |
| 1971 | $0.60 |
| 1972 | $0.58 |
| 1973 | $0.57 |
| 1974 | $0.59 |
| 1975 | $0.59 |
| 1976 | $0.60 |
| 1977 | $0.59 |
| 1978 | $0.59 |
| 1979 | $0.60 |
| 1980 | $0.60 |
| 1981 | $0.59 |
| 1982 | $0.62 |
| 1983 | $0.64 |
| 1984 | $0.64 |
| 1985 | $0.65 |
| 1986 | $0.64 |
| 1987 | $0.65 |
| 1988 | $0.66 |
| 1989 | $0.66 |
| 1990 | $0.72 |
| 1991 | $0.70 |
| 1992 | $0.71 |
| 1993 | $0.72> |
| 1994 | $0.72 |
| 1995 | $0.71 |
| 1996 | $0.74 |
| 1997 | $0.74 |
| 1998 | $0.73 |
| 1999 | $0.72 |
| 2000 | $0.73 |
| 2001 | $0.76 |
| 2002 | $0.77 |
| 2003 | $0.76 |
| 2004 | $0.77 |
| 2005 | $0.77 |
| 2006 | $0.77 |
| 2007 | $0.78 |
| 2008 | $0.77 |
| 2009 | $0.77 |
| 2010 | $0.77 |
| 2011 | $0.77 |
| 2012 | $0.77 |
| 2013 | $0.78 |
| 2014 | $0.79 |
| 2015 | $0.80 |
| 2016 | $0.81 |
| 2017 | $0.81 |
| 2018 | $0.82 |
| 2019 | $0.82 |
| 2020 | $0.83 |
| 2021 | $0.84 |
| 2022 | $0.84 |
6. The gender pay gap since 1960
| Year | Median Annual Earnings for Women | Median Annual Earnings for Men | How Much More Men Earn than Women |
|---|---|---|---|
| 1960 | $16,144 | $26,608 | 39.30% |
| 1961 | $16,272 | $27,463 | 40.80% |
| 1962 | $16,587 | $27,972 | 40.70% |
| 1963 | $16,908 | $28,684 | 41.10% |
| 1964 | $17,368 | $29,362 | 40.90% |
| 1965 | $17,852 | $29,791 | 40.10% |
| 1966 | $17,874 | $31,055 | 42.40% |
| 1967 | $18,241 | $31,568 | 42.20% |
| 1968 | $18,836 | $32,389 | 41.80% |
| 1969 | $20,156 | $34,241 | 41.10% |
| 1970 | $20,567 | $34,642 | 40.60% |
| 1971 | $20,691 | $34,771 | 40.50% |
| 1972 | $21,185 | $36,614 | 42.10% |
| 1973 | $21,397 | $37,381 | 43.40% |
| 1974 | $21,419 | $36,456 | 41.20% |
| 1975 | $21,297 | $36,207 | 41.20% |
| 1976 | $21,738 | $36,114 | 39.80% |
| 1977 | $21,743 | $36,901 | 41.10% |
| 1978 | $22,617 | $38,051 | 40.60% |
| 1979 | $22,446 | $37,622 | 40.30% |
| 1980 | $22,279 | $37,033 | 39.80% |
| 1981 | $21,830 | $36,854 | 40.80% |
| 1982 | $22,367 | $36,224 | 38.30% |
| 1983 | $22,961 | $36,106 | 36.40% |
| 1984 | $23,453 | $36,842 | 36.30% |
| 1985 | $23,978 | $37,131 | 35.40% |
| 1986 | $24,479 | $38,088 | 35.70% |
| 1987 | $24,663 | $37,389 | 34.80% |
| 1988 | $24,774 | $37,509 | 34.00% |
| 1989 | $25,310 | $36,855 | 34.00% |
| 1990 | $25,451 | $35,538 | 28.40% |
| 1991 | $25,457 | $36,440 | 30.10% |
| 1992 | $25,791 | $36,436 | 29.20% |
| 1993 | $25,579 | $35,765 | 28.50% |
| 1994 | $25,558 | $35,513 | 28.00% |
| 1995 | $25,260 | $35,365 | 28.60% |
| 1996 | $25,919 | $35,138 | 26.20% |
| 1997 | $26,720 | $36,030 | 25.80% |
| 1998 | $27,290 | $37,296 | 26.80% |
| 1999 | $27,208 | $37,701 | 27.80% |
| 2000 | $27,355 | $37,339 | 26.70% |
| 2001 | $29,215 | $38,275 | 23.70% |
| 2002 | $30,203 | $39,429 | 23.40% |
| 2003 | $30,724 | $40,668 | 24.50% |
| 2004 | $32,285 | $42,160 | 23.40% |
| 2005 | $31,858 | $41,386 | 23.00% |
| 2006 | $32,515 | $42,261 | 23.10% |
| 2007 | $35,102 | $45,113 | 22.20% |
| 2008 | $35,745 | $46,367 | 22.90% |
| 2009 | $36,278 | $47,127 | 23.00% |
| 2010 | $36,931 | $47,715 | 22.60% |
| 2011 | $37,118 | $48,202 | 23.00% |
| 2012 | $37,791 | $49,398 | 23.50% |
| 2013 | $39,157 | $50,033 | 21.70% |
| 2014 | $39,621 | $50,383 | 21.40% |
| 2015 | $40,742 | $51,212 | 20.40% |
| 2016 | $41,554 | $51,640 | 19.50% |
| 2017 | $41,977 | $52,146 | 19.50% |
| 2018 | $45,097 | $55,291 | 18.40% |
| 2019 | $47,299 | $57,456 | 18.00% |
| 2020 | $50,982 | $61,417 | 17.00% |
| 2021 | $51,226 | $61,180 | 16.30% |
| 2022 | $52,360 | $62,350 | 16.00% |


