The challenge for experience management professionals
Those tasked with experience-related responsibilities (Customer Experience, Employee Experience, Brand Experience, Product Experience, etc.) often carry a heavy weight:
“How am I going to tell the CFO the impact of what we’re doing?”
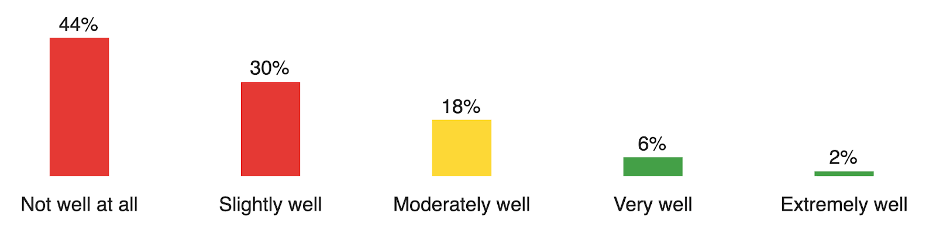
I have been collecting data from XM practitioners for the past 18 months on this topic. Specifically, I ask them how well they have connected their experience-related programs to financial outcomes:
When we drill into how these individuals are approaching the challenge, we see a wide variety of methods but a consistent set of challenges:
- Missing skillset
- Data challenges
- Not a priority
I’d like to share an approach that I have found to be reliable, will help you address the items above, and can be done without advanced analysis techniques (though they can certainly help).
We call it Experience Value at Risk.
Traditional value at risk (VaR)
Investment professionals, financial institutions, and other organizations often want to understand the downside risk associated with a specific investment or investment portfolio. As part of their risk analysis, they often use Value at Risk (VaR) calculations to assess how susceptible a particular investment is to losses.
To do this, they define a period of time and confidence level for the analysis. Upon completing the analysis, they are able to say something like, “We are 95% confident that our losses will not exceed $xM over the next 12 months.”
They typically use one or multiple of the following methods as part of their VaR calculation:
- Historical method: This approach calculates VaR based on the frequency and magnitude of historical returns
- Parametric method: This approach assumes that the returns follow a specific distribution and uses the distribution parameters to calculate the VaR
- Monte Carlo simulation: This approach simulates a large number of scenarios, often based on the historical return distribution, to allow the analyst to estimate VaR
Organizations use the findings to make better investment decisions, address portfolio risk factors, communicate risk levels, and more.
Value at risk for experience management
We apply the principles of Value at Risk to the domain of experience management to assess the downside risk associated with negative experiences. Experience Value at Risk (or, xVAR for short) estimates the amount of money that an organization leaves on the table due to bad, broken, ineffective, or inefficient experiences.
Questions like the following examples are at the heart of the xVAR analysis:
- What portion of your customer churn is due to bad experiences?
- How much of your workforce’s unproductive time is due to employee experience gaps such as inadequate support, resources, and management?
- What percent of your failed product launches could have been saved or avoided with the right insights about your market?
These simple examples direct you to the type of analysis that goes into xVAR. Address questions like these to provide a concrete view of how experiences are impacting your performance.
Consider what historical data exists that can help you answer these questions. For example, what are the reasons your customers churn? What is the percent breakdown of these reasons? Which of these reasons are experience-related? Establish confidence intervals based on what you know about your business, its historical performance, and other organizations.
Your analysis should result in an estimate of how much specific business metrics are at risk due to negative experiences. For example, “Without taking additional action, we expect between 5-10% of our customers to churn this year due to bad experiences.”
Go one step further to estimate how much money this represents to the organization. You might say something like, “We expect this to equate to $25M-50M over the next 3 years.”
If you have analysis resources at your disposal, you can incorporate more advanced techniques. For example, you might use a Monte Carlo model to generate more observations given your historical performance and assumptions. You could conduct the xVAR analysis for various confidence levels and assumptions. Or you might improve your predictions by establishing relationships between your outcome metrics and other variables for which you have more precise predictions.
How to calculate experience value at risk
Experience Value at Risk is a great way to start quantifying the value that experience management can bring to your organization. If you want to start on this journey, choose a few relevant outcome metrics and estimate how much of a role experience plays in each. You can build on this by involving others to refine your estimates, conducting online research, collecting more data, and more. If you’d like to refine the results of the assessment for your organization, reach out to your Qualtrics account team!
Start Actioning on Your Experience Value at Risk Calculation