What is the most significant yearly expense for Americans: food, personal insurance, housing, or entertainment? At Qualtrics, we recognize the importance of analyzing and leveraging data, which prompted our curiosity about spending habits among Americans across various income brackets. After conducting extensive research and analysis, we uncovered intriguing insights into how these expenses vary in relation to economic factors, personal priorities, and lifestyle choices. Let’s delve into the findings to gain a clearer understanding of how Americans allocate their financial resources.
<a href="https://www.qualtrics.com/articles/customer-experience/what-americans-spend-the-most-on/"><img src="https://www.qualtrics.com/sites/default/files/styles/standard_large/public/migrations/content/American-spending-3.png.webp" alt="What Do Americans Spend the Most on Each Year? - Qualtrics Customer Experience - Infographic" loading="lazy"></a><br><a href="https://www.Qualtrics.com" alt="Qualtrics Customer Experience" title="Qualtrics.com">By Qualtrics.com</a>
What Does the Average American Spend the Most on Each Year?
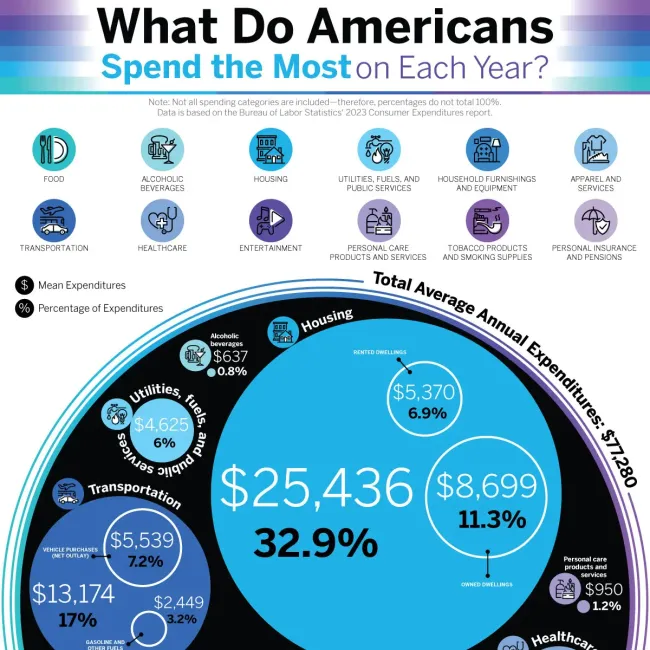
According to our analysis of spending data from the U.S. Bureau of Labor Statistics, the average American household spends around $77,280 per year. As you would expect, the majority of that goes towards necessary expenses such as housing, transportation, and food. Here’s a breakdown of the top five expenditures per household on average.
1. Housing – $25,436 (32.9% of total annual expenses)
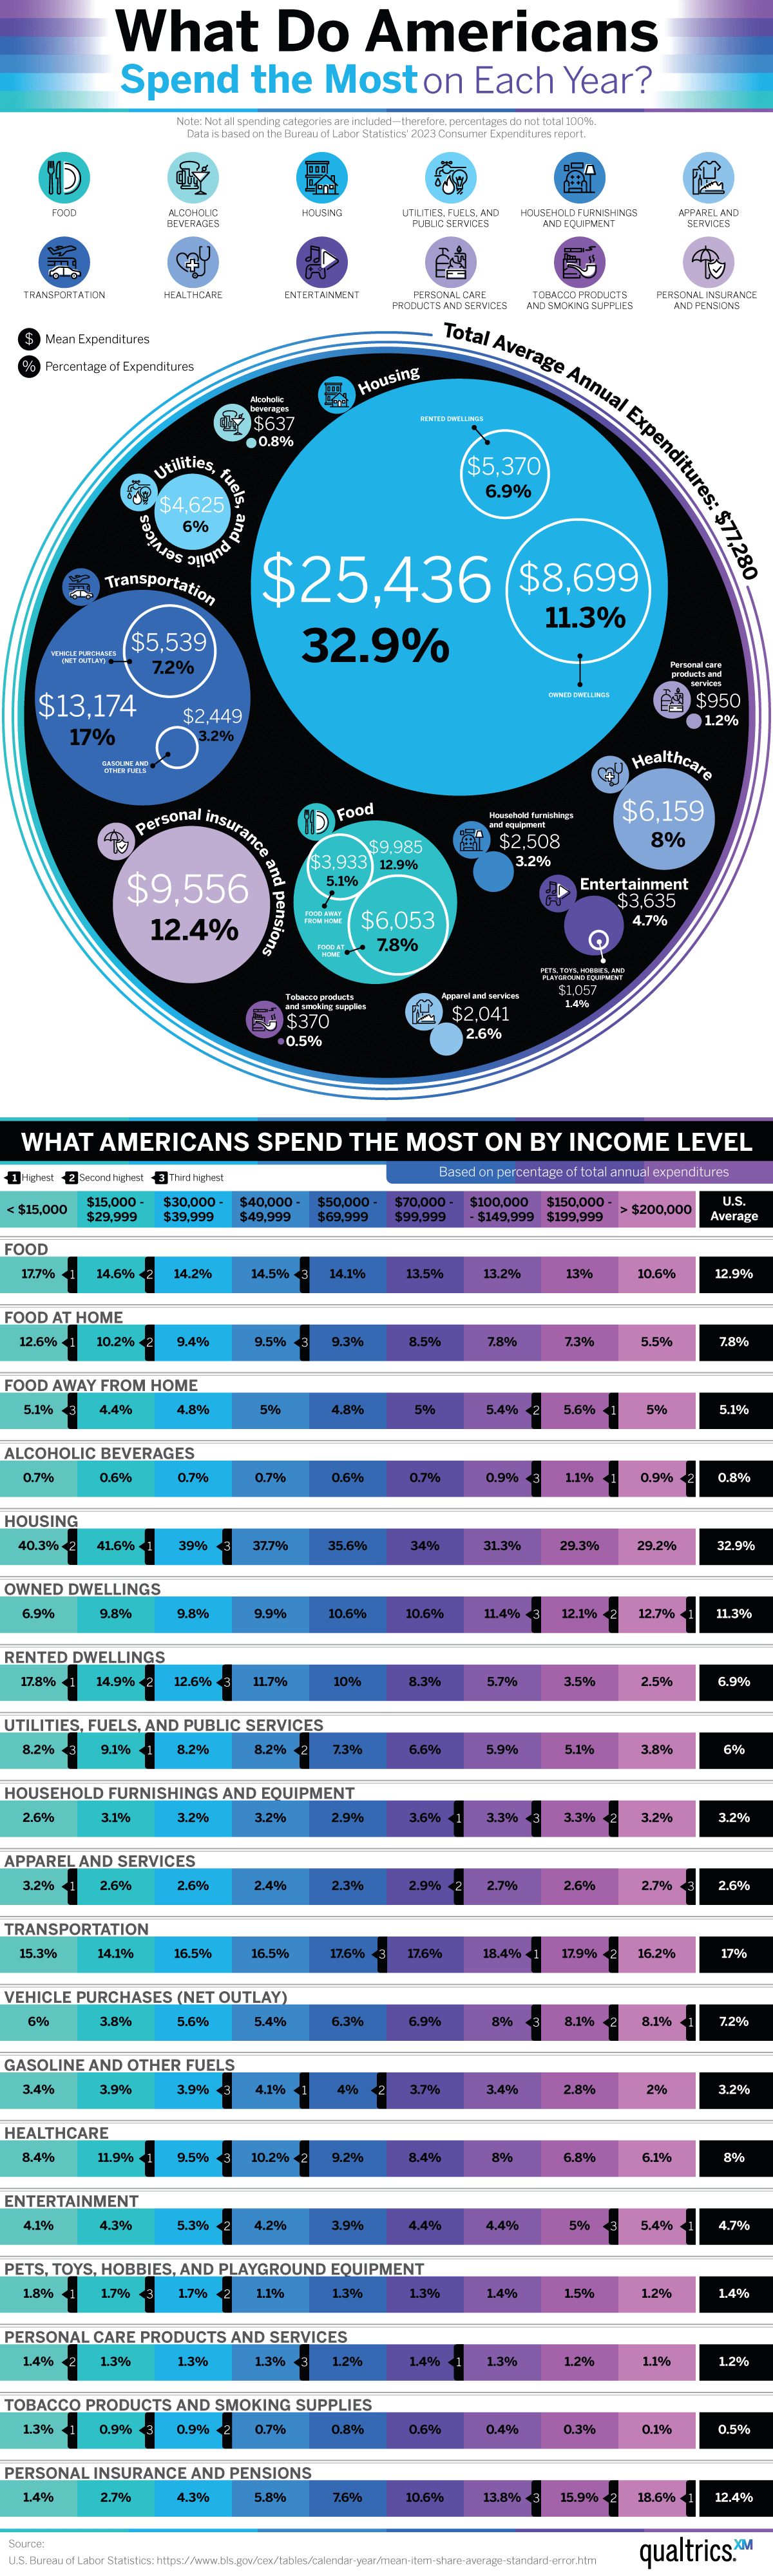
Regardless of where you live, housing is an essential expense that everyone must manage. Households in all income brackets reported spending the largest portion of their yearly budget on housing. This is true for everyone, whether they earn $15,000 a year or over $200,000. According to the U.S. Department of the Treasury, housing costs are rising faster than income levels. This could mean that Americans may soon be spending an even larger percentage of their income on putting a roof over their heads.
2. Transportation – $13,174 (17% of total annual expenses)
Surprisingly, transportation costs are the second-highest expense for the average American family. To commute to and from work, drop the kids off at school, and go to the grocery store, people must purchase expensive vehicles and cover costs for fuel and repairs regularly. A steady increase in gas prices isn’t making anything easier for Americans, and the amount they dedicate to their transportation budget. Americans can save money on transportation by utilizing the public transportation systems available in many areas of the country, but those who do are few and far between. Statistics show that an incredible 92% of Americans own one or more cars as of 2023.
3. Food – $9,985 (12.9% of total annual expenses)
Coming in third place is another necessary expense: food. As of 2024, it was estimated that Americans are spending an average of $1,174 on groceries every month. For nearly all income categories, food is the second or third largest expenditure, with most income levels reporting it occupying between 13% and 14% of their annual budgets. The sole exception is American households in the lowest income bracket, those earning below $15,000, who report food spending as high as 17.7% of their total yearly expenses.
4. Personal Insurance and Pensions – $9,556 (12.4% of total annual expenses)
Another sizable expenditure for the average American is categorized under personal insurance and pensions. This is especially true for Americans in higher income brackets. For instance, Americans earning $200,000 or more a year spend a whopping 18.6% of their income on personal insurance and pensions. Similarly, Americans earning between $150,000 and $199,999 per year allocate 15.9% of their income to these expenses. Let’s compare this to American families earning between $30,000 and $39,999 per year; their personal insurance and pension spending sits at a meager 4.3%. This trend is easily explained. People who earn more money own more valuable assets, and those assets require insurance protection.
5. Healthcare – $6,159 (8% of total annual expenses)
Americans, in particular, spend a lot on healthcare. In fact, they spend nearly twice as much as people from other wealthy countries on average. As a result, healthcare accounts for 8% of total annual expenditures for all Americans. As is true with housing, the income bracket that spends the most on healthcare is those who earn between $15,000 and $29,000 per year. With the rising costs of medical services and insurance premiums, healthcare is unlikely to become more affordable for Americans in the near future.
Understanding the spending habits of potential customers and current consumer market trends is crucial for developing a successful business strategy. Given the complexity of these factors, it’s essential to have support. At Qualtrics, we are here to assist you throughout the entire process.
We offer market research that delivers actionable insights, product research that helps you meet and exceed customer expectations, and brand research that enables your brand to become its best version. These are just a few of the ways we can support your growth.
Additionally, we are committed to enhancing your customer experience efforts. Whether through digital experience, contact center analytics, or online reputation management, we provide the insights you need to understand what your customers value most.
Source
U.S. Bureau of Labor Statistics: https://www.bls.gov/cex/tables/calendar-year/mean-item-share-average-standard-error.htm