
Product management definition
So what is product management exactly? Product management is the activity of guiding the entire lifecycle of a product, service or experience, from the development process to the pricing and packaging. A product manager oversees the product management process, typically as part of a product team.
The activities involved in product management might vary from business to business, depending on the sector, the target market, the scale of the business and the budgets available. Typically, product management includes:
- Product strategy and product vision
- Product design and development
- Product launch and product marketing
A product manager’s tasks might range from conceptual and strategic thinking, to hands-on work conducting research on user feedback from existing customers and other consumers, to communication and liaison with key stakeholders including business leaders, project managers and engineering teams.
Product manager vs project manager – what’s the difference?
Project management and product management are easily confused. Aside from having similar-sounding job titles, product managers and project managers have a few other things in common. Both are responsible for managing processes and liaising with many different people across different roles to coordinate a large project.
However, a product manager is responsible for setting the goal of the project and owning the product vision. A project manager is focused on the logistics of getting the work done. Project management may overlap with some of the things a product manager does, but there are strategic elements of product management that a project manager would not normally be involved with.
To use an analogy from the world of film and TV, the product manager is a bit like a director, and the product is the film or TV show they guide using a creative vision. A project manager is more like a producer – they get things done behind the scenes and keep the project logistically on track.
Learn about Qualtrics Product & Innovation Research
Why is product management important?
The world is filled with products, services and experiences, all vying for the same finite number of consumer wallets. For just about every conceivable human or business need there are multiple solutions available – so much so that weighing up the options can be a serious mental workout.
Enter product management – the practice of making and keeping a product competitive, appealing and appropriate for its audience.
In a fiercely competitive landscape, product management adds value by helping businesses gain the maximum possible ROI from their products, services and experiences. By managing the product lifecycle, the product manager leads on optimizing and adapting the product to its market at each stage. In other words, product management helps make your company’s products the very best they can be.
This doesn’t just happen at the start of a product’s journey. While a significant amount of work goes into developing new products and bringing them to market, a product manager’s task continues for the entire lifespan of the product.
Markets are fast-moving and complex, and products can rarely succeed by staying the same over time. A successful product needs to be continually reviewed, checked and altered to make sure it’s fulfilling its potential and remains relevant. Product managers make sure this happens.
Product management roles
It takes a whole range of people working together to manage a major product successfully. It also involves a lot of product management job titles, some of which might overlap. Different businesses use product management job titles in different ways, but here are some you might hear as you learn about product management or interact with product managers and product team members.
Product manager
This job title is often abbreviated to ‘PM’. ‘Product manager’ is the most frequently used product management job title, and the one with the broadest application. People with the job title product manager may be senior or junior, and have different specialisms within their field.
Technical product manager
Technical product managers will have a strong background in technology and engineering. They are likely to work closely with an engineering team on a tech-based product, service or experience. Technical skills and technical knowledge are just as important for them as a product manager certification.
Product marketing manager
Product marketing managers are marketing specialists. They come to the fore when the product has been developed and it’s time to introduce it to the market. However, it’s important for the product marketing manager – sometimes called a PMM – to be involved with the project from the start, developing ownership over its branding and the storytelling around it. Product marketing managers use a deep understanding of the product and its audience to create marketing messages and a launch strategy.
Chief product officer
A chief product officer (or CPO) represents product management at C-suite level. This role can also be called VP of Product or Head of Product. The CPO provides leadership for product managers and product teams across the organization, and creates the product strategy for the whole company. They may have final say on questions like product pricing.
Product owner
The job title of product owner often appears in the context of agile product management. Agile product management uses a slightly different vocabulary to ‘standard’ product management. In line with agile software development and Scrum project management, the roles of product owner and product manager are shaped around specific ways of working. Product owners and agile product managers work with engineering teams as part of an agile development cycle, making sure that product value is added with each iteration of software development.
In this context, product managers and product owners have slightly different job responsibilities. Generally a product owner is more tactical than strategic, and will have less responsibility for the long-term trajectory of the product.
Product roadmap

The product roadmap is central to the product management process, and is owned by the product manager. It captures the product vision and lays out the strategy for achieving it, along with a rough timeline and project milestones. The product roadmap is not a detailed spec sheet for the product, but a high-level strategic plan that lays out the goals to be achieved and the timelines for achieving them.
Successful product roadmaps also serve as a communication tool for product managers. The product roadmap will be shared with a wide range of business teams and stakeholders across the company in order to build awareness and get buy-in for the product development process. Business savvy product managers will therefore include business objectives in the roadmap and link them to the product strategy.
The product manager can also use the product roadmap to introduce the strategic background of the product, its target customers and their pain points, and how the product strategy will meet their needs.
Because the product roadmap is visible to a wide range of people with different levels of knowledge about product management, it needs to be designed and worded accessibly to make sure everyone can understand it. Part of this is keeping it brief – it doesn’t need to cover everything. It’s better for the product manager to keep the roadmap high-level and focus on inspiring people’s interest, rather than briefing them exhaustively.
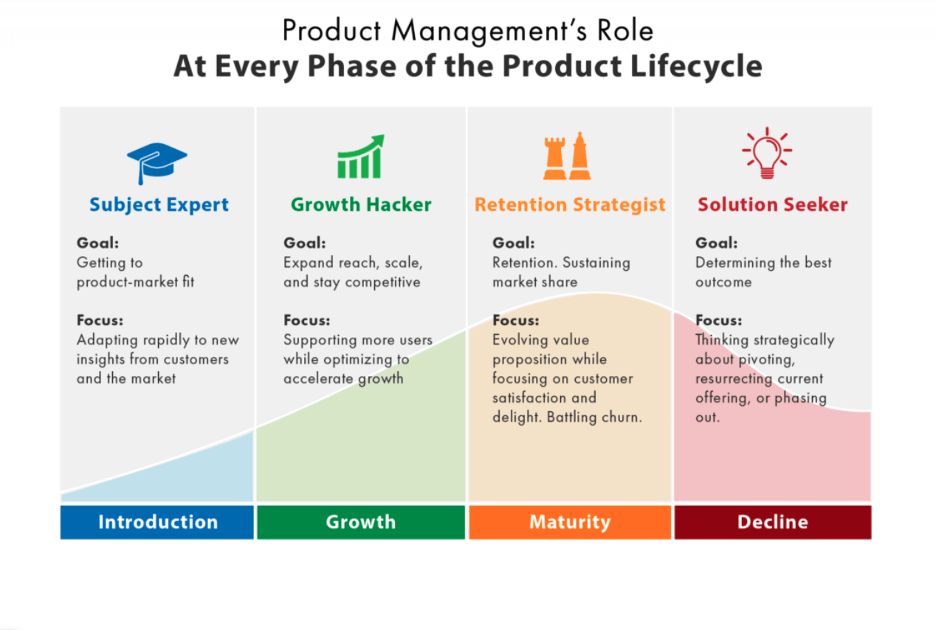
The product lifecycle
To understand the role of product managers, it’s useful to know how the product lifecycle works. A product’s lifecycle comprises four broad stages:
- Launch
- Growth
- Maturity
- Decline
Sales rise from launch to growth and peak at maturity. They then decline as the product reaches the end of its viable period and is eventually taken off the market.
Product managers have different roles and responsibilities at different stages of their product’s lifecycle. You might think that the goal of every product manager is to maximize the growth, extend the maturity period and postpone the decline for as long as possible. However, product managers understand that every product, service or experience has a limited lifespan, and aim to make the best of each stage.
Product management in action

What happens in the everyday life of a product manager? Here are some of the professional activities product managers might undertake.
Develop the product vision
The product vision is a statement of intent for the whole life of the product, concisely summing up what it aims to achieve and what it will do for the company and the market in the long term. Because it’s such a fundamental part of product development, it will likely be created in collaboration, involving product development team, product management team, CPO and other stakeholders. The product manager will own the product vision and take responsibility for bringing it to life.
Advise and support
There is a lot of work to be done before launching a product, and the product manager is a great resource for the product team at this stage, playing an active role in a product’s development.
Their knowledge from previous product management experience will be useful here, as they can give valuable insights, opinions and guidance to help shape a development team’s initial product ideas and draw attention to potential pitfalls.
Communicate and connect
Product managers work with a wide range of business teams, and may act as an information channel or go-between, coordinating activities and keeping everyone up to speed. They need to be great communicators, persuasive and organized, in order to take everyone’s point of view on board and provide a shared vision.
Customer needs analysis
Fundamentally, a product lives or dies by its ability to meet customer needs. Understanding customer feedback and making sure the product aligns with user needs and goals is a big part of a product manager’s job. They have to know the customer experience in detail, and be aware of what potential customers are looking for.
Research the market
The product manager’s goal is to help the product team achieve, and keep, product-market fit, and product managers are closely involved in market research. They need to understand the market landscape, including their competitors’ offerings and brand positioning. They may conduct analysis and consult secondary research sources as well as doing first-party research.
Understand user experience
Product managers may take part in user research, learning as much as they can about the customer pain points during the user experience through user interviews, focus groups and other research methods.
Help create and refine product features
Product managers define the product positioning, and can also collaborate closely with the development team on feature definition and other aspects of product development. Part of this is feature prioritization, where potential features are ranked according to their value to the customer, their cost, ease of development, and alignment with business goals.
Product management tools
As with so many aspects of business, product management can be done more quickly, efficiently and accurately with the use of technology and tools. Great product software can assist product managers across every stage of the product lifecycle. Here are just a few of the ways it can help.
Feature prioritization
Conjoint analysis is a powerful statistical tool that product managers can use to understand how customers prioritize the features in a product. By offering customers multiple feature combinations, product managers can gauge which features are most valuable, appealing or useful, and what the optimum combination will be.
Another useful tool for feature prioritization is card-sorting. Digital card-sorting helps users express their preferences by selecting from a wide variety of available options presented on cards and allocating them to categories like ‘must have’, ‘nice to have’ and ‘don’t need’.
Concept testing
Concept testing tools provide product managers with the power and speed required to test out multiple product, service or experience concepts relative to each other, all based on user research. Concepts can be assessed according to different criteria too, such as likelihood to purchase, frequency of use, and liking. Concept testing tools should include both the survey software and the data analysis capabilities in one package.

Market segmentation and positioning
Market segmentation and position is foundational to product management, since it helps make sure the product is aimed at the right people. Digital tools can separate your audience according to important data like income, locale, shopping habits and more.
As well as helping you break up your target audience into segments, market segmentation tools with AI capabilities can tell you which market segments offer the most potential for growth or revenue, and find previously undefined segments with potential for your business.
Customer feedback
Collecting customer feedback at scale has never been easier thanks to automated digital tools. Product managers can present customers or target audiences with contextual, low-effort feedback opportunities such as web intercepts and feedback buttons, or run multi-channel survey programs with built-in data analysis. The best platforms will combine this data with existing business information to create a deep and nuanced picture of the ‘how’ and ‘why’ behind this feedback.
Pricing research
Setting the appropriate price for a product or service is crucial, and well worth some detailed research. Fortunately, it becomes much easier when product managers have access to pricing tools that automate the data collection and analysis. Powerful tests such as Gabor Granger analysis and Van Westendorp price sensitivity become quick and easy.
The Qualtrics platform can do all of the above and more. Our tools are geared around bringing the customer voice into every aspect of the product management journey, so that you can build amazing products and services that audiences love. To learn about experience management for product managers, request your free demo.