
You've spent hours working on your survey project—from identifying the research objectives and collaborating with stakeholders, to crafting questions and setting it up in Qualtrics. You need to gather a certain number of responses, but learn that you fell short of your goals because fewer people have completed your survey than expected. While this scenario can be influenced by factors beyond the survey designer’s control such as increased survey fatigue and the diminishing attention spans of respondents, there are actionable steps that can be taken to improve completion rates, ensuring both adequate sample sizes and high-quality data.
Calculating survey completion rate
The survey completion rate is the percentage of people who submitted their responses out of all eligible people who started the survey. It’s important to differentiate survey response rate and survey completion rate. Survey response rate refers to the percentage of people who completed a survey out of all eligible people sent the survey.
There are two key differences between survey response rate and survey completion rate:
- To accurately calculate the survey response rate, one needs to be aware of the number of eligible respondents contacted. For instance, the response rate can be determined when the survey is emailed to a specific list of customers who have made at least one purchase in the past 30 days. In contrast, calculating the response rate becomes challenging when the survey is made available on a website for all visitors, as the total number of eligible participants is unknown. On the other hand, one needs to know the number of respondents who started the survey to calculate the completion rate.
- Survey completion rate is primarily influenced by the design of the survey itself, while survey response rate is additionally also influenced by the delivery method, timing, and message as well.
Tips for preventing drop-offs and increasing your survey completion rate
Shorten the length of your survey
Our data has shown that surveys longer than 12 minutes on desktop and 9 minutes on mobile start to see drastic respondent drop off. It is important to think about the length of your surveys as the predicted amount of time they will take, rather than the number of questions they have. While there are instances where more comprehensive surveys are needed to answer complex research questions, there are several ways to decrease survey length without significantly compromising data quality:
Only ask what’s necessary
With certain populations that are hard to reach, it’s understandable that you would wish to squeeze in as many questions as possible in your surveys. However, including unnecessary questions might actually cost your valuable responses. Prior to drafting your survey questions, it’s crucial to collaborate with your stakeholders and identify the research questions to be answered. Then prioritize them based on the urgency and potential impact once answered. With the most important research questions in mind, start crafting your survey in Qualtrics with survey questions that help you answer them before evaluating whether the other good-to-know questions should be added. Additionally, it’s also great to be mindful of what and how many questions you mark required to answer.
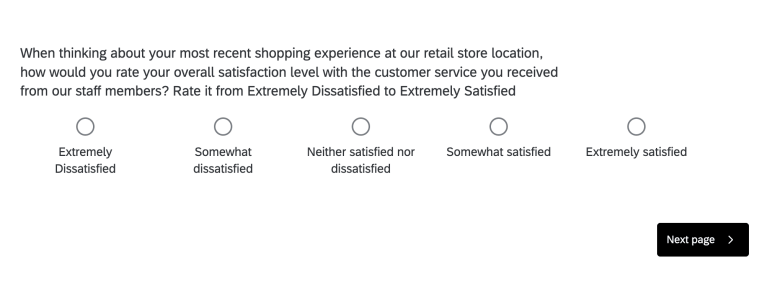
Ask your questions in a concise manner
Asking questions and giving instructions in a concise manner can save respondents a lot of time. Not only do verbose questions take them longer to read, but they can also increase the cognitive burden of your respondents.
Instead of:
Try this:
Use conditional logic to segment survey respondents
It’s a frustrating experience for survey respondents to see irrelevant questions that they don’t have an answer to. At best, they struggle to provide valuable feedback, at worst, they will abandon the survey completely. To ensure a good survey taking experience and high quality data collection, consider using Qualtrics built-in features to direct survey respondents to only see a specific set of questions. There are two ways to achieve this:
- By using Branch element in your Survey Flow to assign different survey paths for respondents based on context attributes (e.g. location, language, subscription tier that are stored in your Qualtrics XM Directory) and/or their answers to the previous questions in the survey.
- By using question-level Display or Skip Logic in your survey builder to have more granular control over whether a specific question is shown based on answers to previous questions.
Uncomplicate the questions for respondents
Start with easy questions and save demographic questions for last
Begin your survey with interesting and straightforward questions. These initial questions should be easy for respondents to answer, helping to build momentum and ease them into the survey. This approach not only captures their interest from the outset but also encourages them to continue through to the more complex or detailed sections that require more effort to complete. Consider grouping your questions by relevance rather than jumping back and forth between topics. Respondents are more likely to complete the entire survey if they feel comfortable and intrigued right from the start, and find the progression of questions logical and easy to follow.
Consider placing detailed demographic or other sensitive questions at the end. Asking for personal information upfront can feel intrusive and may lead to early drop-offs. By engaging respondents with your main survey content first, you build investment in the process. When they reach the demographic section, participants are more likely to recognize the value of their input, making them willing to provide the additional information. This thoughtful sequencing can enhance the overall completion rate and the quality of your demographic data.
Limit the number of open-ended and matrix questions
While it’s relatively straightforward for survey builders to ask an open-ended question, it takes a significant amount of effort for survey respondents to think about their answers, formulate their thoughts into coherent sentences, and type them in. We have found that on average survey completion rates begin to decline when the survey has more than three open-text questions. Before you choose to add an open ended question to your survey, please remember that it is a lot of effort for respondents to respond and might lead to drop off. Additionally, open ended questions require more time and energy to analyze results. It isn’t guaranteed that you will collect quality responses that lead to rich insights.
Learn more about how to write effective open-ended questions.
If open-ended questions are necessary to answer your research questions, consider utilizing Qualtrics’ new AI feature “Adaptive followup”. It leverages artificial intelligence to analyze respondents’ initial answers to open-ended question and creates personalized, contextually relevant follow-up questions. As a result, not only do survey takers experience more engaging surveys that feel conversational, but survey builders also gather richer, more meaningful insights from their open-text questions, all without increasing respondent burden. Recent research found that surveys using Adaptive followup identify twice as many topics while keeping respondents highly engaged.
Learn more about Adaptive followup and how to try it out yourself.
Similarly, Matrix questions can also easily overwhelm your survey respondents as it’s easy to cram as many questions as possible into one single matrix question. It might lead to lower completion rate, or worse, it might lead to “straight-lining” where respondents provide their answers to a series of questions in the same place on a rating scale. Consider limiting each matrix question to only include five columns and five rows if possible so that it’s more manageable for survey respondents.
Optimize surveys for mobile
It’s worth noting to consider what types of devices your audience will likely be when deciding the types of questions to ask. For example, if you work for a fast-food restaurant and you would like to put together a survey to understand customer satisfaction post-transaction, it’s reasonable to hypothesize that they will most likely receive the survey invitation on their mobile phones while they are on the run. If that’s the case, be cautious including questions that aren't mobile optimized, such as long lists that require a lot of scrolling and images that might need longer time to load.
Learn more about mobile survey optimization.
Limit the use of a progress bar
Research shows that progress bars are effective for boosting completion rates only when the survey length is as short as or shorter than respondents’ expectations. The effectiveness diminishes in surveys with complex logic, where the progress bar can change unpredictably based on respondents' answers, making it an unreliable indicator of actual progress. An alternate approach is to use text transitions to inform respondents of their progress. For example: “Thank you for your participation. You're nearing the end—just one more section to go.”
Offer incentives when appropriate
Research has demonstrated that offering an incentive might lead to higher survey completion rates, especially for longer or more burdensome surveys. Incentives can be monetary in nature, this includes offering cash upon completion of a survey and providing gift cards for online retailers. Incentives can also be non-monetary, like coupons, discounts, and free products. Another form of incentive is psychological in nature, such as acknowledging participants for taking the time to provide feedback and help shape a new product launch, or offering to share the results of the survey study to demonstrate the value of their contributions. It’s important to consider the appropriate amount of the incentives as well as whether they are likely to introduce bias as some participants might rush to complete the survey for the incentive.
Ready to get started? Learn how to pretest surveys